By Leaha
Last updated on May 19th, 2026 at 16:03
In this article we will be exploring how to use the Management Pack Builder within VCF Operations to get metrics from applications that VCF Operations has no native support for, into the platform, where we can create dashboards and really start to centralise our IT monitoring
So how does it work – Well, it provides a code-less solution to get metrics from anything by its API, as long as the data is returned in a format VCF Operations can understand, it can get the data into its system where we can do what Operations does best, dashboards
As its also used at home, some systems, like my plan for Home Assistant, may not be as useful in the business, but the more data points that are added, the better an idea you will have on how it works, and how you can apply it to best meet your needs
Important – By continuing you are agreeing to the disclaimer here
1 – Management Pack Builder
Before we can start we need to build our management pack to get the data into VCF Operations
1.1 – Veeam Backup & Replication
What I have added below is not an exhaustive guide of everything that can be added, for a full list, look at Veeam’s documentation on their API, various bits on information have been gathered from it, can be found here
Its also worth noting, section 1.1.1 covers the base and single request, other sections in 1.1 add additional requests, any time you make any changes in the management pack builder and want to re install the pack, you must uninstall the pack, which removes all data and will break any dashboards, and re install it
So I would recommend adding all requests off the bat, having too many metrics isnt really an issue anyway
1.1.1 – Setup And Licensing Request
In this section we will cover setting up the base and adding a single request, additional requests will be added later
1.1.1.1 – Adding The Source
Details on here were only possible due to Daniel Krieger’s guide here, so be sure to check it out
I would recommend adding an API user to VBR for this if you use the backup viewer role this can generally read most things, but some bits like licensing it cant
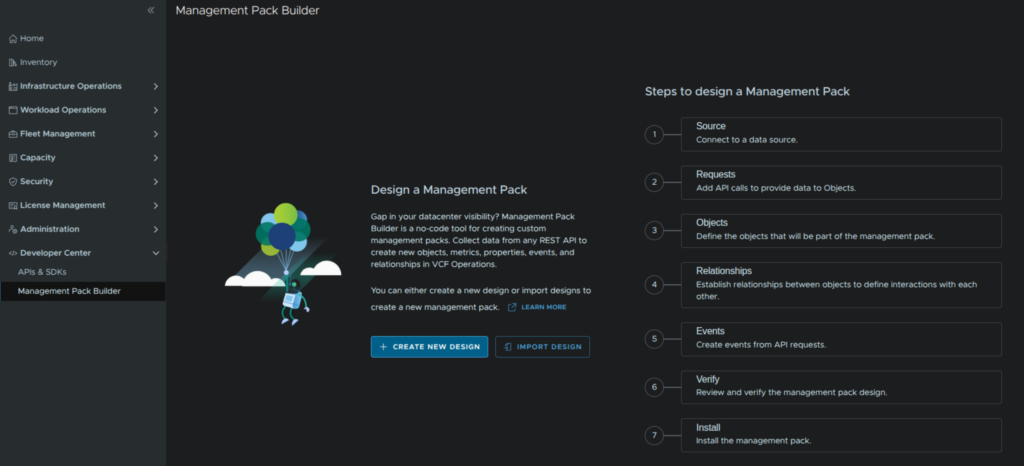
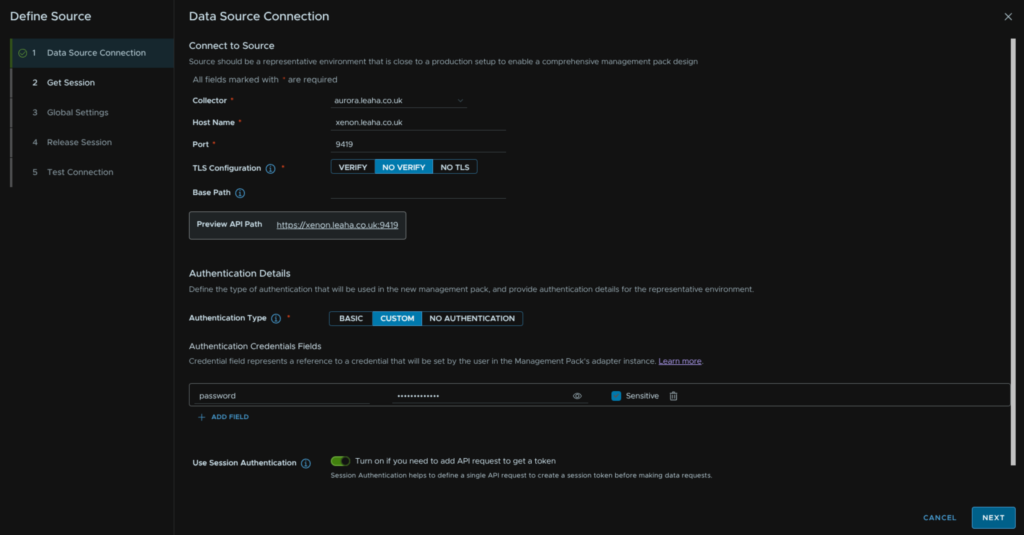
To start building the pack, for 9.0.x, we need to head to Developer Center/Management Pack Builder and click Create New Design
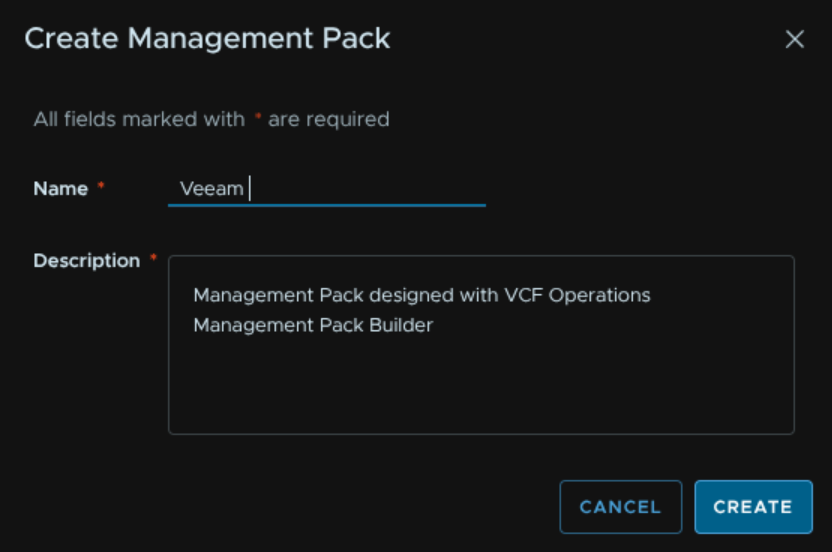
Give it a name and click Create
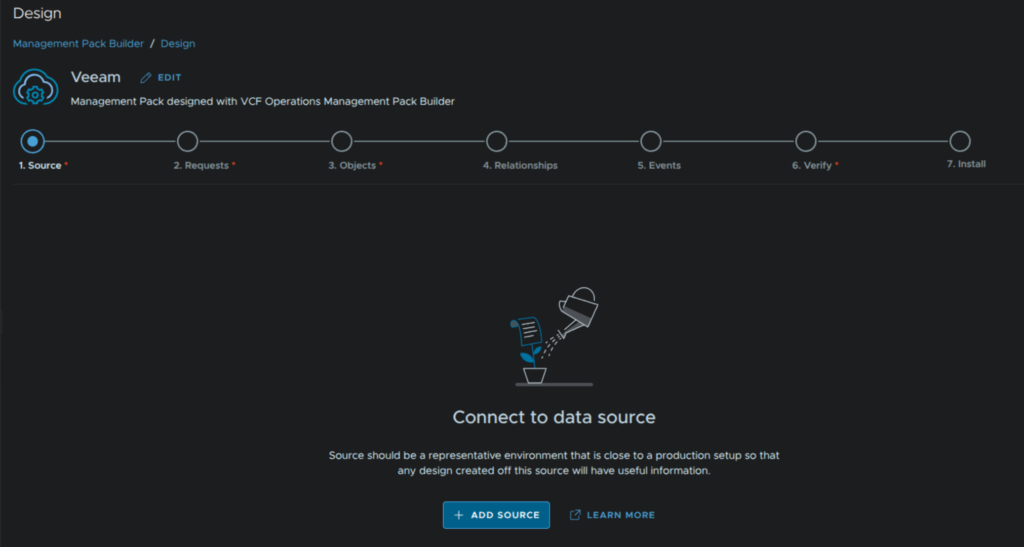
We then need to click Add Source
We then need a few bits
- Our collector, dont use the Ops built in collector, use the dedicated cloud proxy appliance collector if its available
- The VBR server FQDN
- The port, which for VBR, the API is accessible on 9419
- TLS needs to be no verify
- We need Custom authentication type here
- And add a variable called password, and enter the password for the user this pack will use, in my case, a dedicated API user with administration permissions – some values cant be read with read only
Make sure you then enable the toggle for Use Session Authentication and click Next
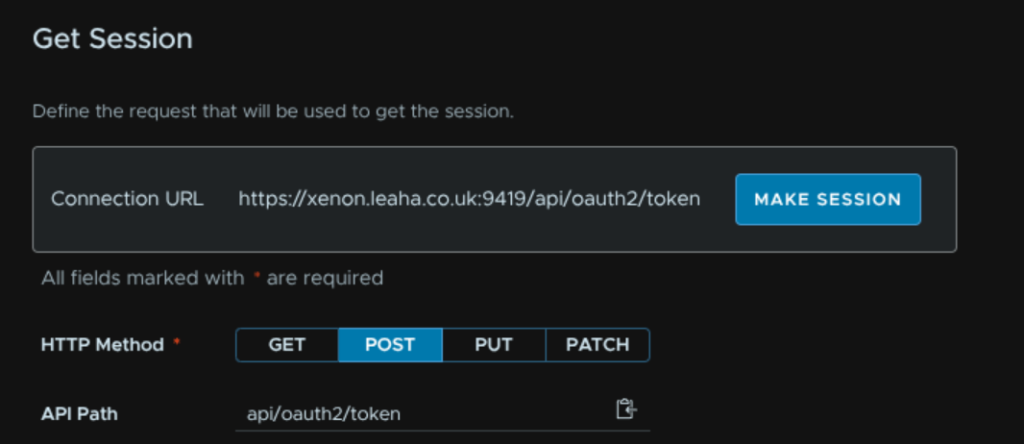
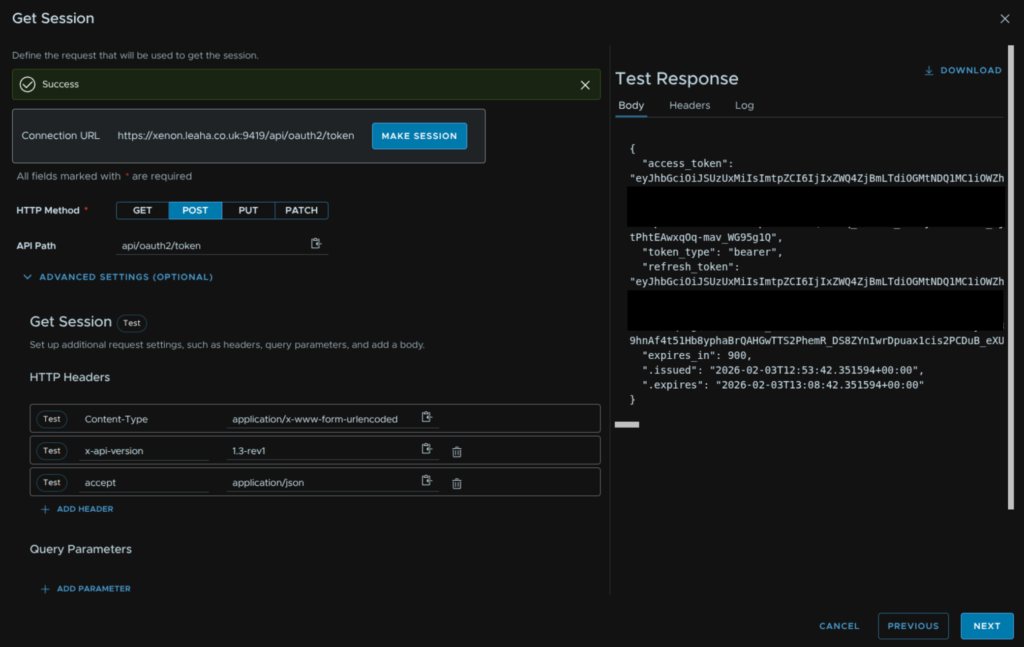
Now we need the HTTP method, this needs to be POST, and add an API path of
api/oauth2/token
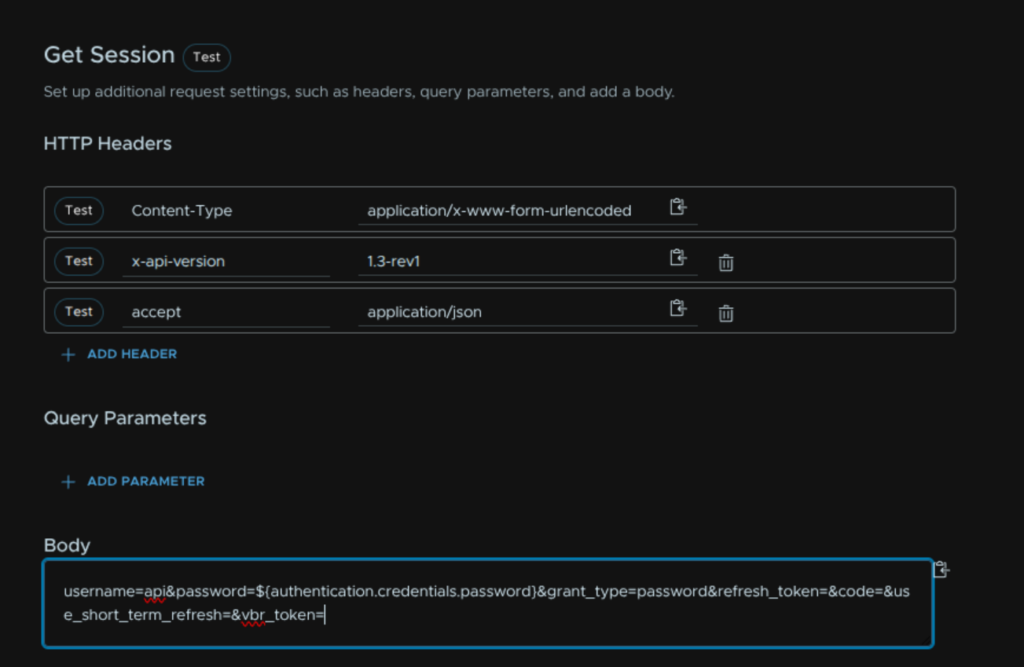
Now expand the Advanced Settings, we’ll need a few things here
For the header, we need to set Content-Type needs to be
application/x-www-form-urlencoded
We need to add a new header called, x-api-version, and set its value to
1.3-rev1
And a third header called, accept, with a value of
application/json
Lastly we need a body which should look like this
username=<username>&password=${authentication.credentials.password}&grant_type=password&refresh_token=&code=&use_short_term_refresh=&vbr_token=
As I am using the Windows user, api, I changed the username to api like this
username=api&password=${authentication.credentials.password}&grant_type=password&refresh_token=&code=&use_short_term_refresh=&vbr_token=
Back at the top we can now click Make Session
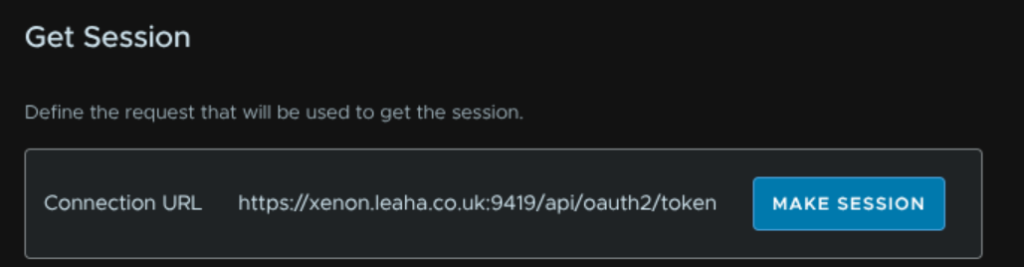
And with a bit of magic, we should see the test response with a new bearer token and it marked as a success, when thats done, click Next
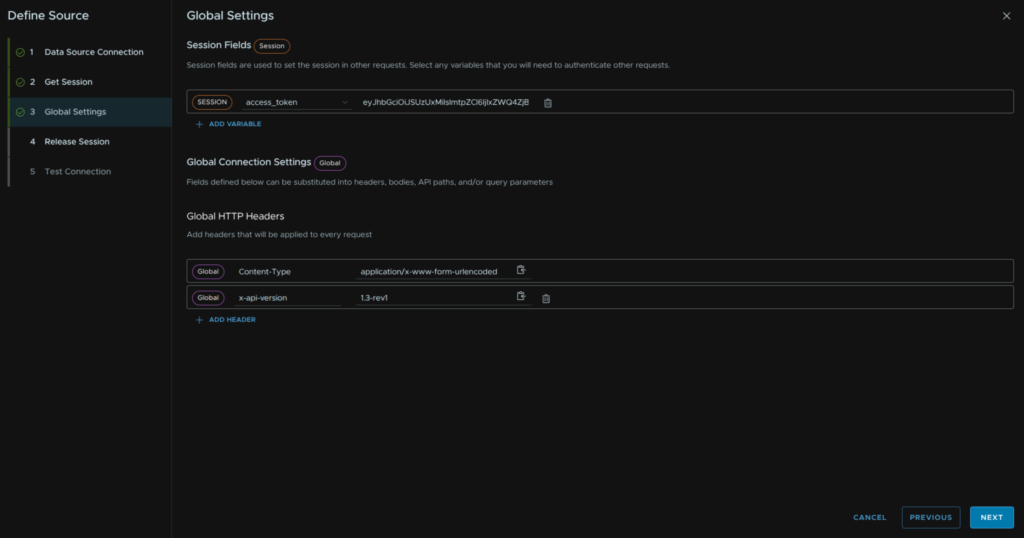
For global Settings, we need to change the Content-Type to the same as we has previously, which is
application/x-www-form-urlencoded
We also need to add a header called x-api-version, and the value needs to be
1.3-rev1
Lastly, click Add Variable in the Session Fields part at the top, the default value will have our access token pre populated
Then click Next
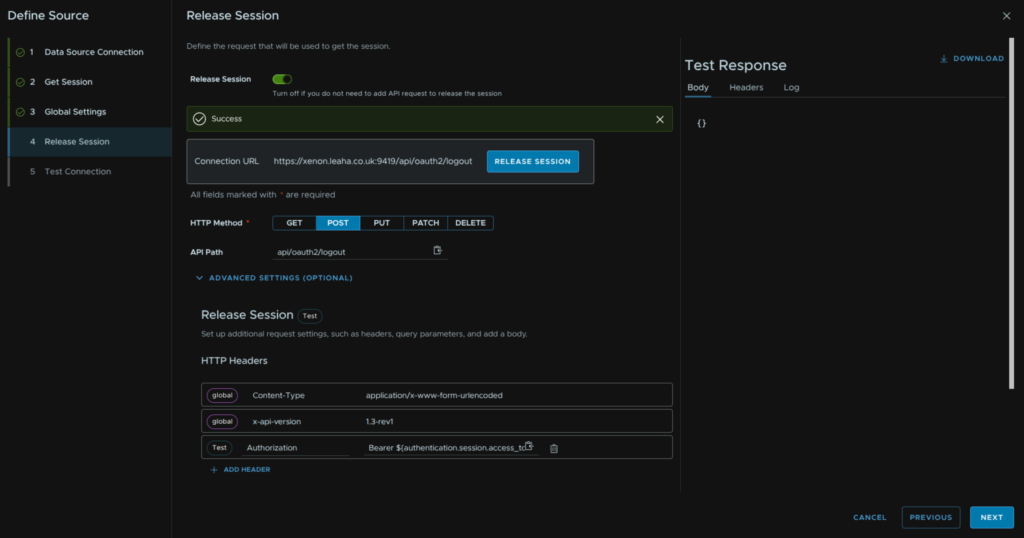
We then need to test the release, for this, we need to change the HTTP method to POST, and the API path is
apt/oauth2/logout
Now expand Advanced Settings and Add another HTTP header called Authorization with the value
Bearer ${authentication.session.access_token}
Now click Release Session to test, this should say success, then click Next
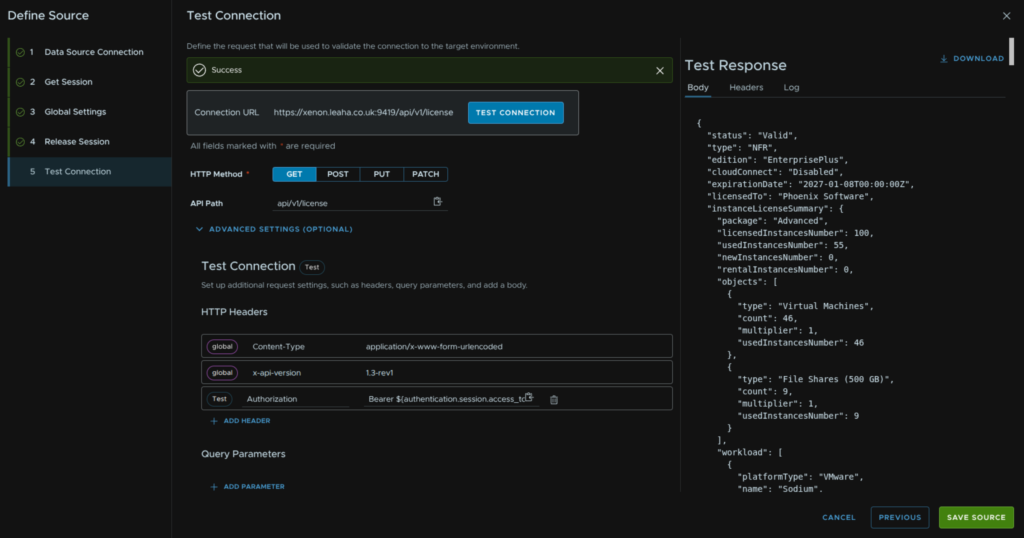
We can now test the API, so to start with lets get our VBR license details, keep the HTTP method on GET and use this API path
api/v1/license
If you get error 403 this is usually caused by not having permissions to view what the API is requesting
We need to expand Advanced Settings and add the same header from before, called Authorization, with the value
Bearer ${authentication.session.access_token}
When we click Test Connection, we should see our licensing information in the output, when you are happy, click Save Source
1.1.1.2 – Requests
Now we have the source configured, click the red exclamation mark on Requests
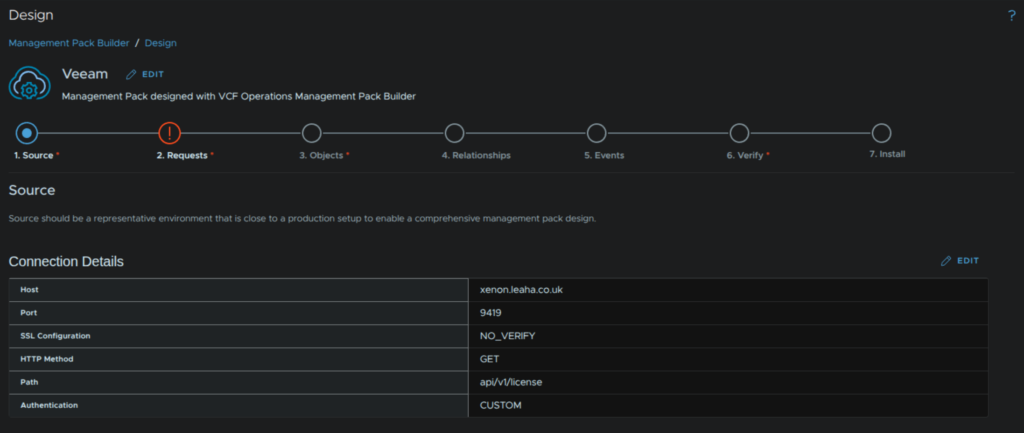
Click Add Request
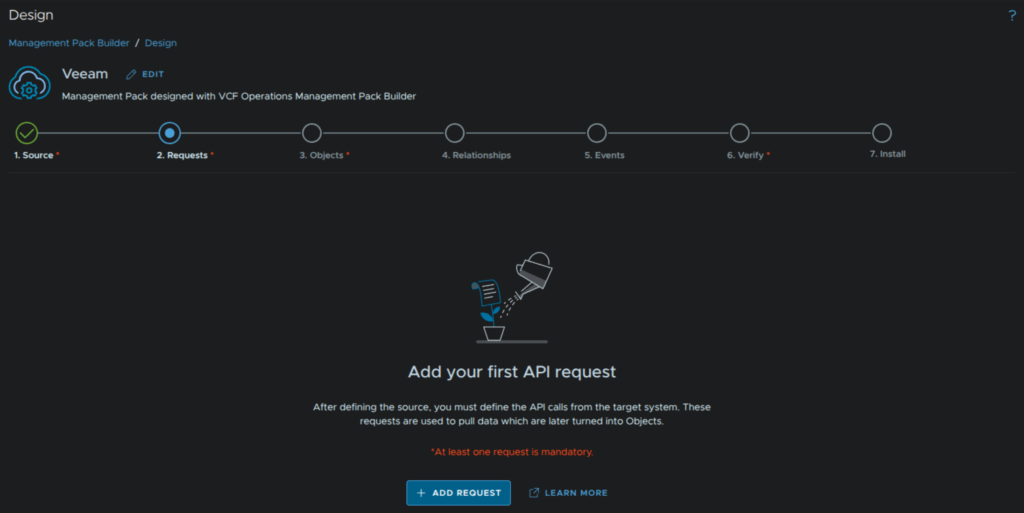
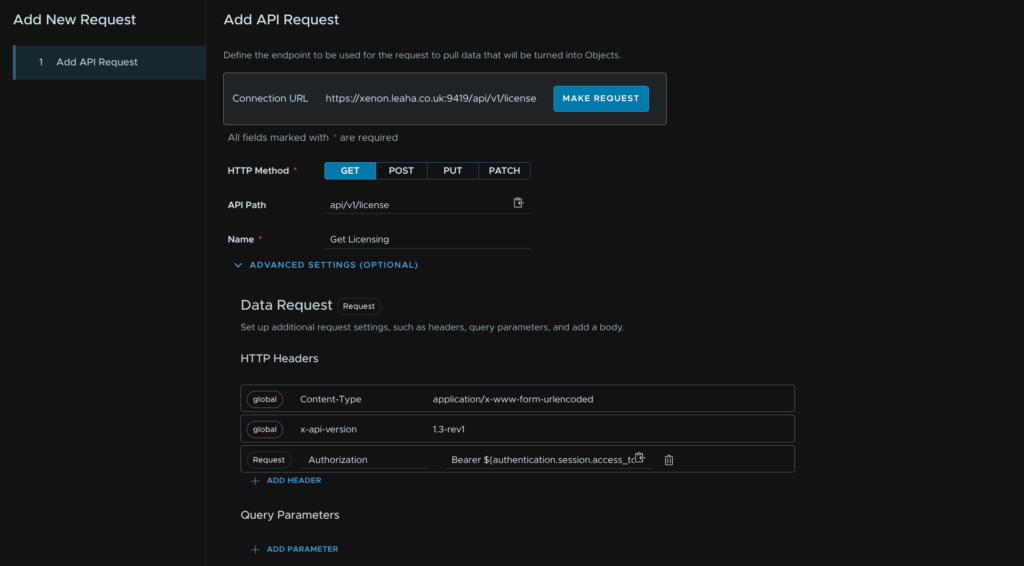
Lets start with one for our license
For the API path fill in
api/v1/license
And give the request a name
Then, under Advanced Settings we need to add a header called Authorization again with the value
Bearer ${authentication.session.access_token}
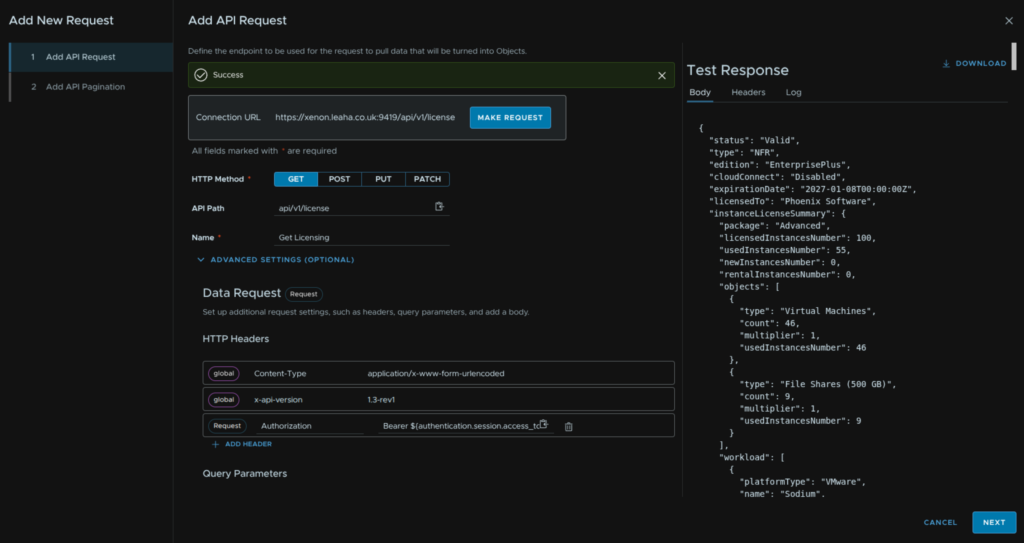
The click Make Request
This should run, and give us the same results as our test, click Next
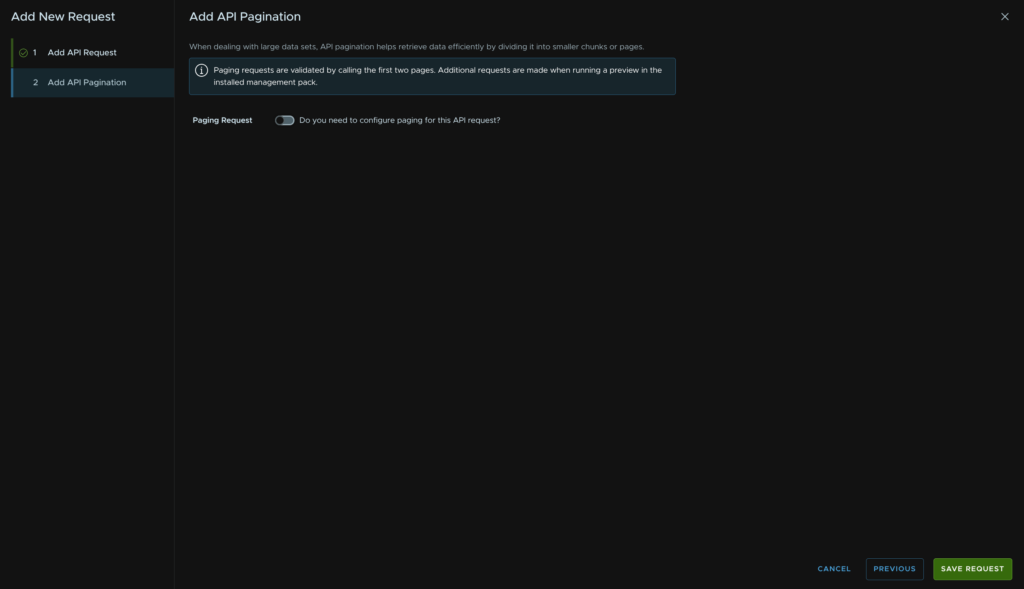
On the Pagination section, we can configure this, but I just disabled it, I am not 100% if/where its needed
When you are happy, click Save Request
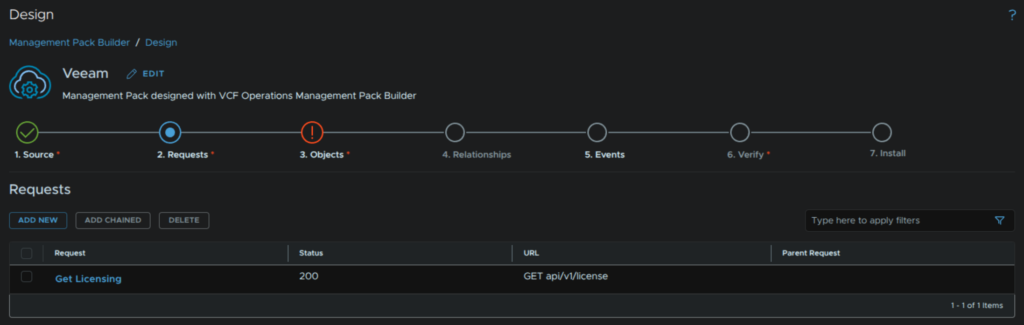
We can add additional requests, but for now I am leaving this blank to come back to later for more data
1.1.1.3 – Objects
Click the red exclamation mark on Objects
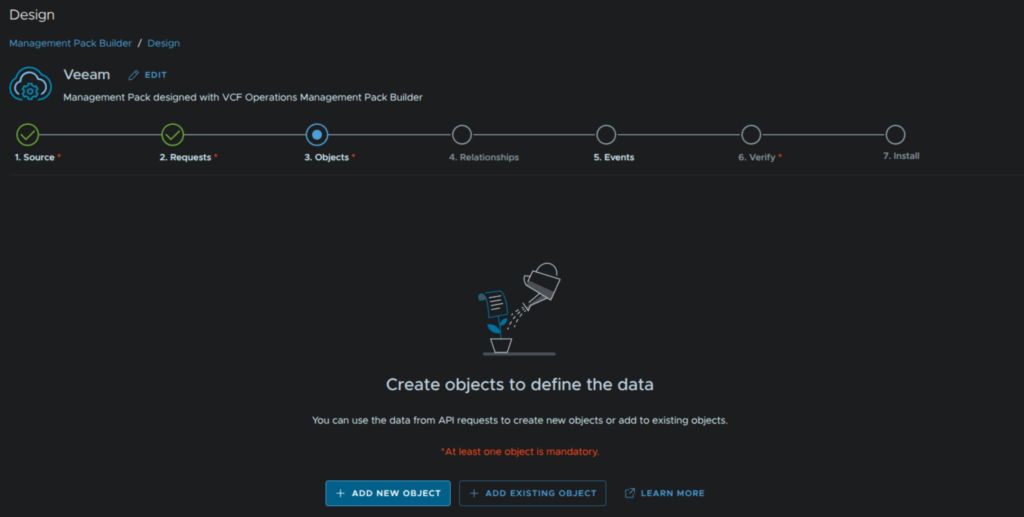
Click Add new Object
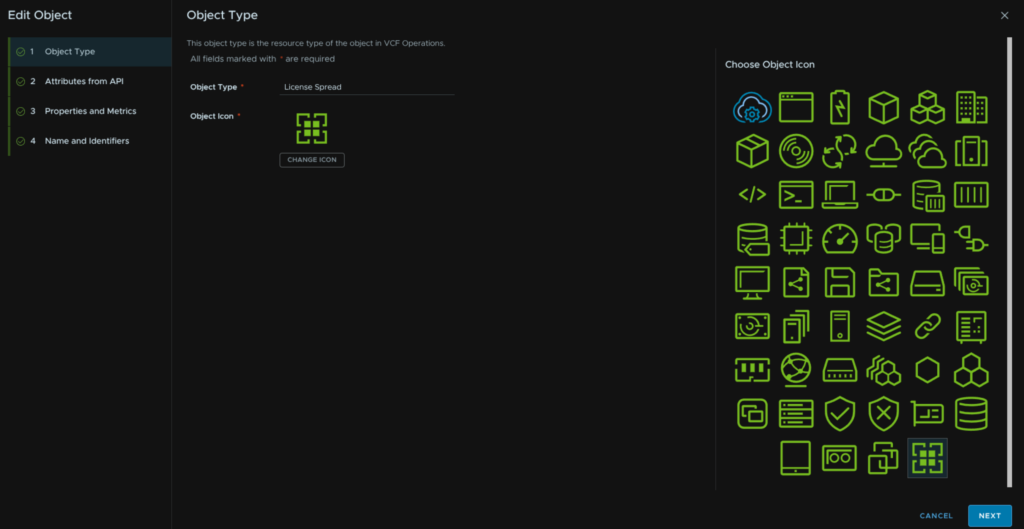
Give the object a name, I called this License Spread, you can change the icon which I did, then click Next
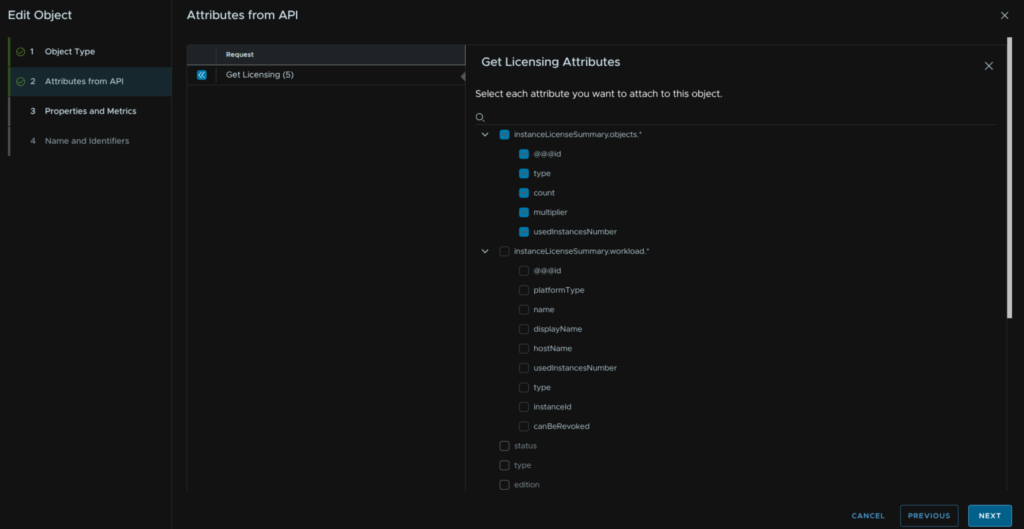
How we need to define this object attributes is going to depend on what you are requesting, in my case, I am doing licensing spread, so I want everything on instanceLicenseSummary.objects*
When you are happy, click Next
I left this on default, then click Next
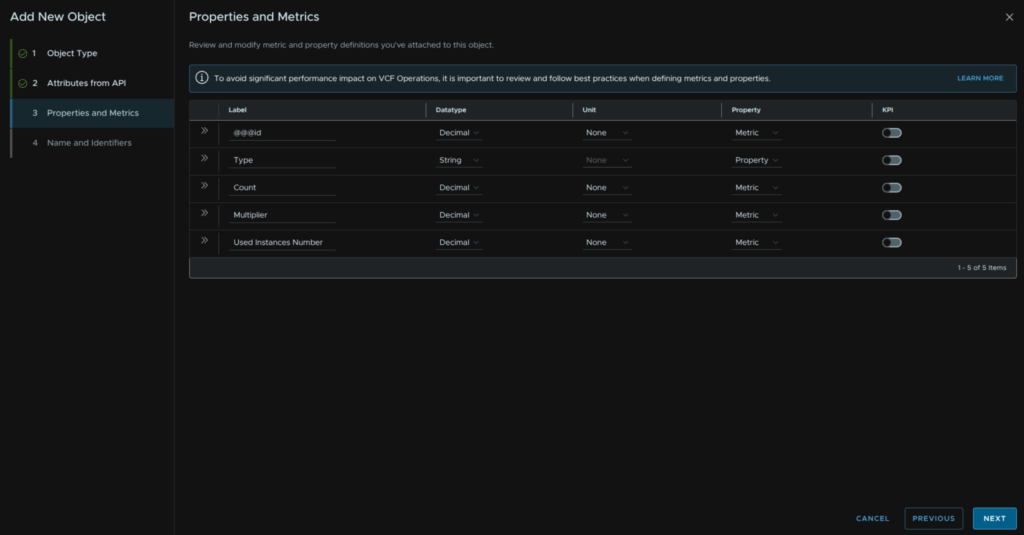
I only had Type available here, so I selected those and clicked Save Object
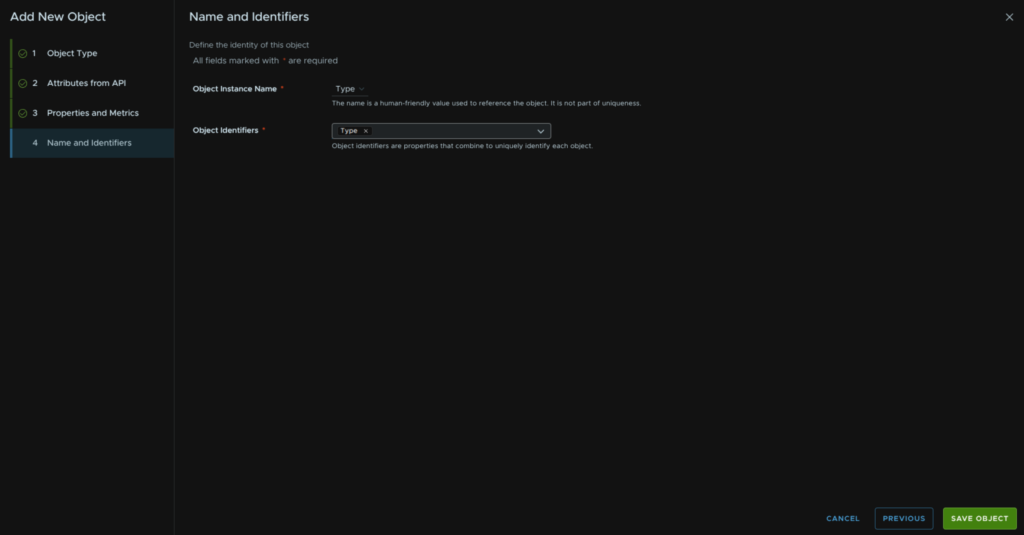
We then want another for our licensing info, since we cannot overlap both on the same object click Add New
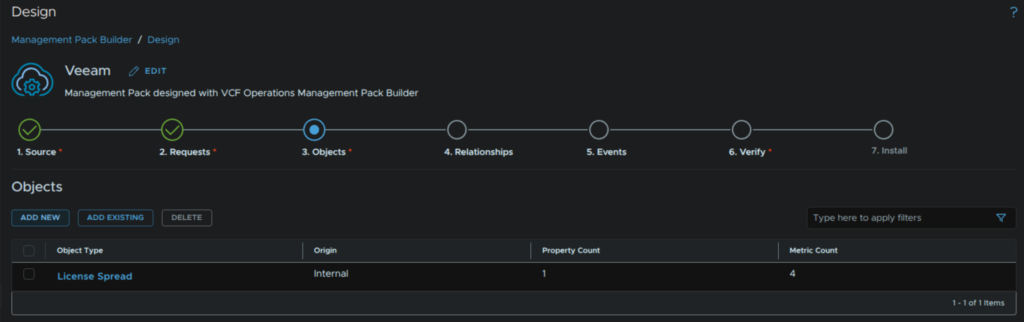
Give this a different name, I went for License Info, we can also change the icon if needed, and click Next
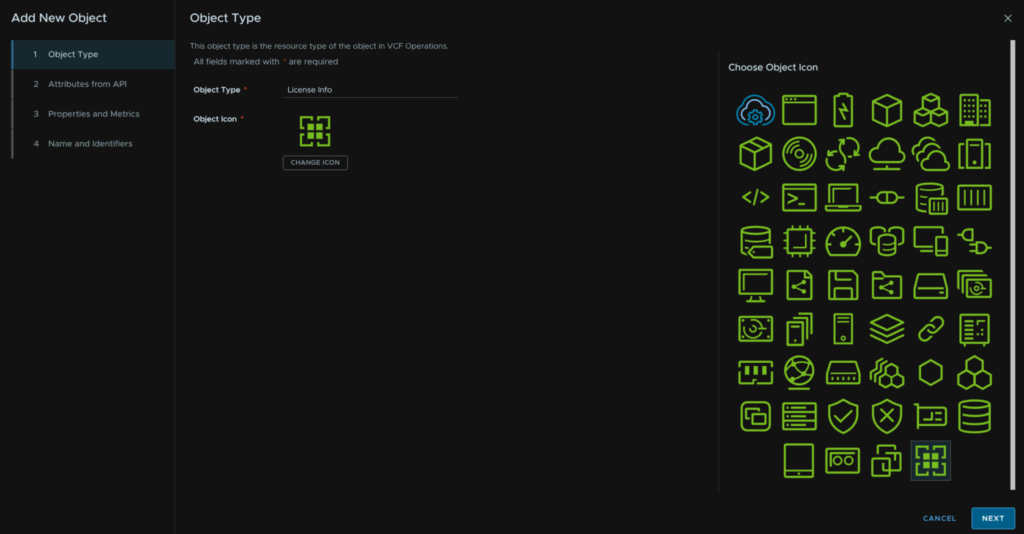
This time we can add several of the metrics at the bottom like so and click Next
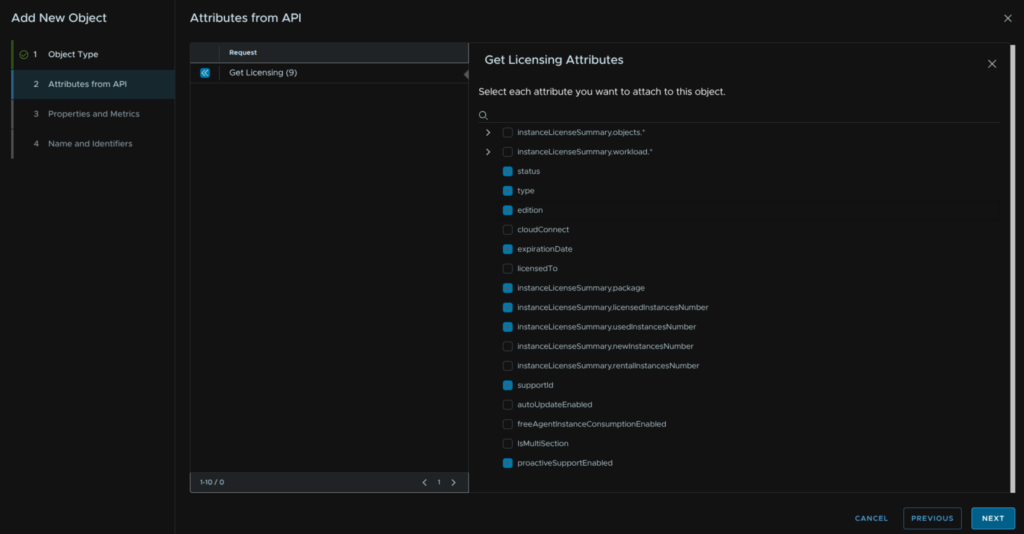
Click Next here
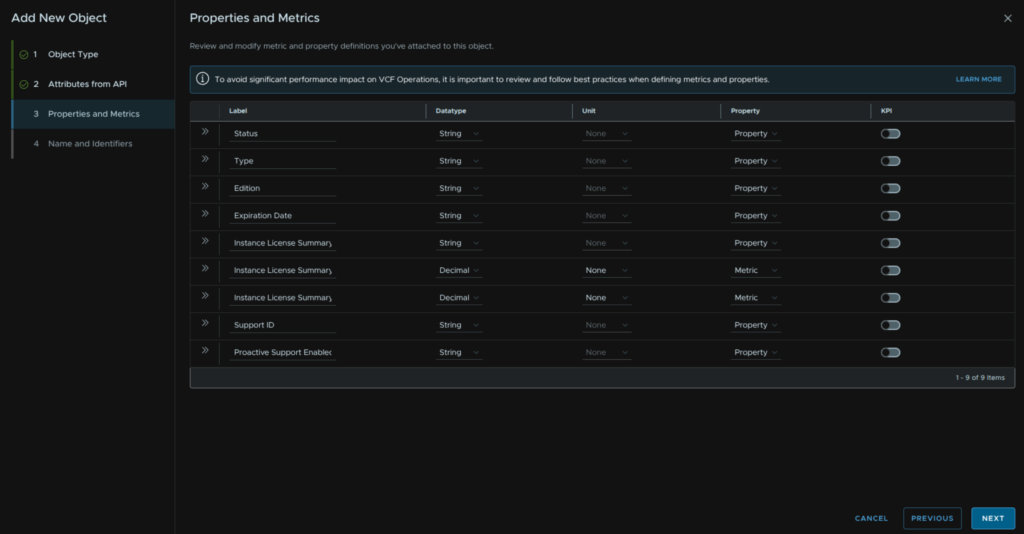
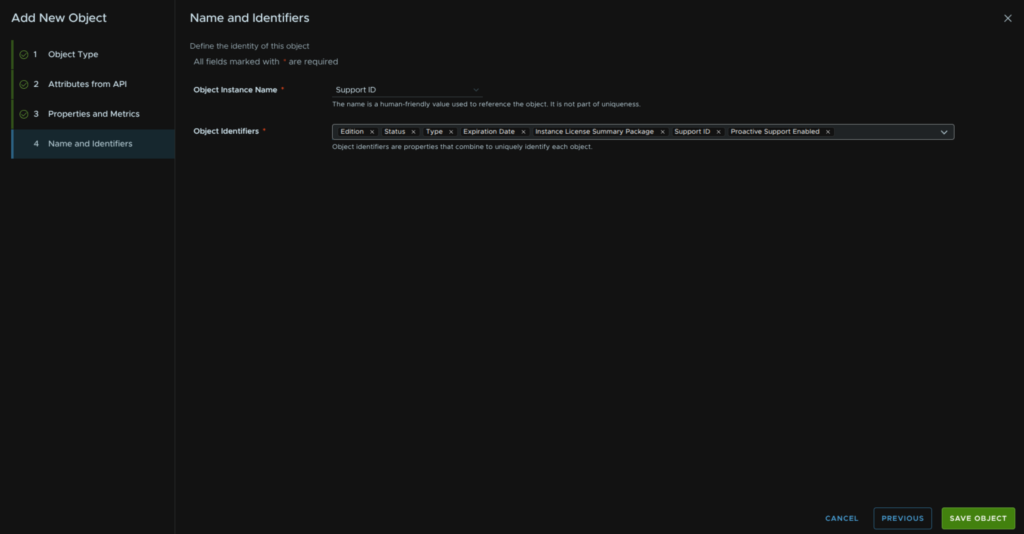
Here I added the instance name as the Support ID, as this should be unique if you have multiple VBR servers, this may need tweaking, and for the Object Identifier add everything and click Save Object
1.1.1.4 – Verify And Install
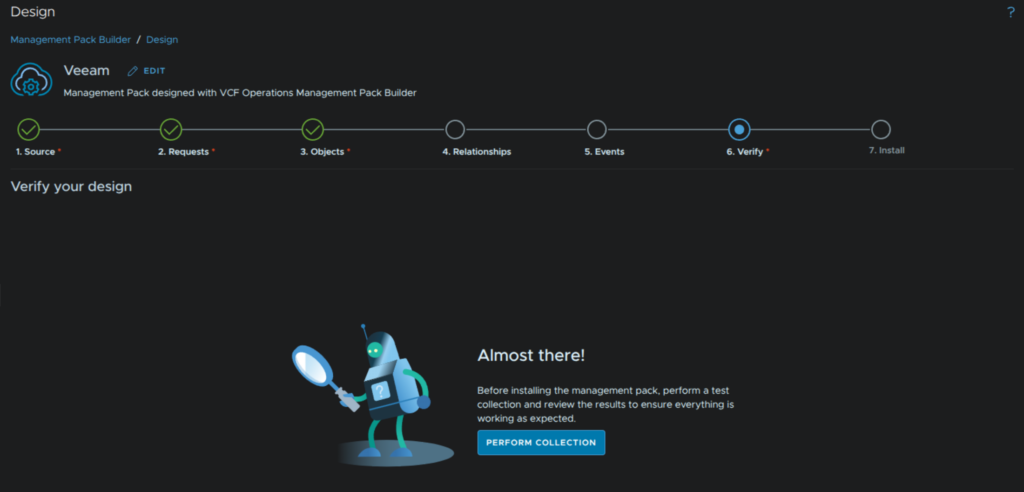
I am skipping over events, for now I want to get the data into VCF Ops and create a dashboard, so lets click Verify and click Perform Collection
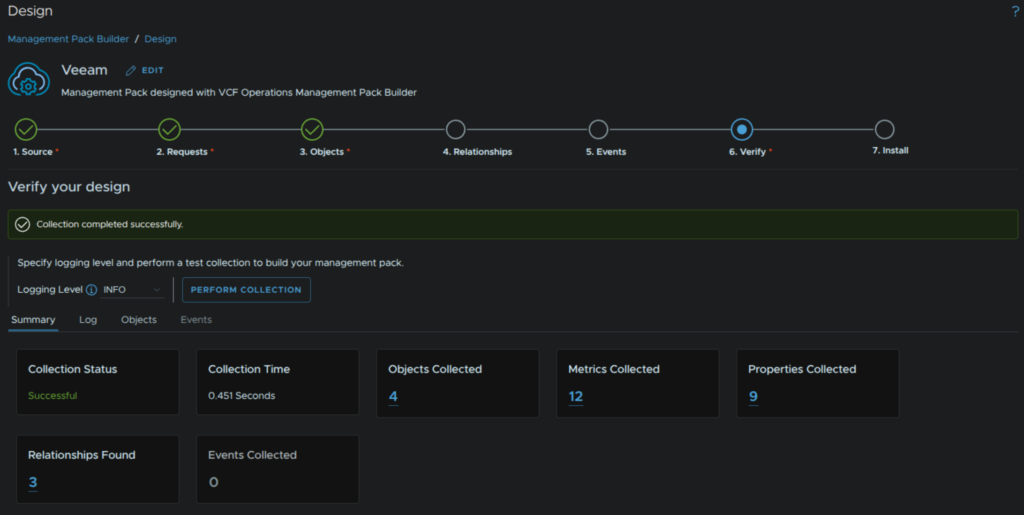
We can now see thats run successfully and is pulling some data in, we can click the number links to see the data
When you are happy, click Install
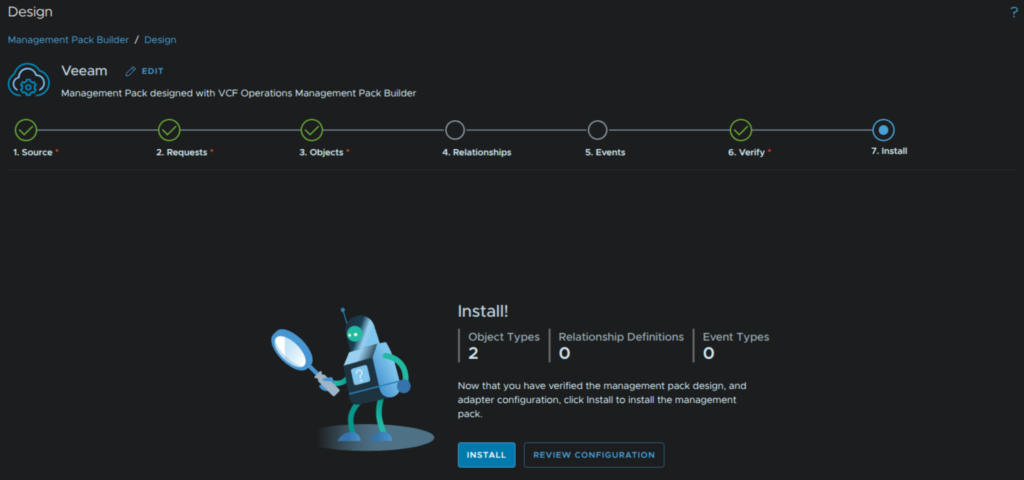
Then click Review Configuration
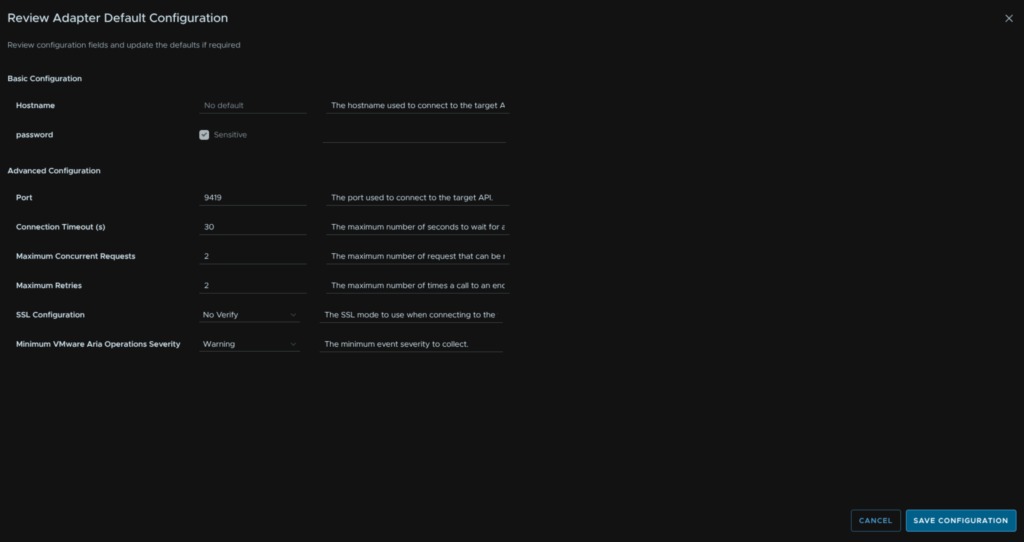
We set the Port to 9419 and the SSL Configuration to No verify then click Save Configuration
Its worth noting, if you add other requests this will need setting each time you try to install it
Then click Install
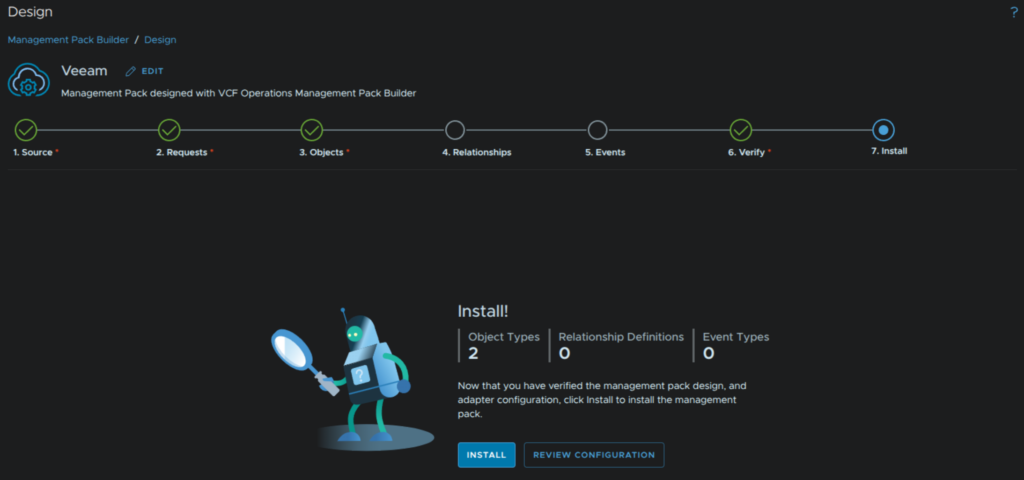
Once thats done we can click View Management Pack
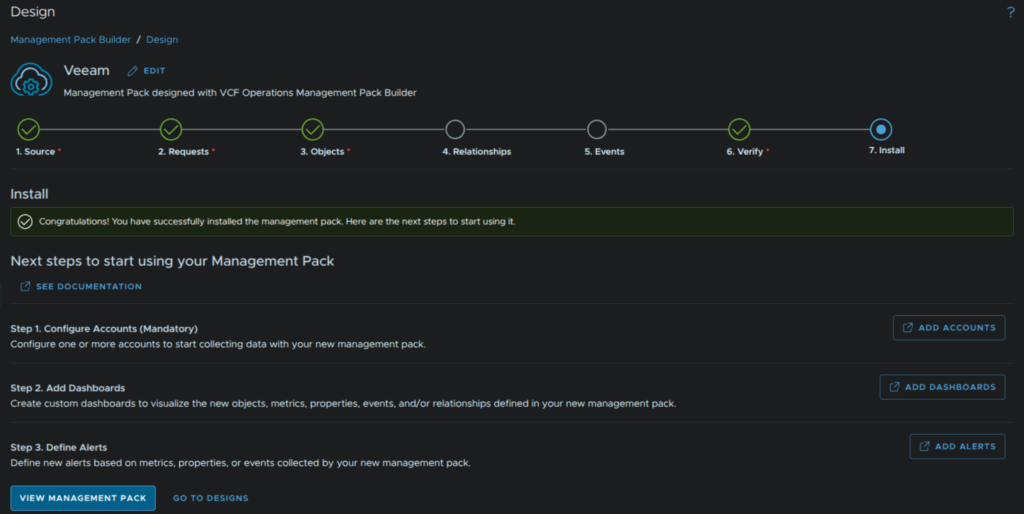
1.1.1.5 – Adding Our VBR Server
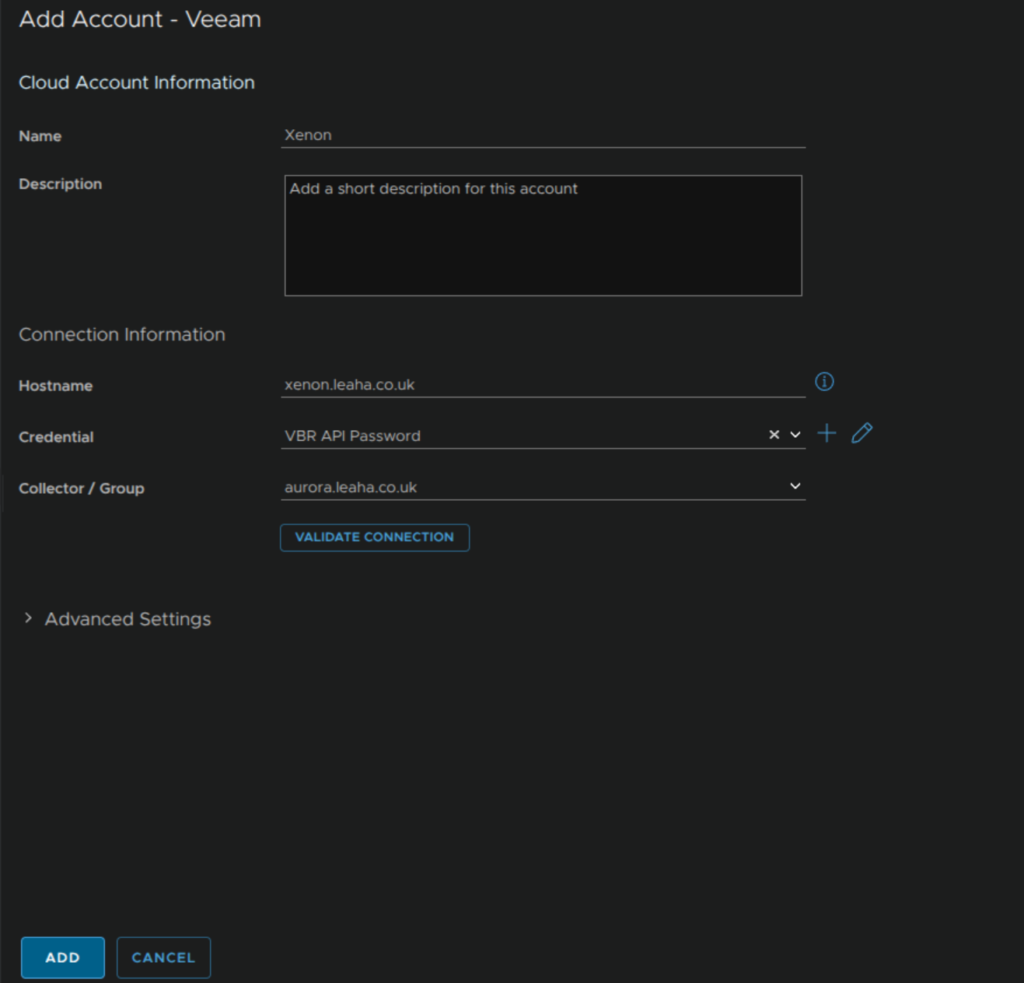
Now the pack is built and setup, we need to connect our VBR instance
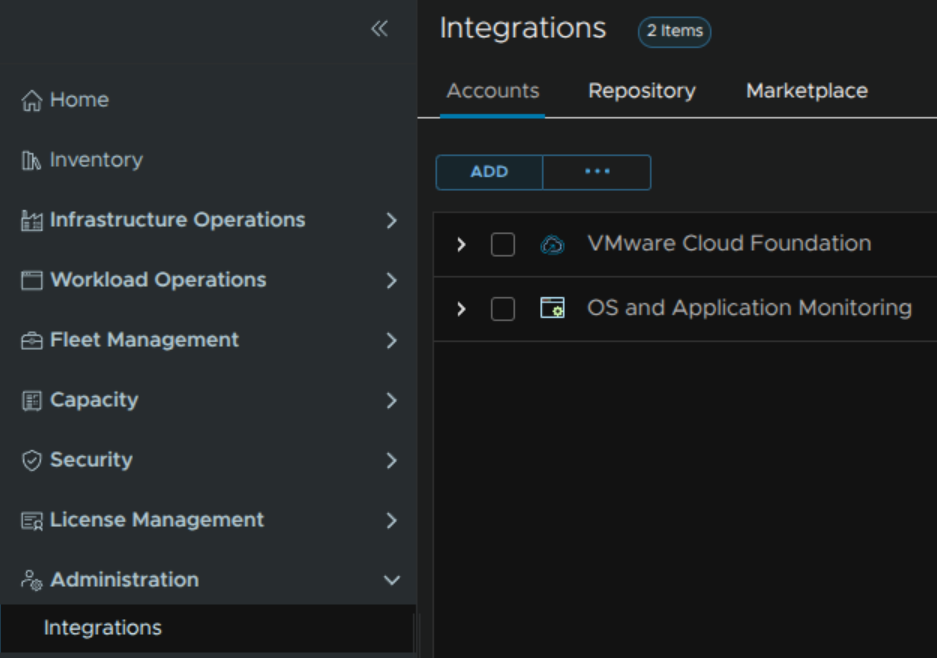
Click our new Veeam type
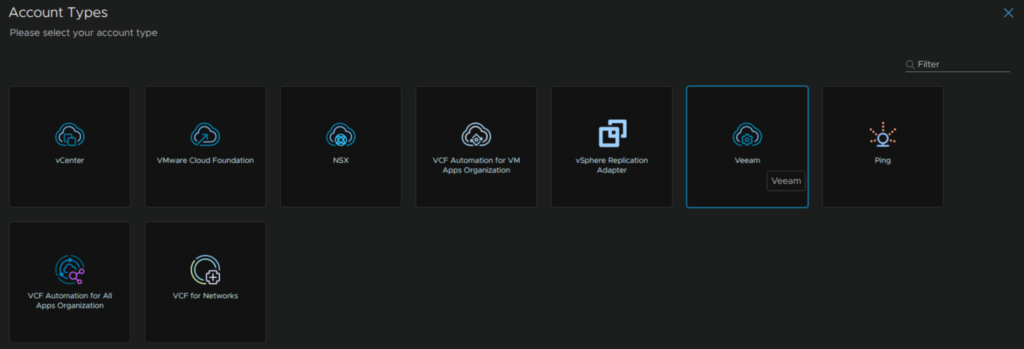
Give it a name and enter the FQDN of the VBR server
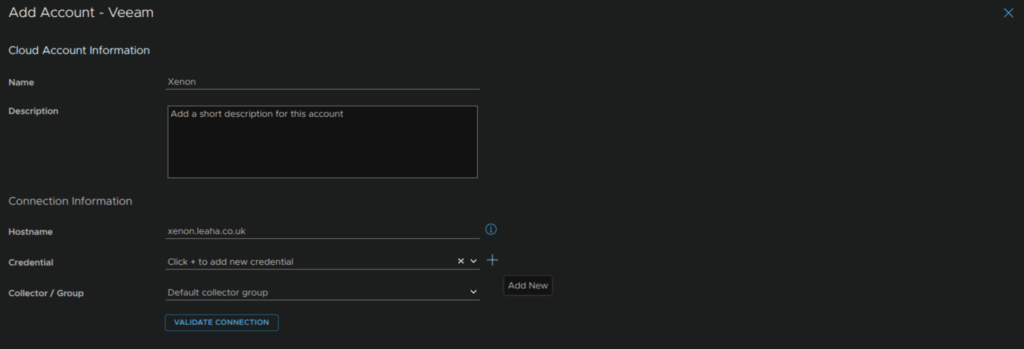
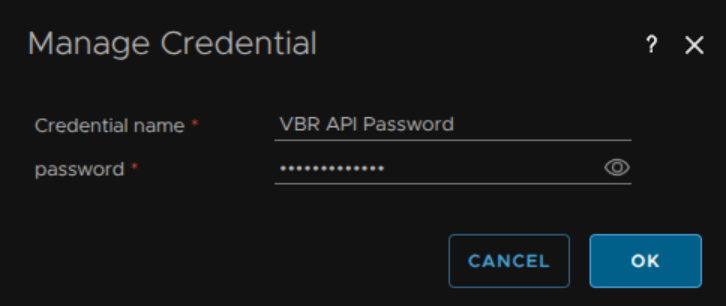
Click the + icon and add the credential for accessing the API, in this case, given we defined the API user in our management pack, we need the password for this account, then click ok
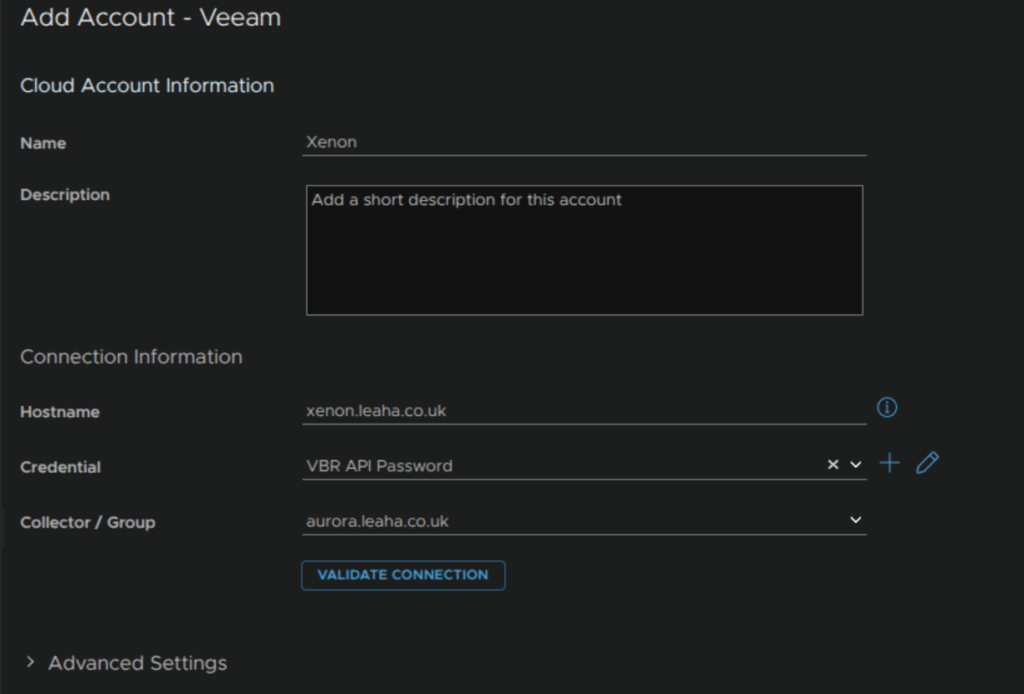
Then select our collector, and click Validate Connection
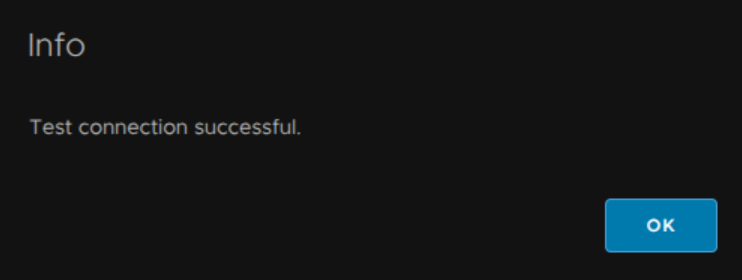
This should be successful, click ok
Then click Add at the bottom
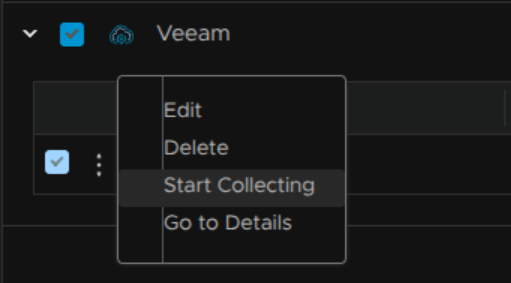
We will then need to click the three dots on our new object and click Start Collecting
Then give it ~15 mins for data to come in
1.1.2 – Adding More Requests
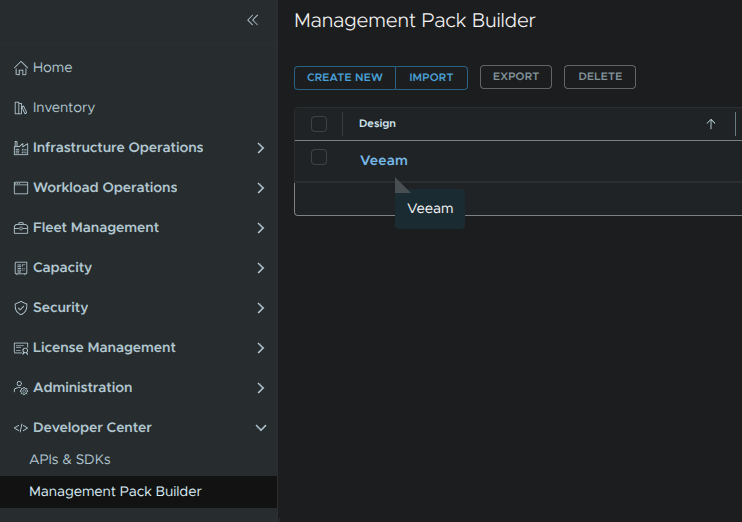
To get back to the menu to add more requests, click Developer Center/Management Pack Builder then click our Veeam design
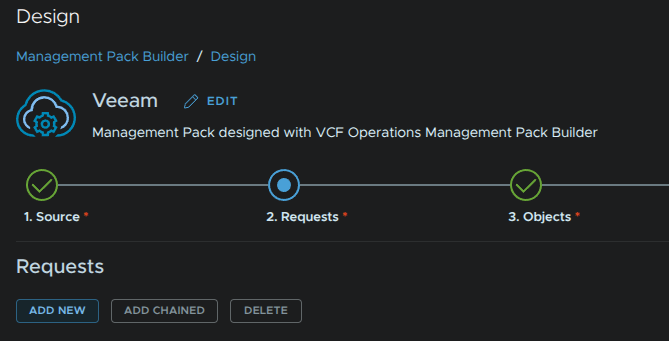
Then click Requests on the top timeline bar, then click Add New
1.1.3 – Get Job States
Make sure the HTTP Method is GET, the API path is
api/v1/jobs
Add a name for the request
We need the variable Authorization into the header with this value adding
Bearer ${authentication.session.access_token}
Then click Make Request
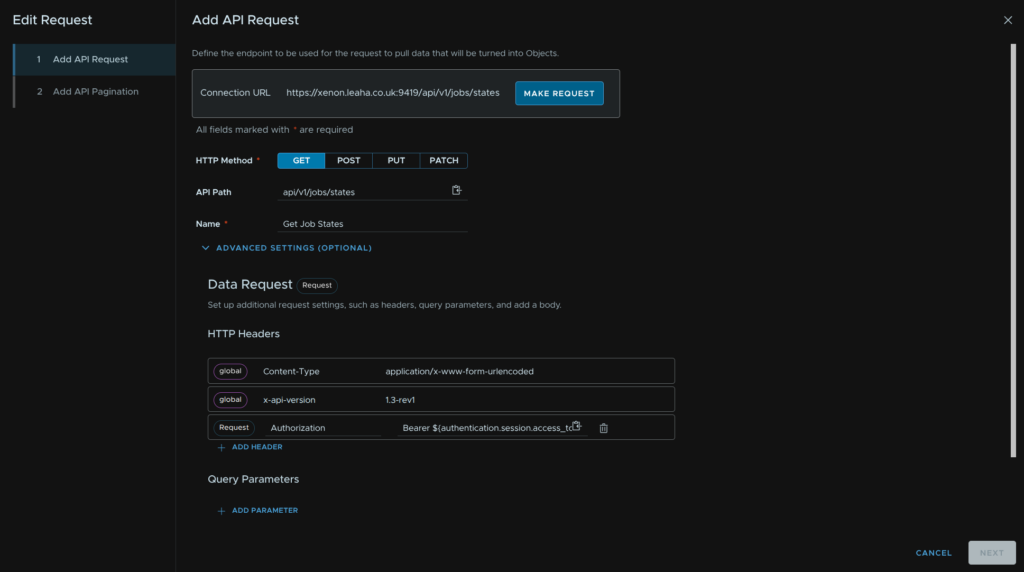
This will return an output and report as successful, then click Next
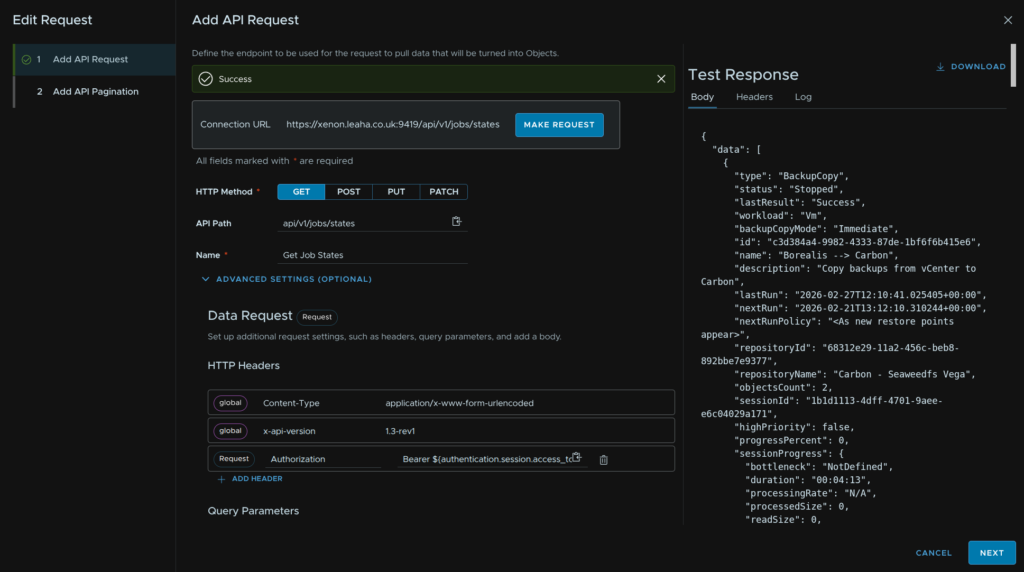
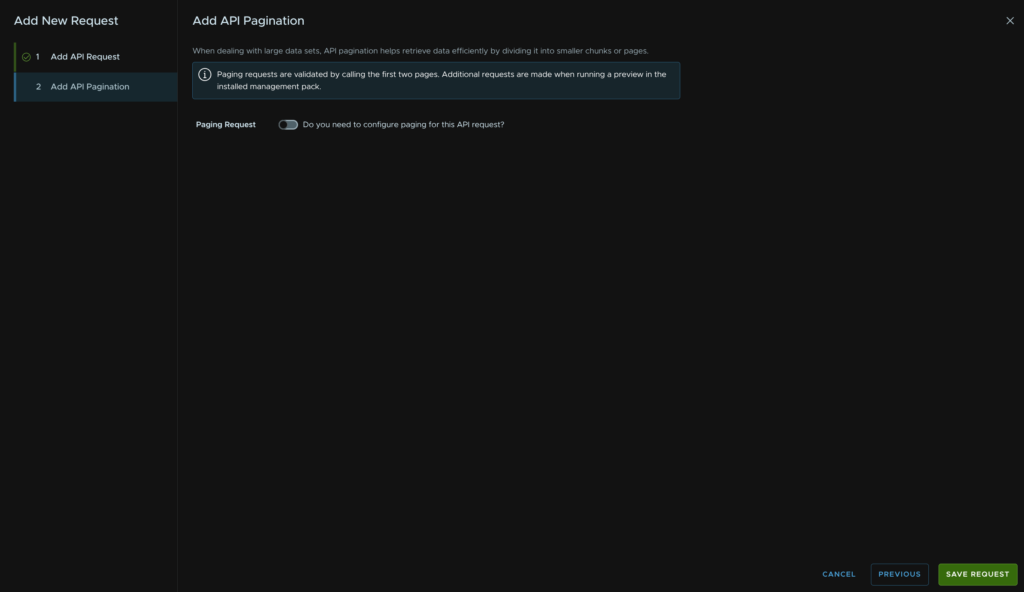
Disable pagination and click Save Request here
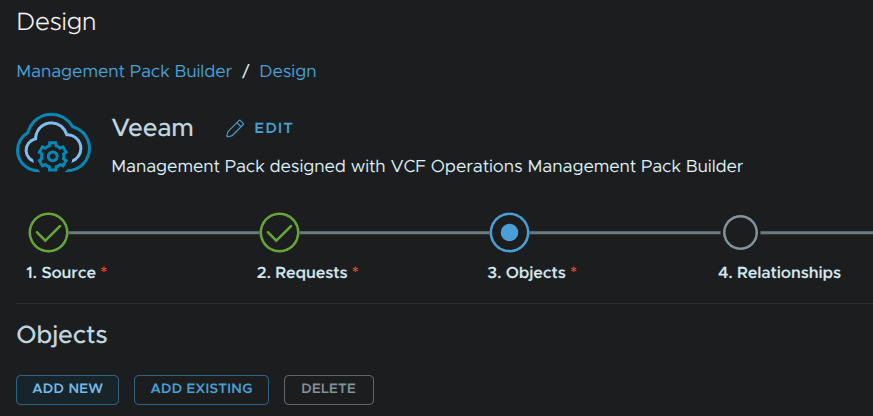
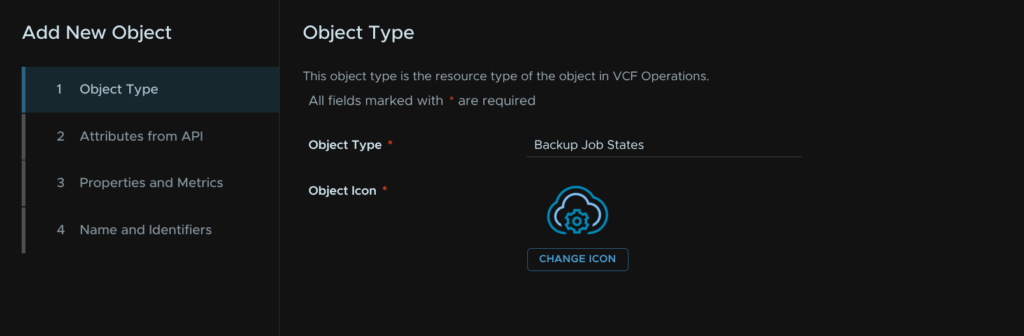
Click Objects in the timeline bar at the top and click Add New
Give it a name and optionally change the default Icon and click Next in the bottom right
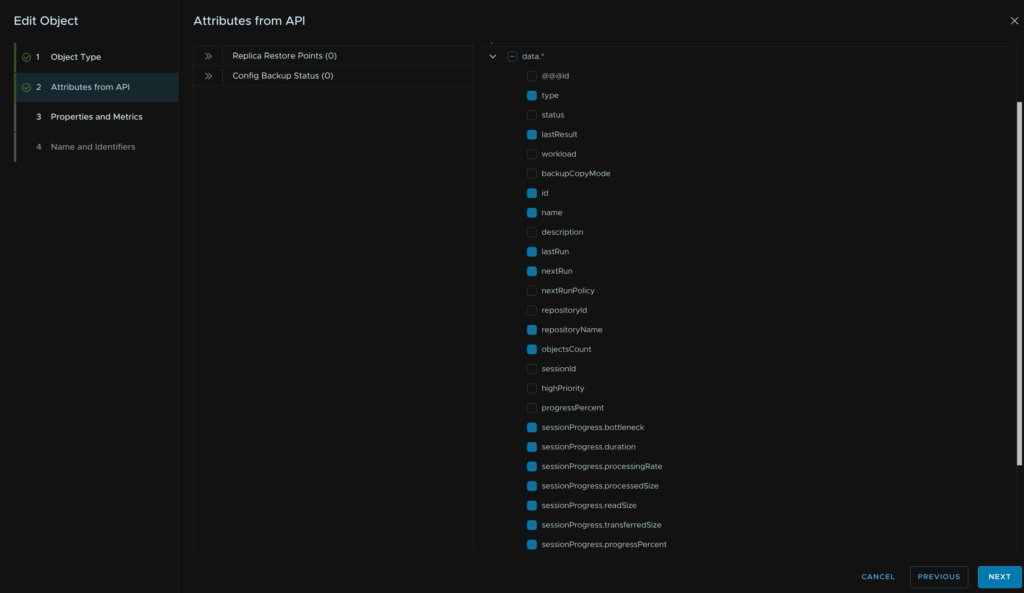
Then expand the Get Job States request, if you chose a different name, yours will be different

And select the below, then click Next
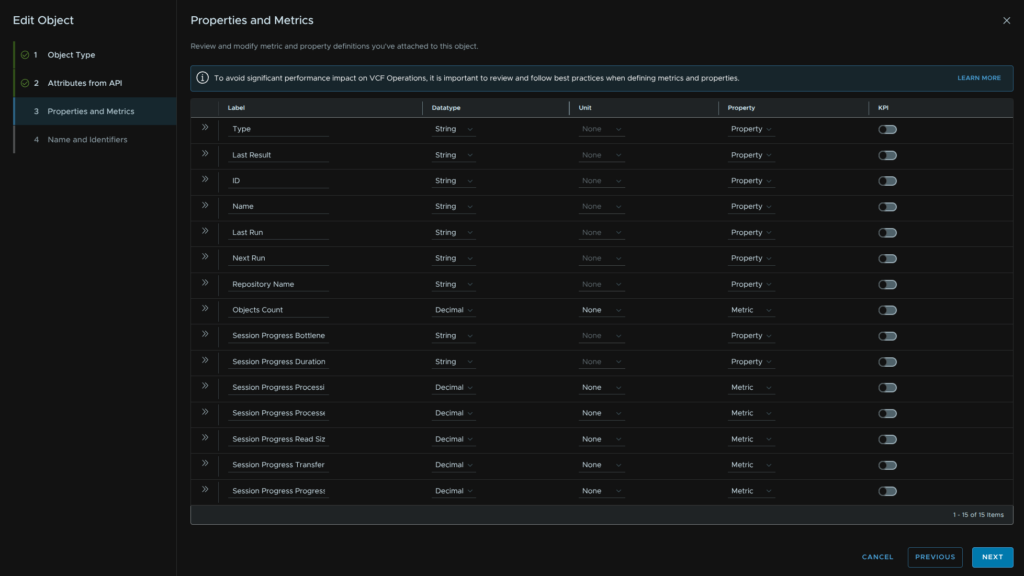
Make sure each label has the correct datatype, this will control if its a property or metric in most cases, here is what I chose, then click Next
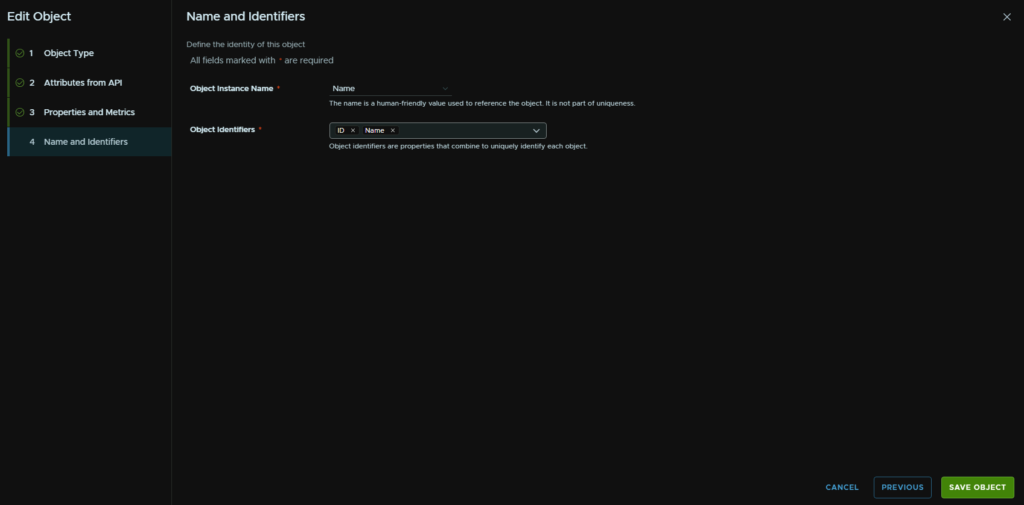
We need some identifiers, for the Object Instance Name, set this to Name, and for the Object Identifiers, use ID and Name then click Save Object
1.1.4 – Repository States
Make sure the HTTP Method is GET, the API path is
api/v1/backupInfrastructure/repositories/states
Add a name for the request
We need the variable Authorization into the header with this value adding
Bearer ${authentication.session.access_token}
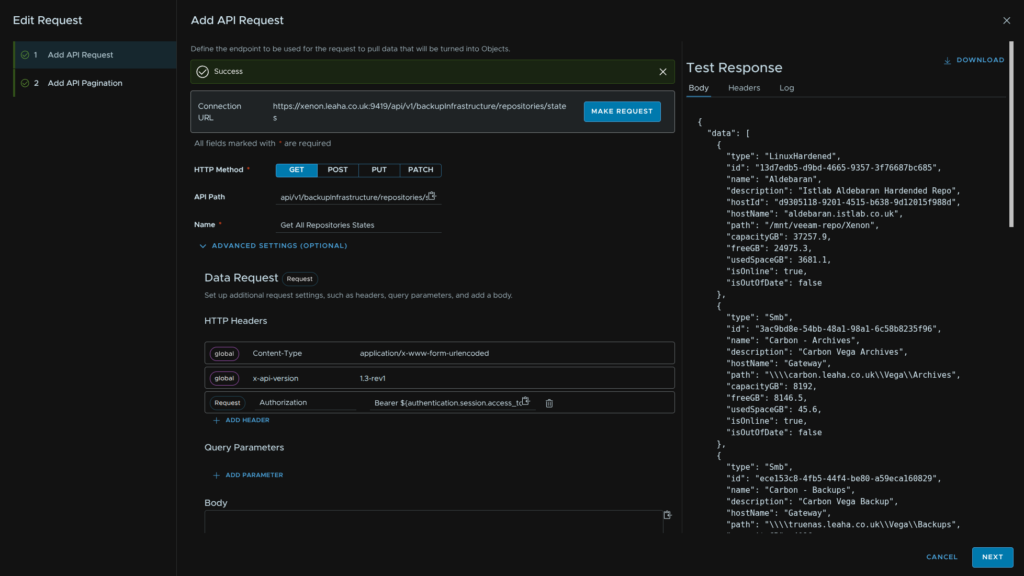
Then click Make Request
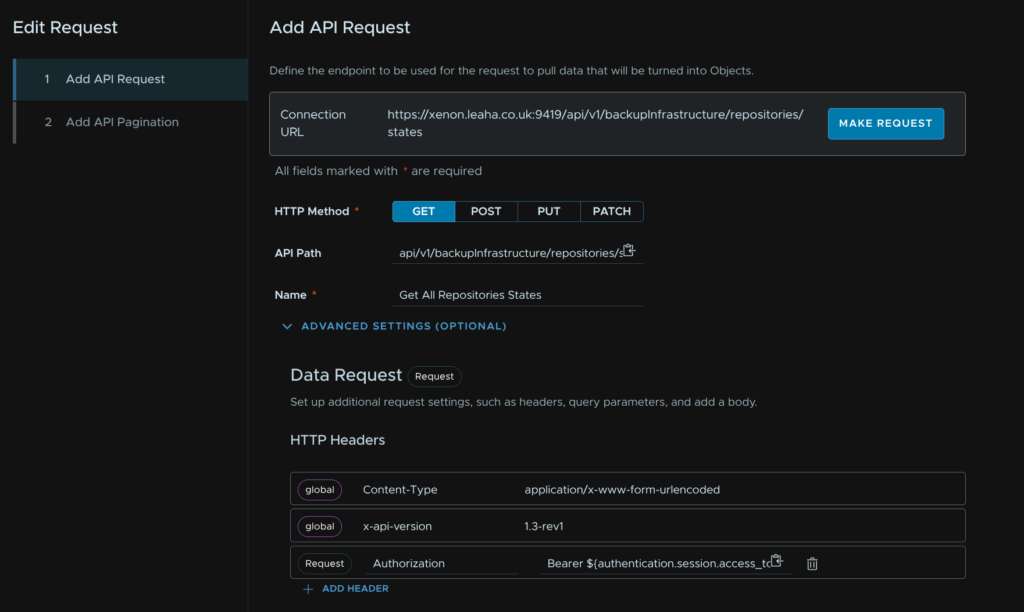
When thats run ok and returns data, click Next
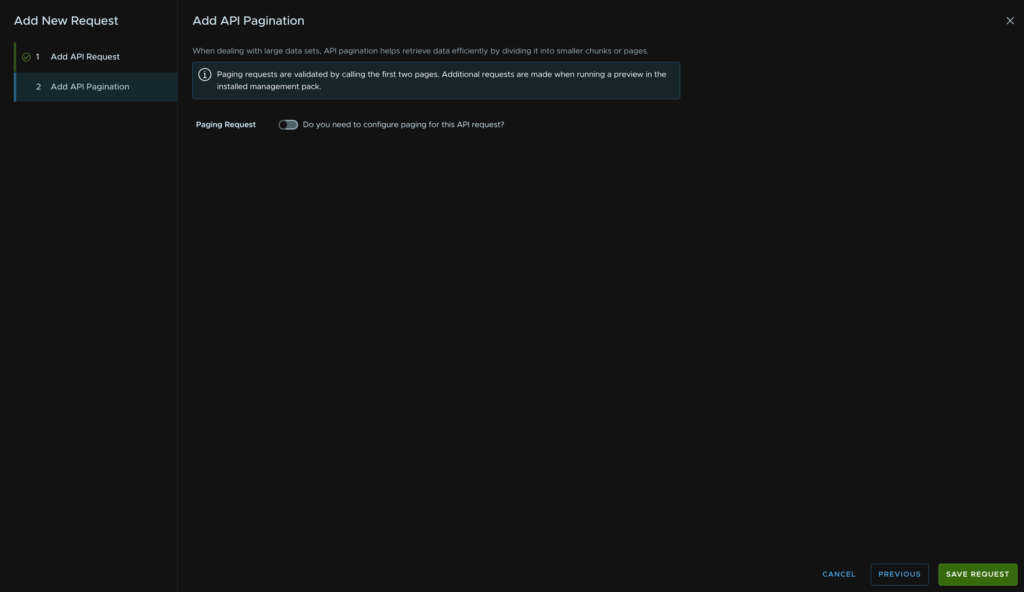
Disable pagination and click Save Request here
Click Objects in the timeline bar at the top and click Add New
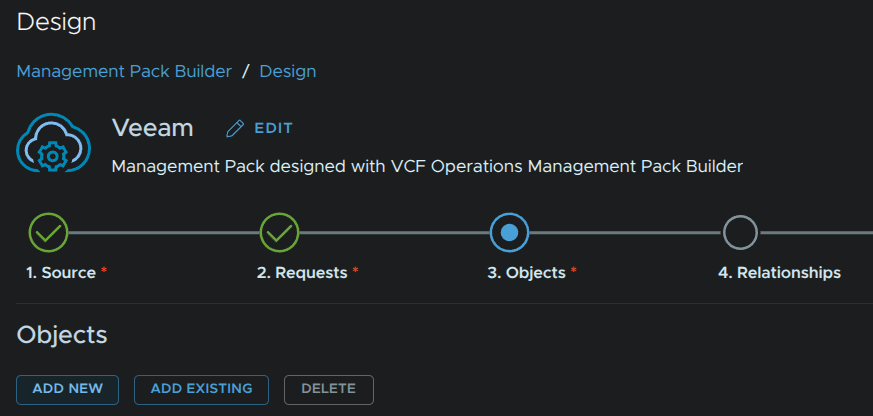
Give it a name and optionally change the default Icon and click Next in the bottom right
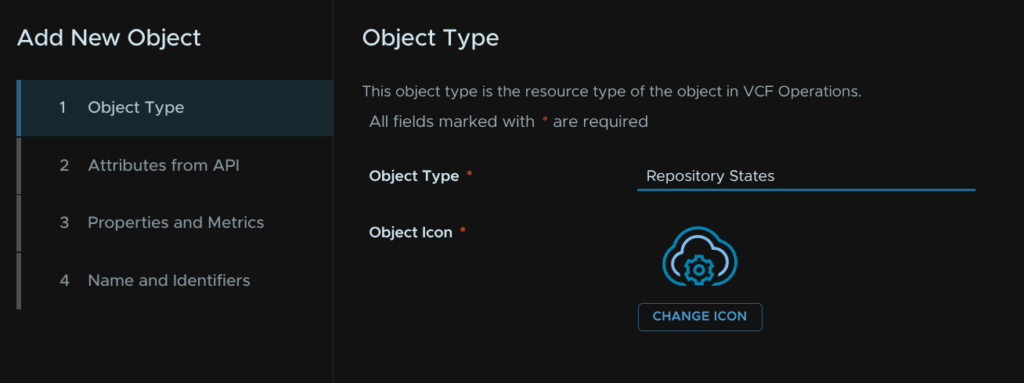
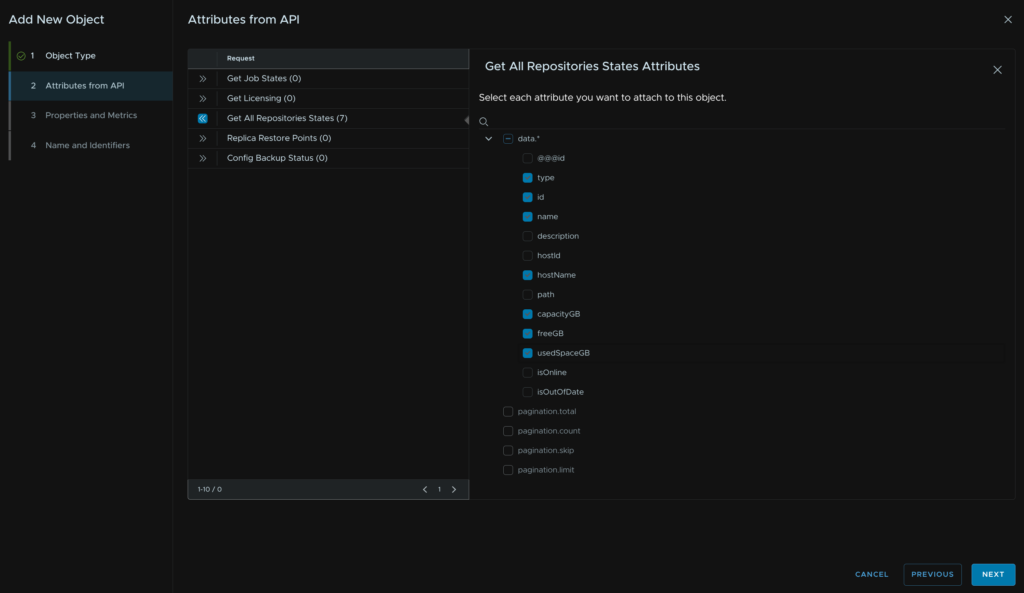
Then expand the Get All Repository States request, if you chose a different name, yours will be different
And select the below, then click Next
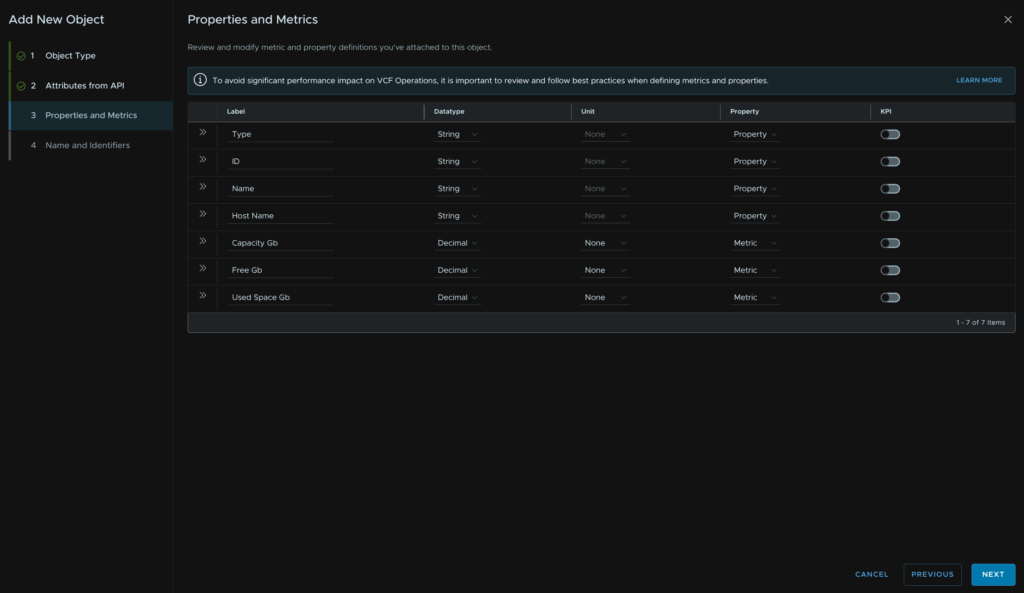
Make sure each label has the correct datatype, this will control if its a property or metric in most cases, here is what I chose, then click Next
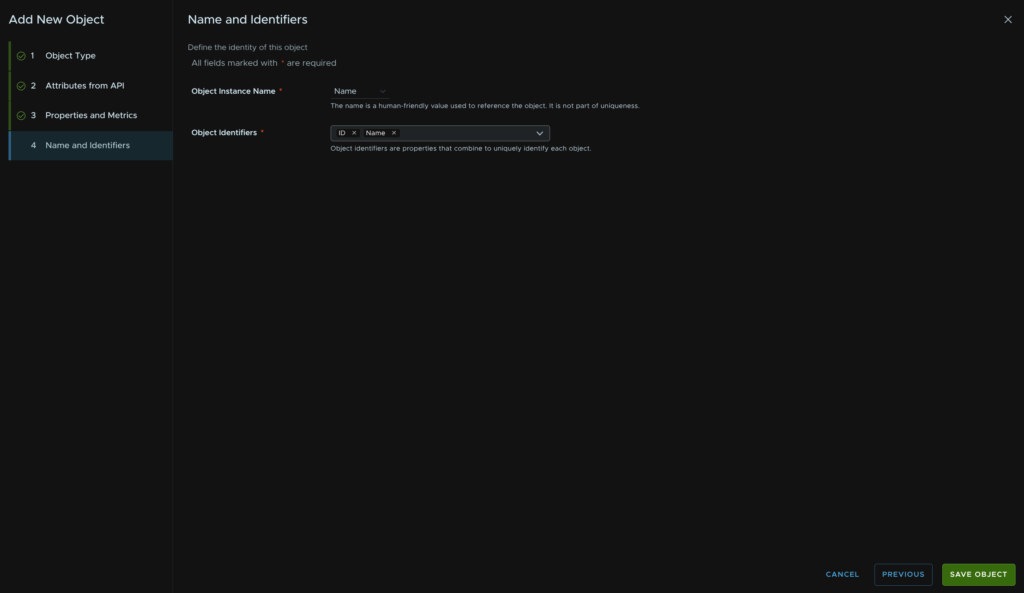
We need some identifiers, for the Object Instance Name, set this to Name, and for the Object Identifiers, use ID and Name then click Save Object
1.1.5 – Backup Server Info
Make sure the HTTP Method is GET, the API path is
api/v1/serverInfo
Add a name for the request
We need the variable Authorization into the header with this value adding
Bearer ${authentication.session.access_token}
Then click Make Request
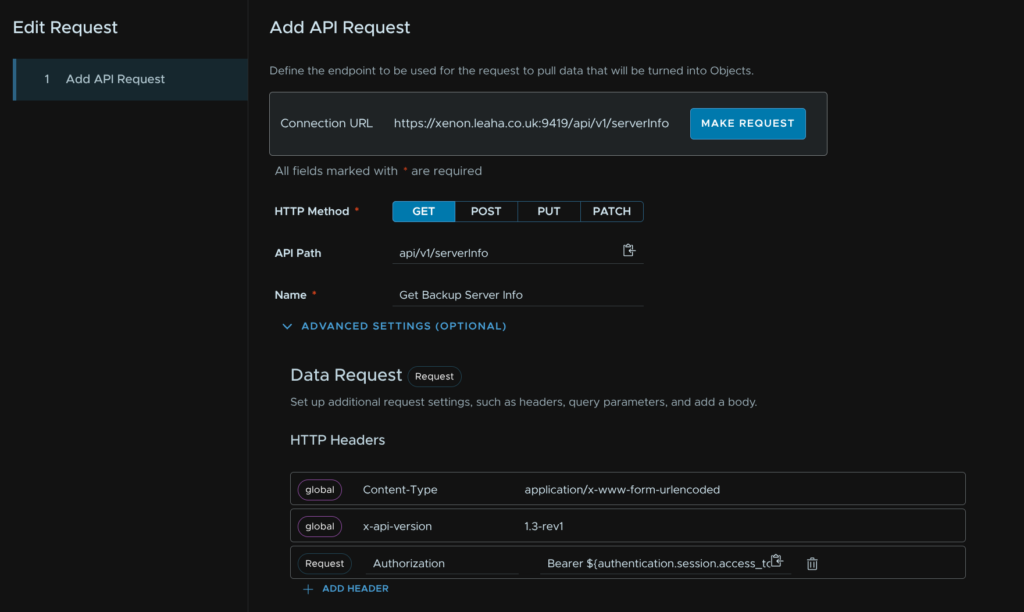
When thats returned data, click Save Request
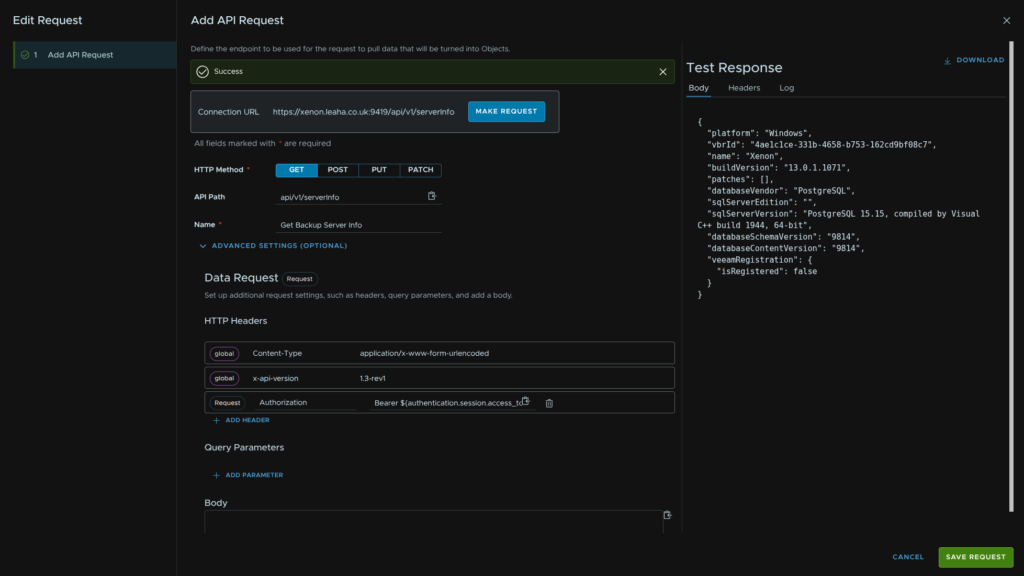
Click Objects in the timeline bar at the top and click Add New
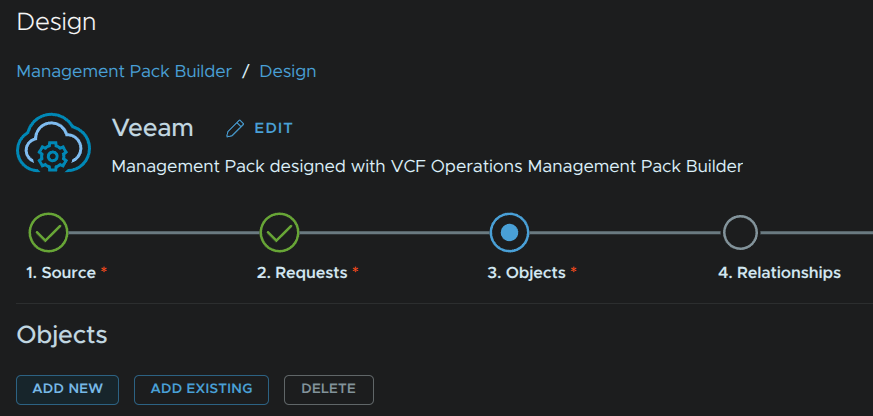
Give it a name and optionally change the default Icon and click Next in the bottom right
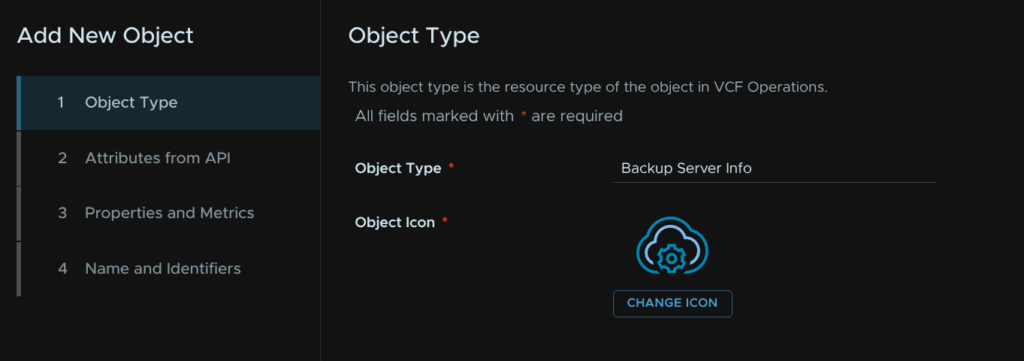
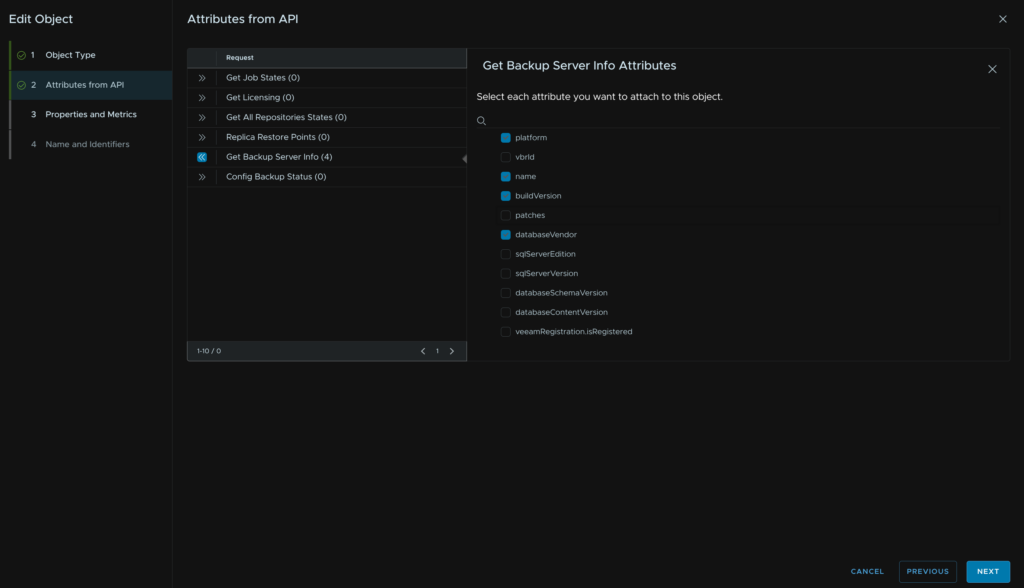
Then expand the Get Backup Server Info request, if you chose a different name, yours will be different
And select the below, then click Next
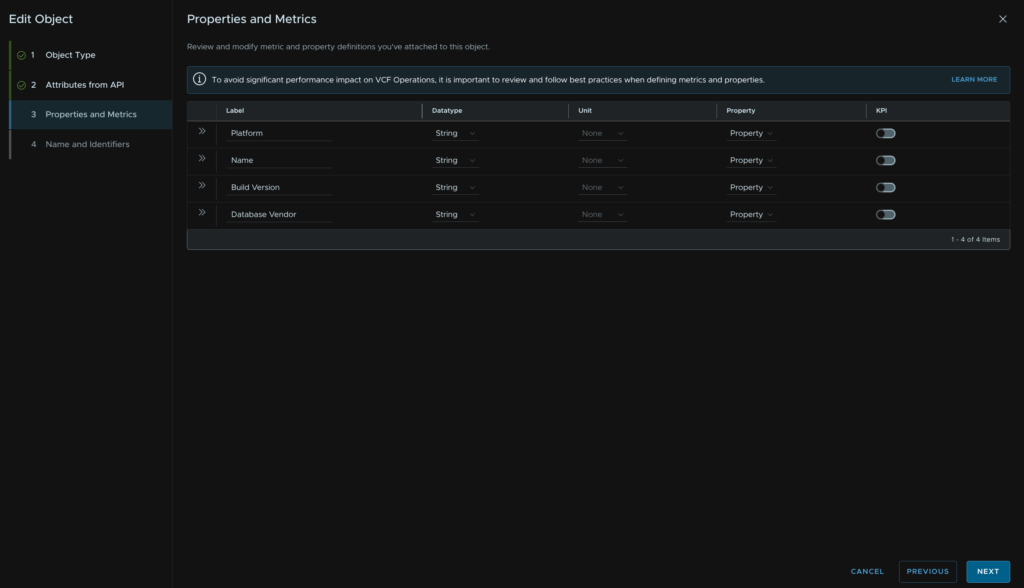
Make sure each label has the correct datatype, this will control if its a property or metric in most cases, here is what I chose, then click Next
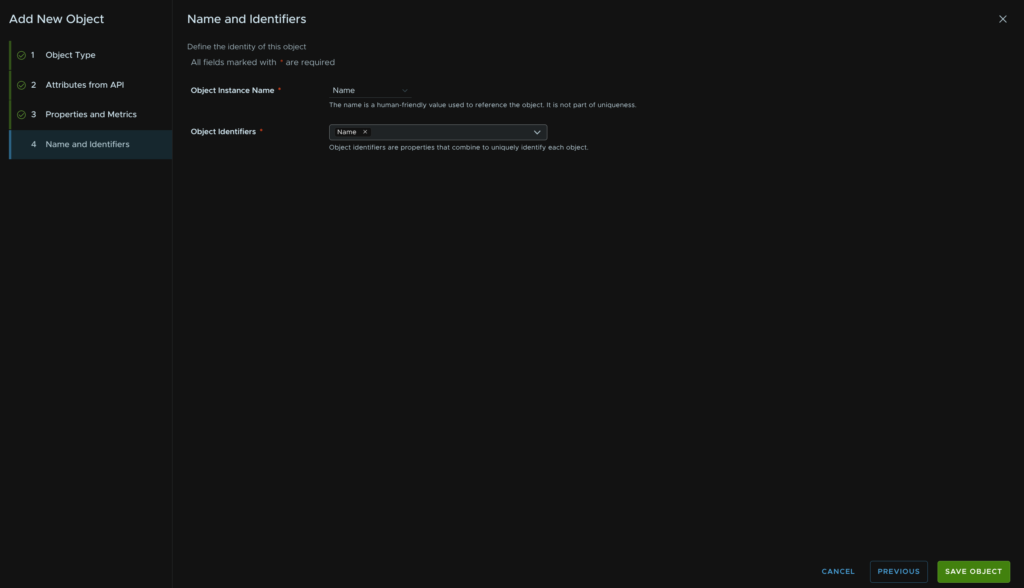
We need some identifiers, for the Object Instance Name, set this to Name, and for the Object Identifiers, use Name then click Save Object
1.1.6 – Config Backup Status
Make sure the HTTP Method is GET, the API path is
api/v1/configBackup
Add a name for the request
We need the variable Authorization into the header with this value adding
Bearer ${authentication.session.access_token}
Then click Make Request
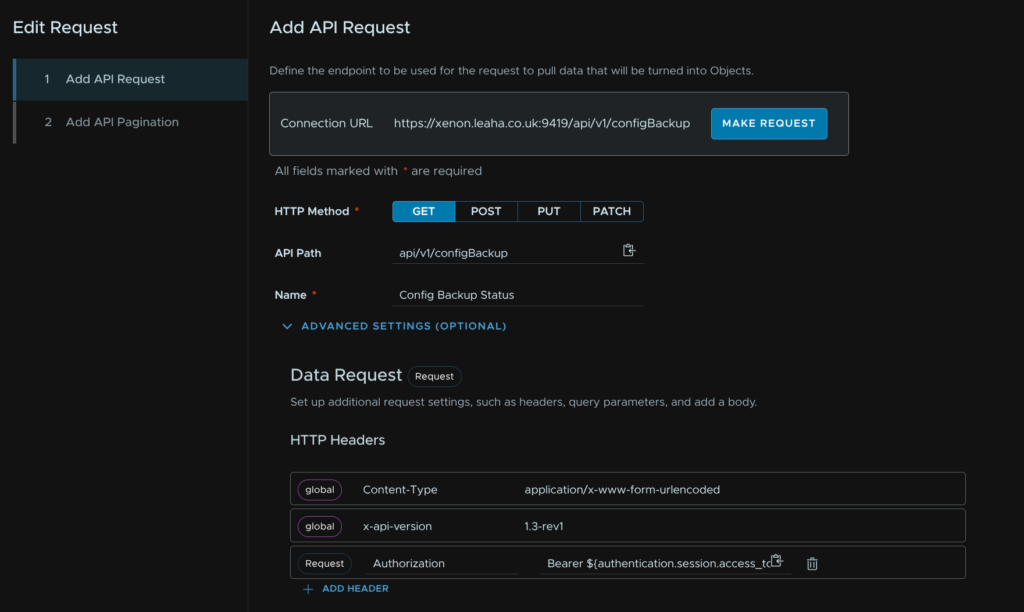
When thats run ok and returns data, click Next
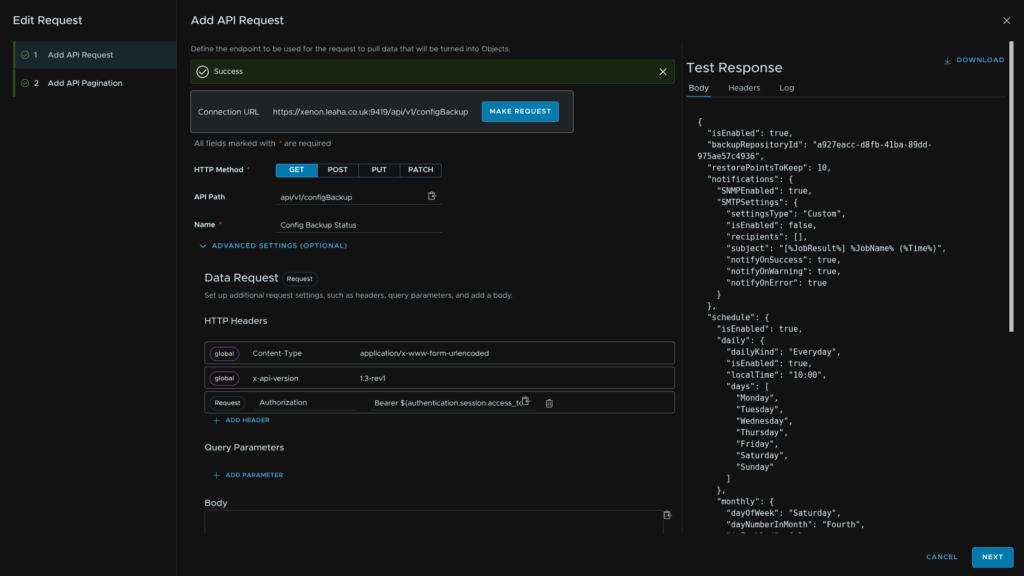
Disable pagination and click Save Request here
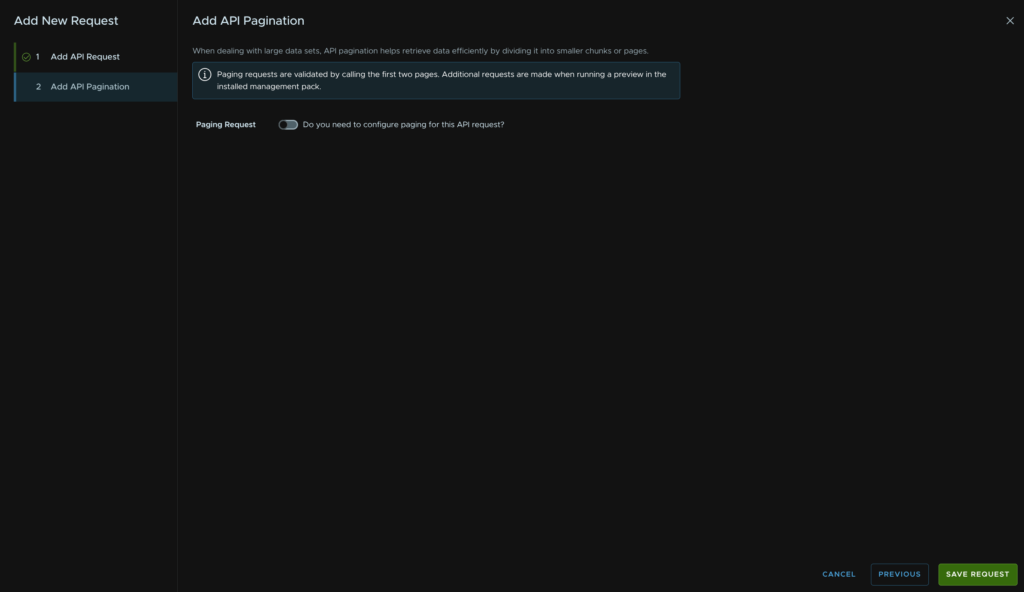
Click Objects in the timeline bar at the top and click Add New
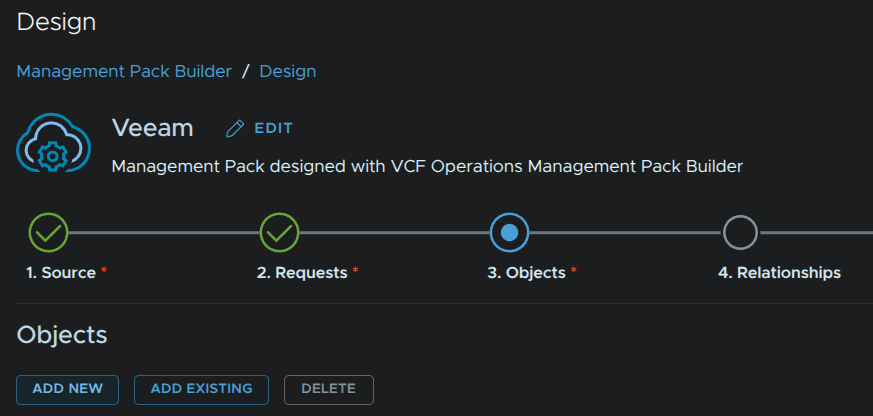
Give it a name and optionally change the default Icon and click Next in the bottom right
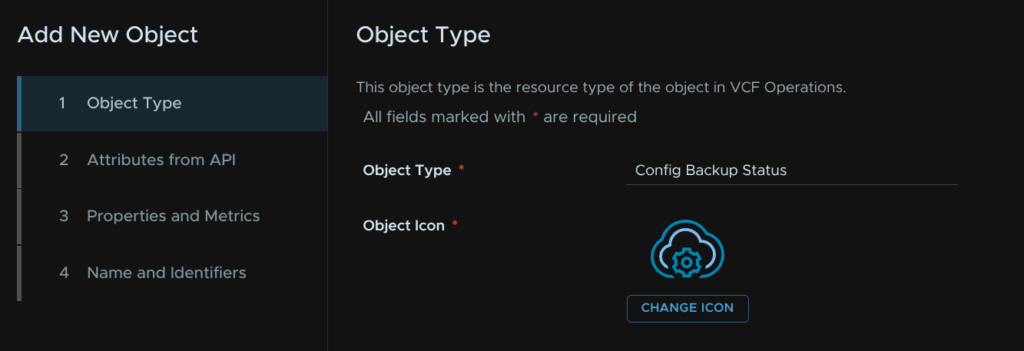
Then expand the Config Backup Status request, if you chose a different name, yours will be different
And select the below, then click Next
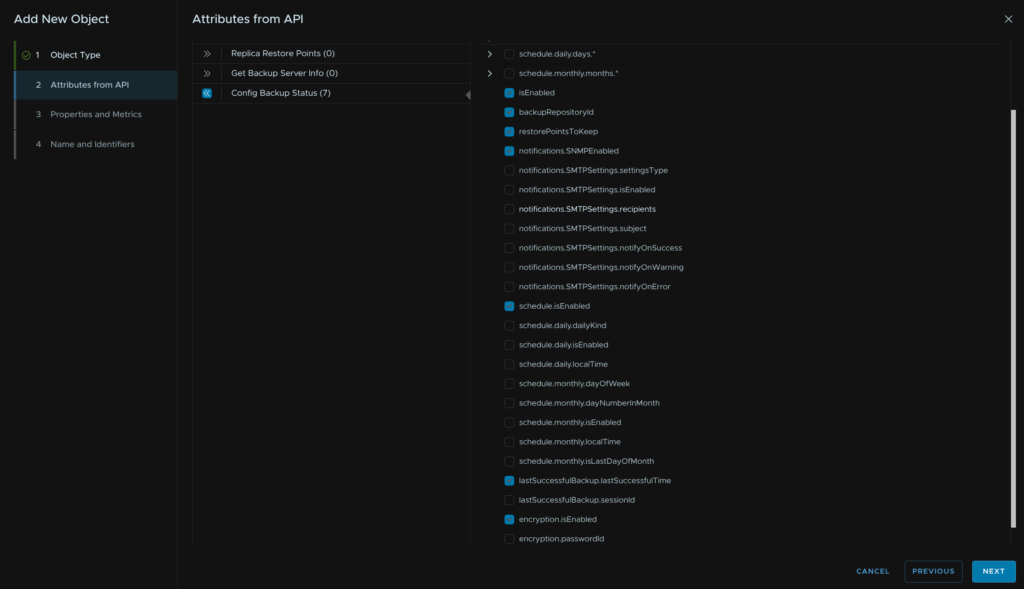
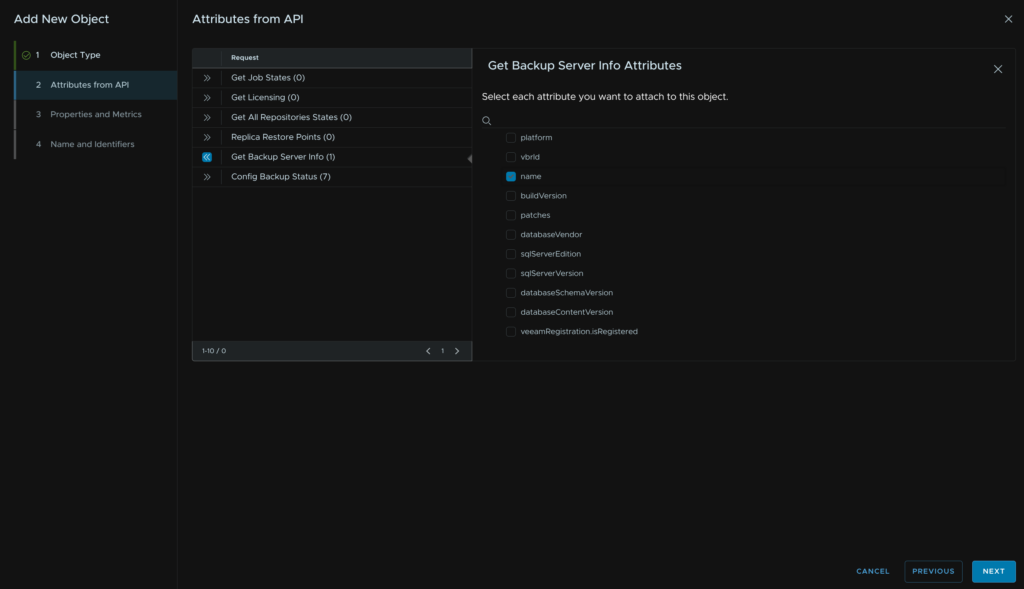
We also want to expand Get Backup Server Info and select name, this will give us a name identifier for later
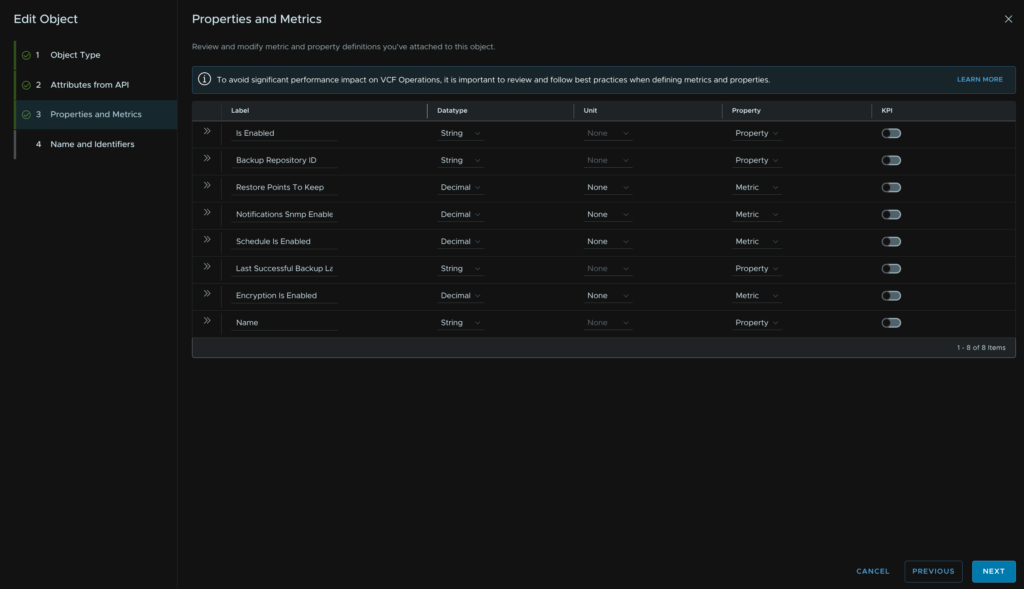
Make sure each label has the correct datatype, this will control if its a property or metric in most cases, here is what I chose, then click Next
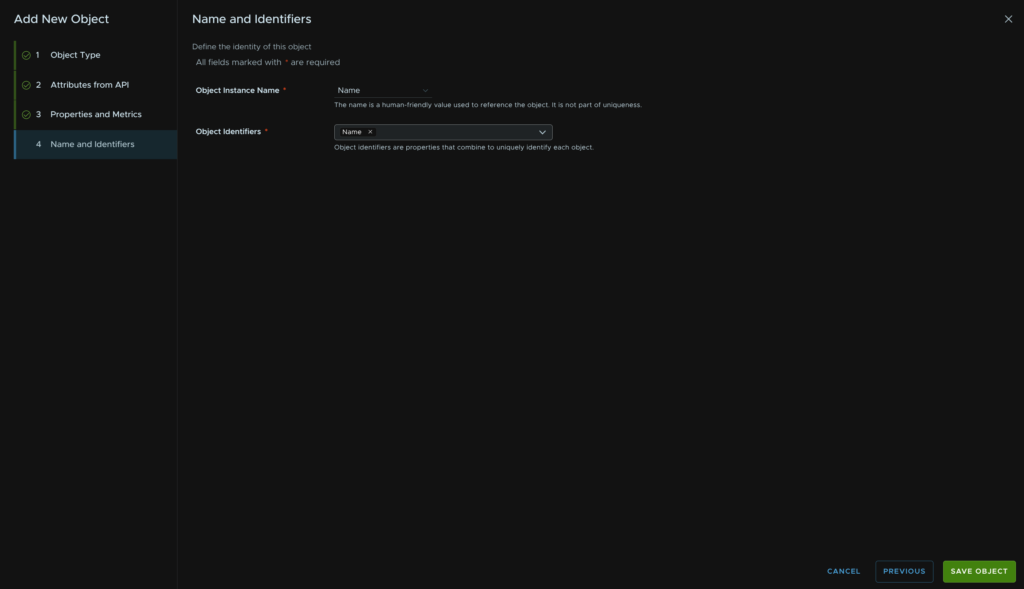
We need some identifiers, for the Object Instance Name, set this to Name, and for the Object Identifiers, use Name then click Save Object
1.1.7 – Get All Restore Points
Make sure the HTTP Method is GET, the API path is
api/v1/backupObjects
Add a name for the request
We need the variable Authorization into the header with this value adding
Bearer ${authentication.session.access_token}
We also need a Query parameter to limit these for our platform, our options are
“VMware” “HyperV” “CloudDirector” “WindowsPhysical” “LinuxPhysical” “Tape” “CustomPlatform” “EntraID” “UnstructuredData” “Test” “MongoDb” “AWSEC2” “AzureCompute” “GCE”
I am doing this for VMware, so I added the parameter name platformNameFilter with the value VMware
Then click Make Request
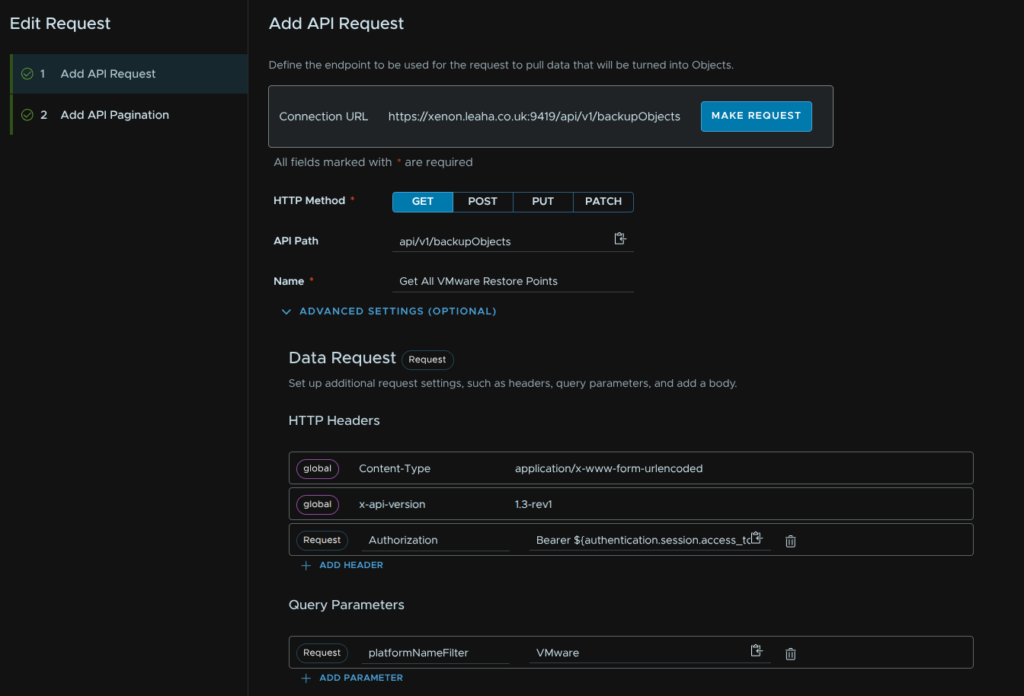
When thats successful click Next
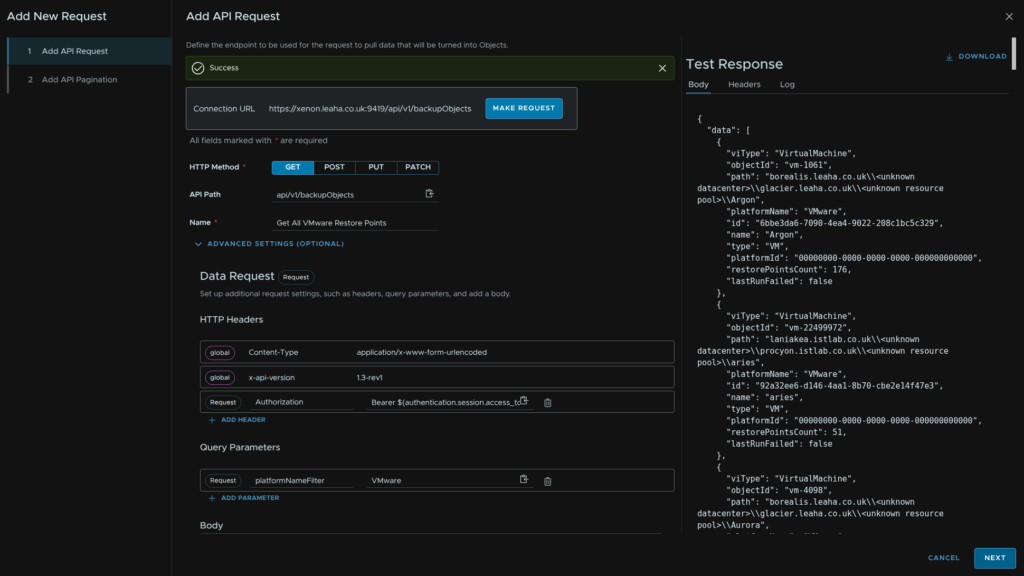
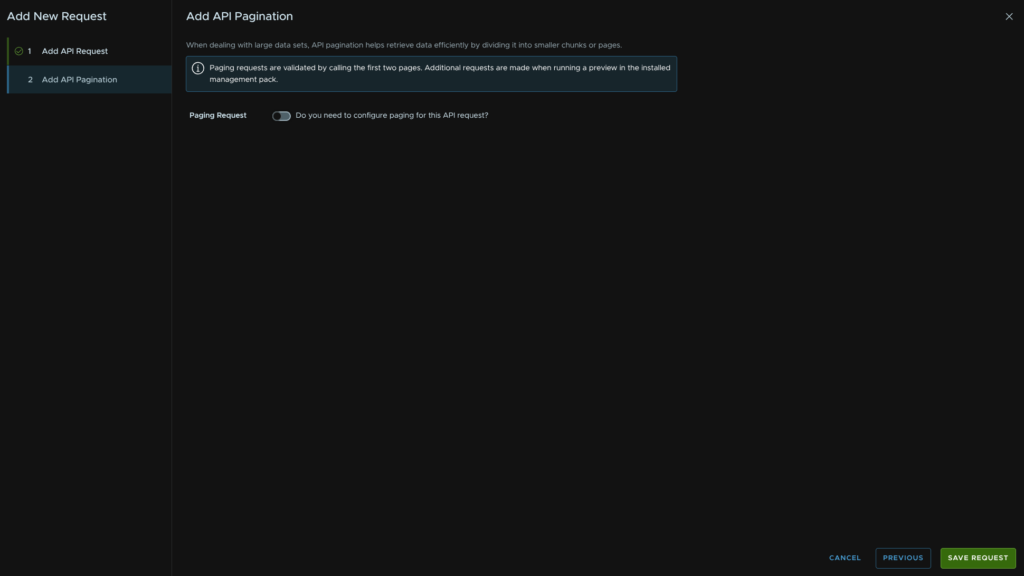
Disable pagination and click Save Request here
Click Objects in the timeline bar at the top and click Add New
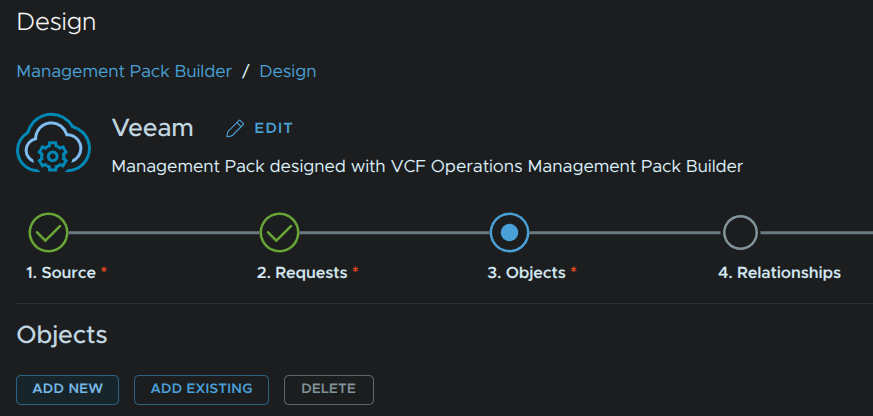
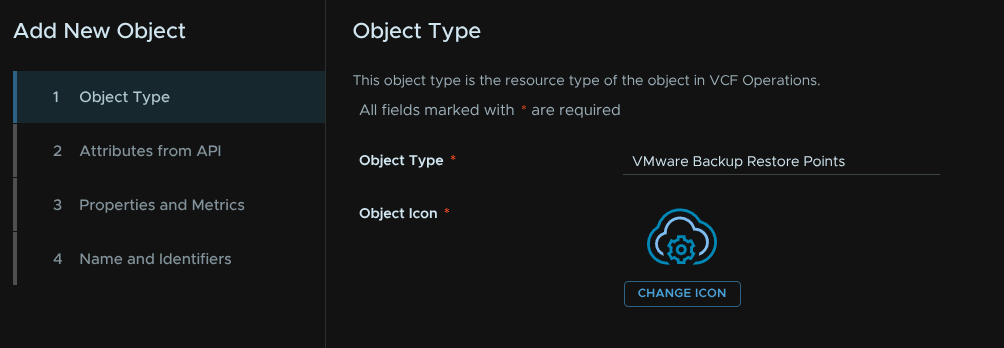
Give it a name and optionally change the default Icon
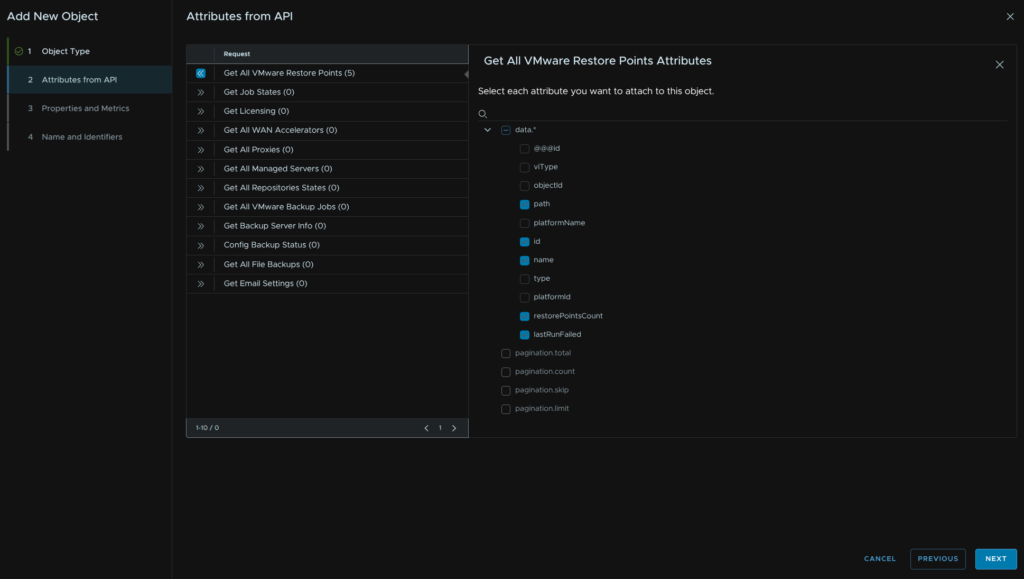
Then expand the Get All VMware Restore Points request, if you chose a different name, yours will be different
And select the below, then click Next
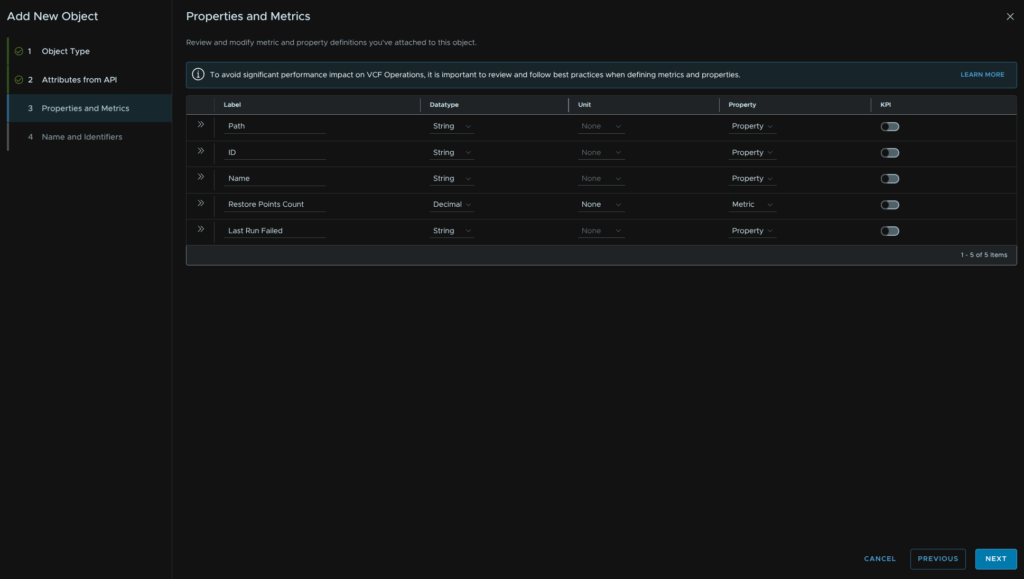
Make sure each label has the correct datatype, this will control if its a property or metric in most cases, here is what I chose, then click Next
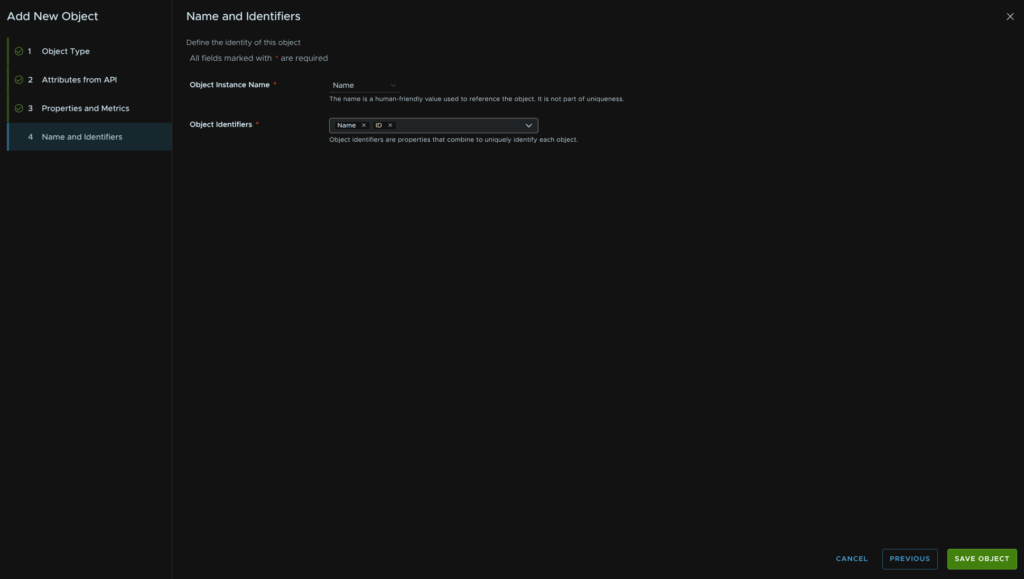
We need some identifiers, for the Object Instance Name, set this to Name, and for the Object Identifiers, use ID and Name then click Save Object
I repeated again, but using the filter UnstructuredData, for my NAS backups for a new request
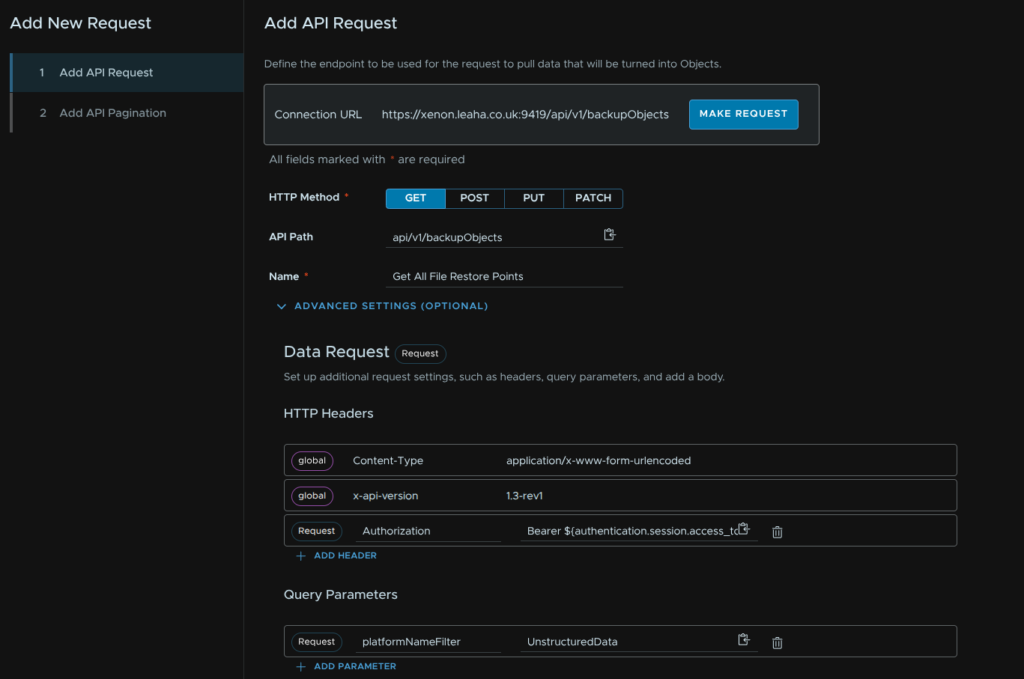
We then need another object, give it a name and click Next in the bottom right
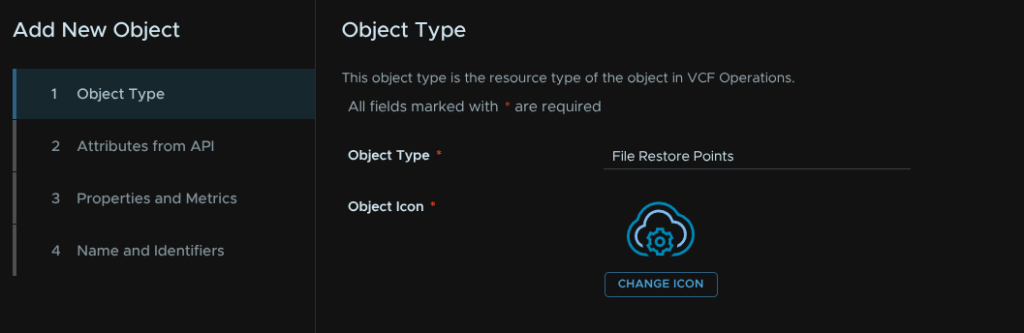
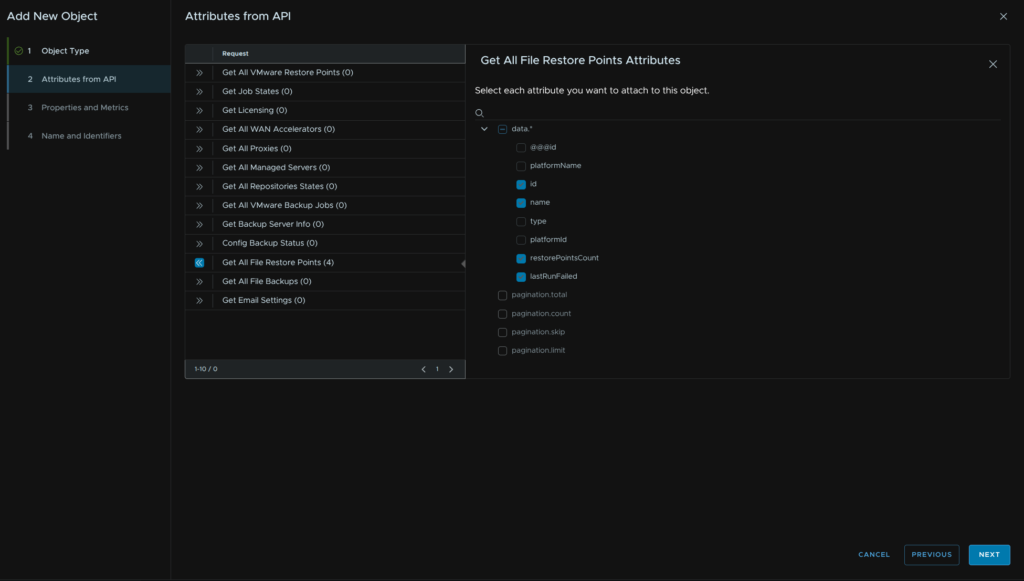
Then expand the Get All File Restore Points request, if you chose a different name, yours will be different
And select the below, then click Next
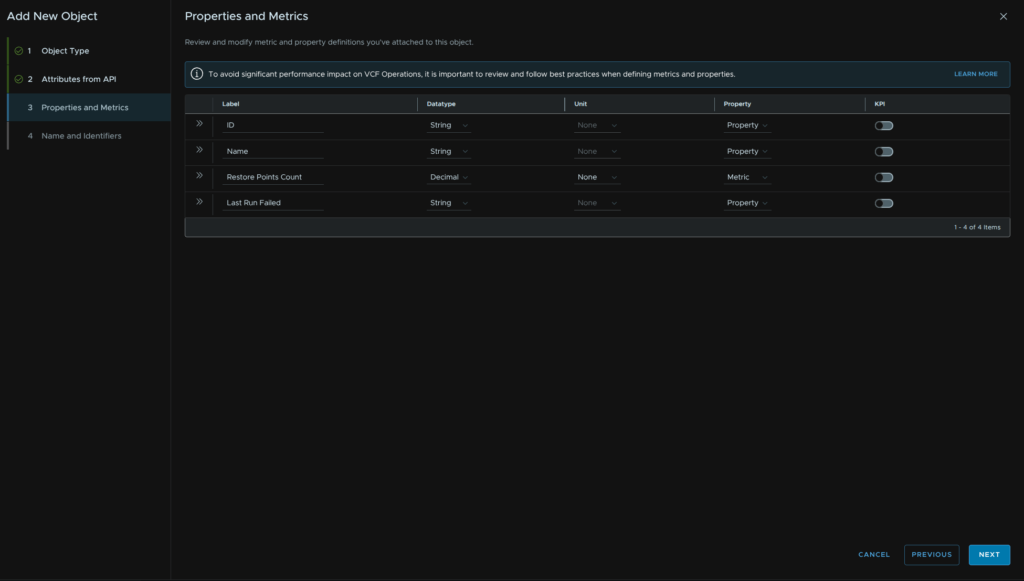
Make sure each label has the correct datatype, this will control if its a property or metric in most cases, here is what I chose, then click Next
We need some identifiers, for the Object Instance Name, set this to Name, and for the Object Identifiers, use ID and Name then click Save Object
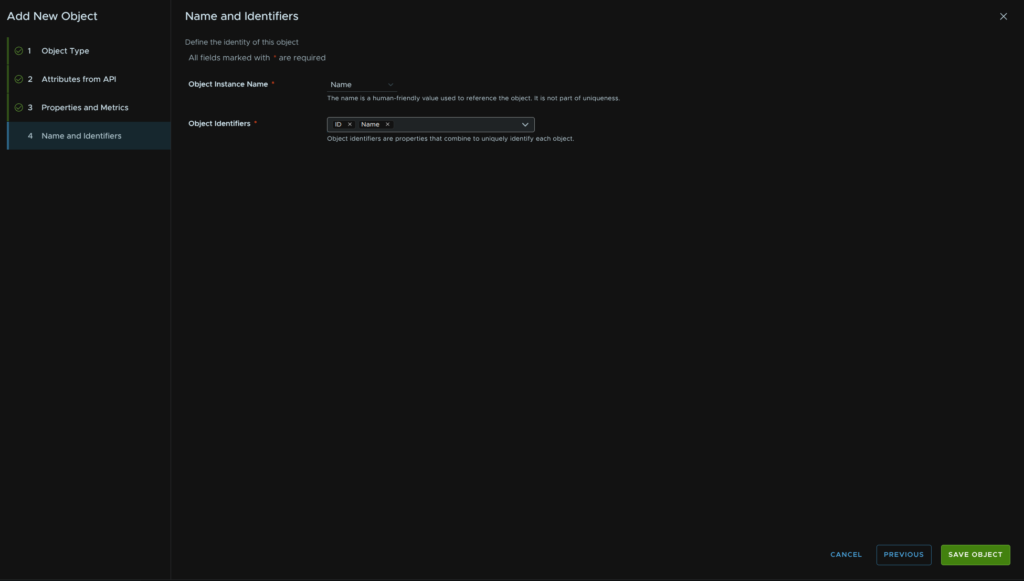
You can repeat for other types like physical hosts
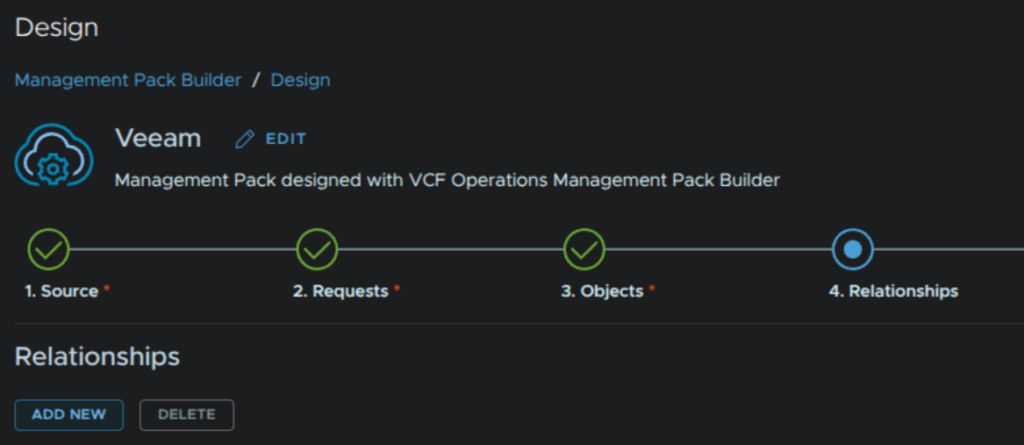
What you can also do, as this for vSphere VMs, as they exist within the VCF Operations Inventory is define a new Relationship to match the Veeam VM entries to VMs, click Relationships/Add New
On the right hand side enable the toggle to use All Objects, then add vCenter Virtual Machine, and for the property look for Configuration|Name and click that, at the bottom give the relationship a name
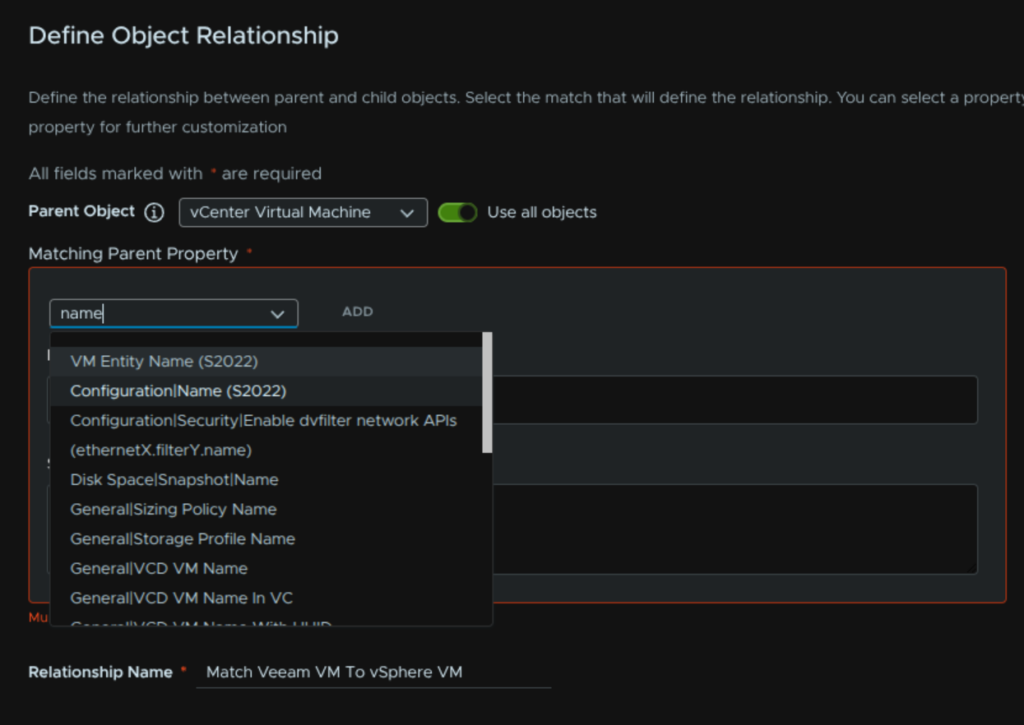
Then click Add
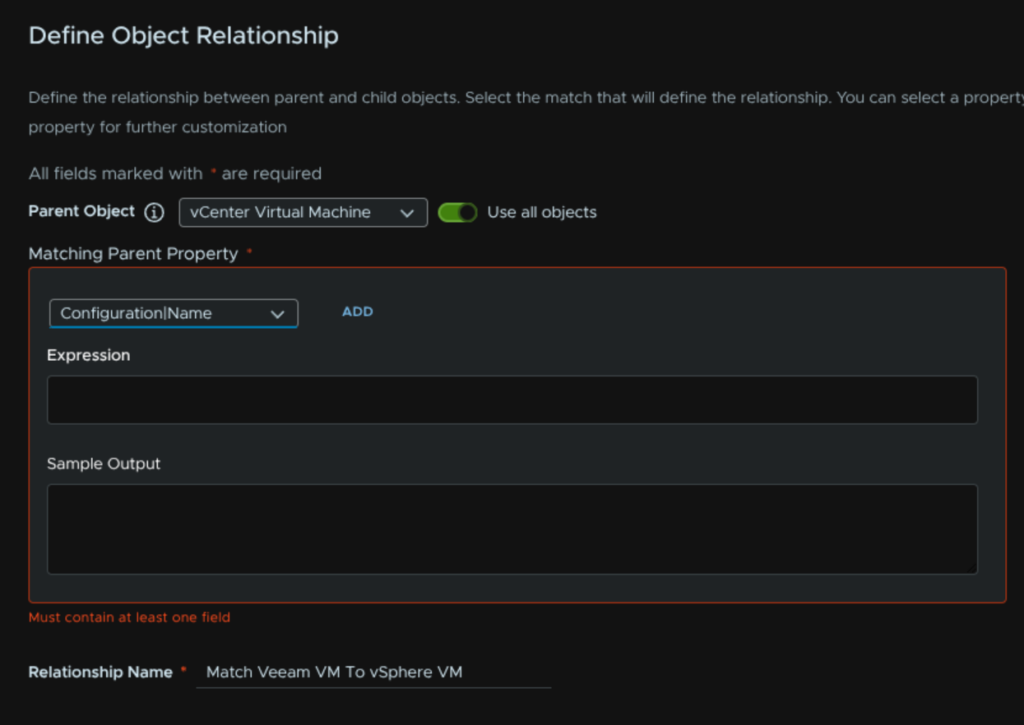
For the Child Object, look for the VMware Backup Restore Points object and for the property click Name
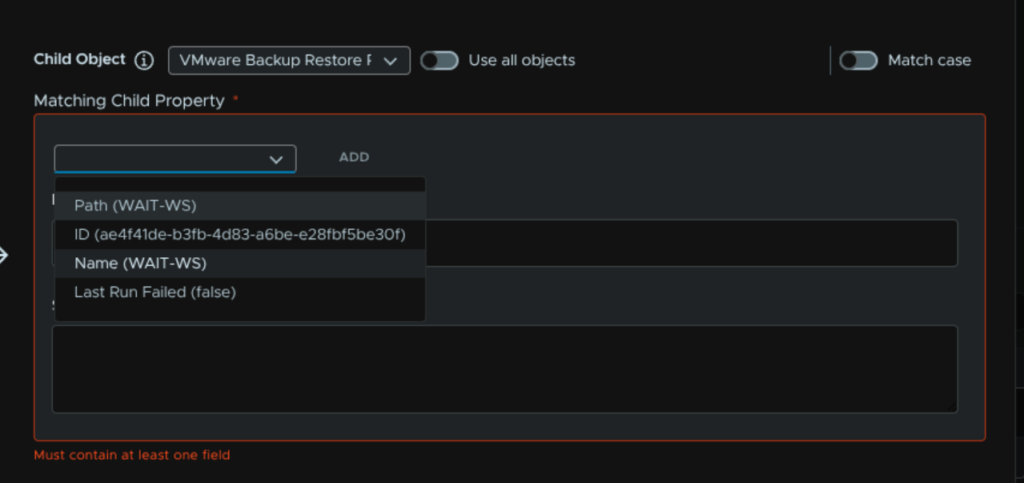
Then click Add
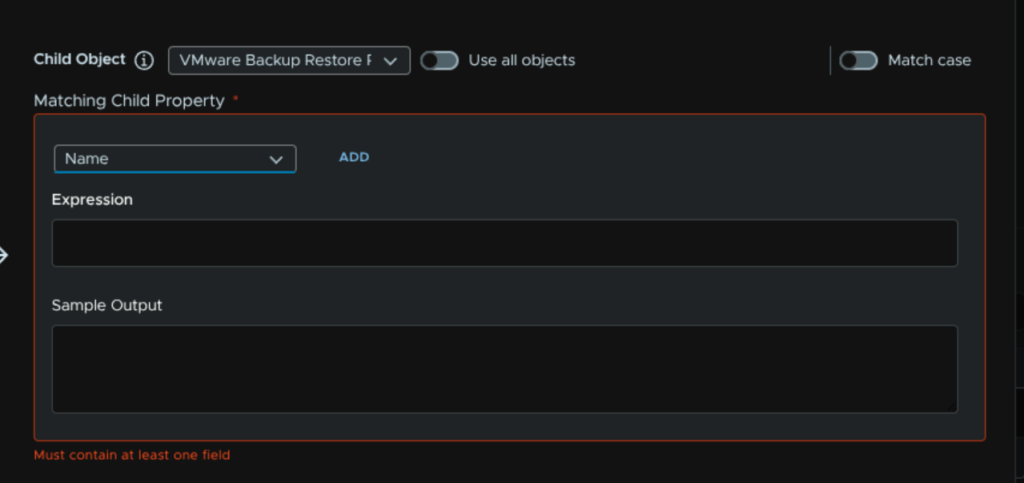
Now click Save Relationship
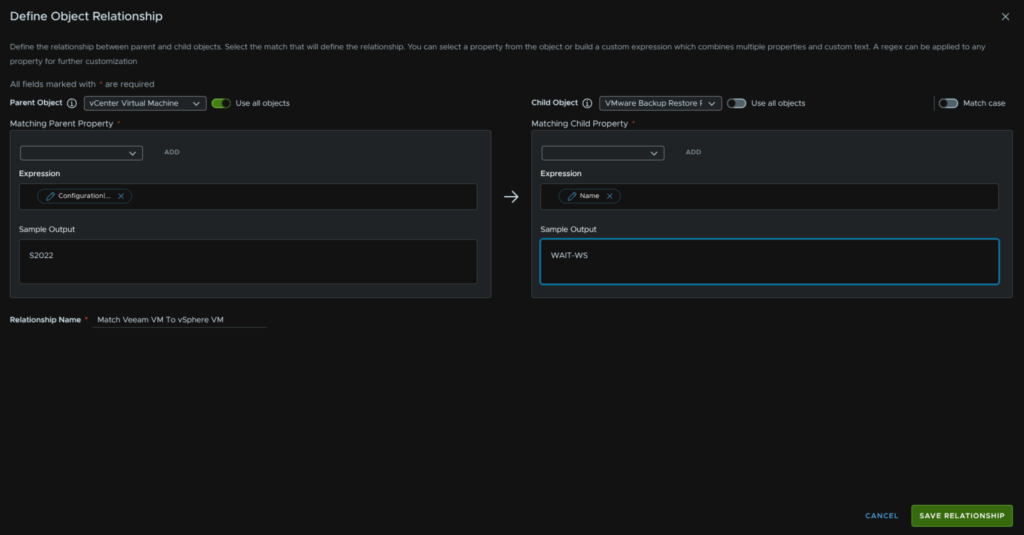
While the above was tested and working properly in VCF Operations 9.0.x, I did notice it had broken after upgrading to Ops 9.1, when checking back in on the management pack, now located in Build/Developer Center/Management Pack Builder, the Objects section has a vCenter Virtual Machine option, not sure if I missed it before
If you click into that
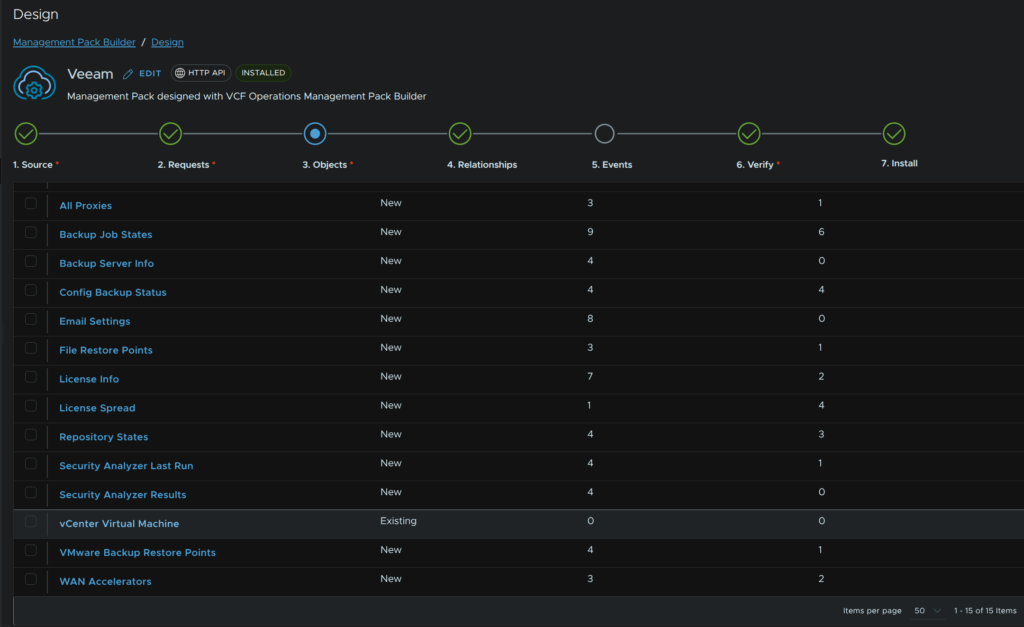
Then click Next
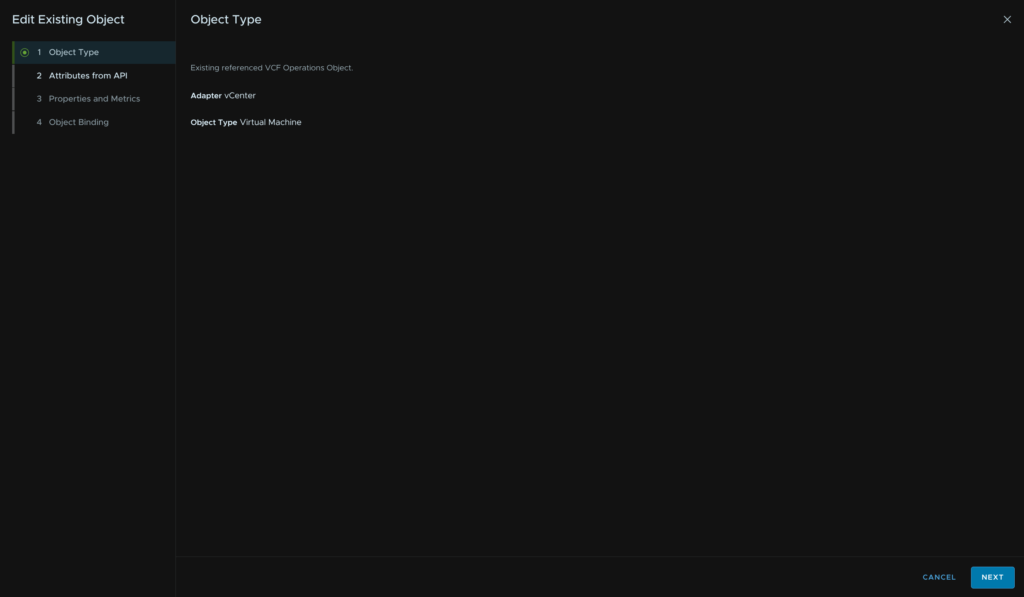
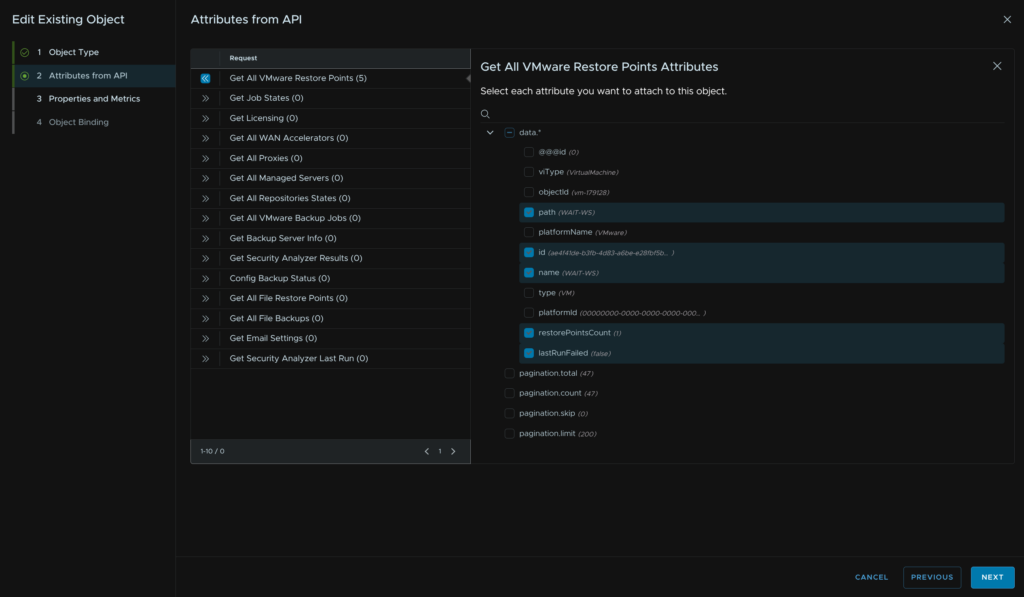
From the Get All VMware Restore Points API request the below, and click Next
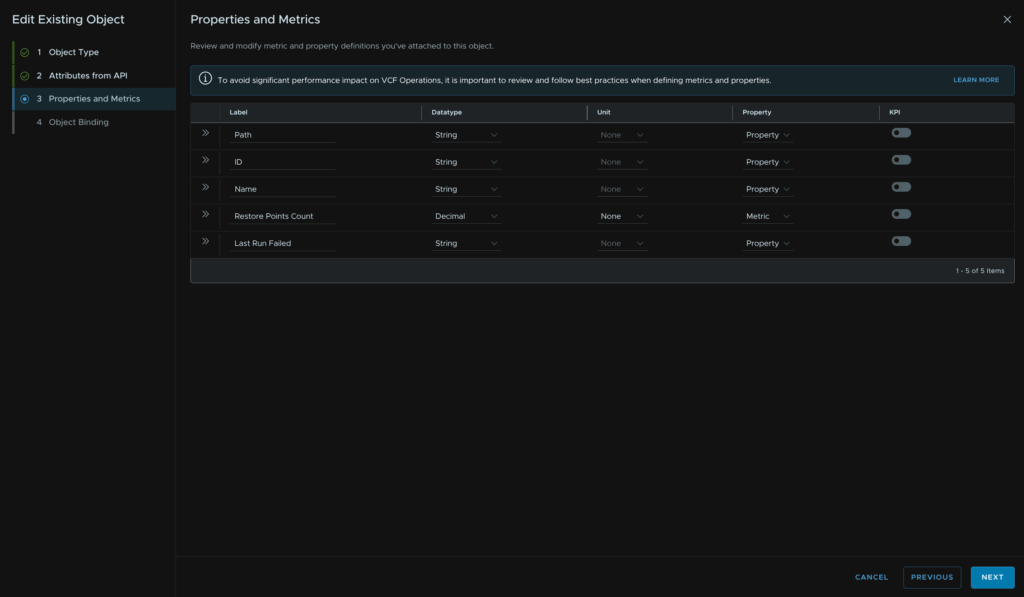
Leave this at the default and click Next
Then set the Object Binding to be the name from the API request on the left and the Configuration|Name for the vCenter VM on the right, and click Save Object
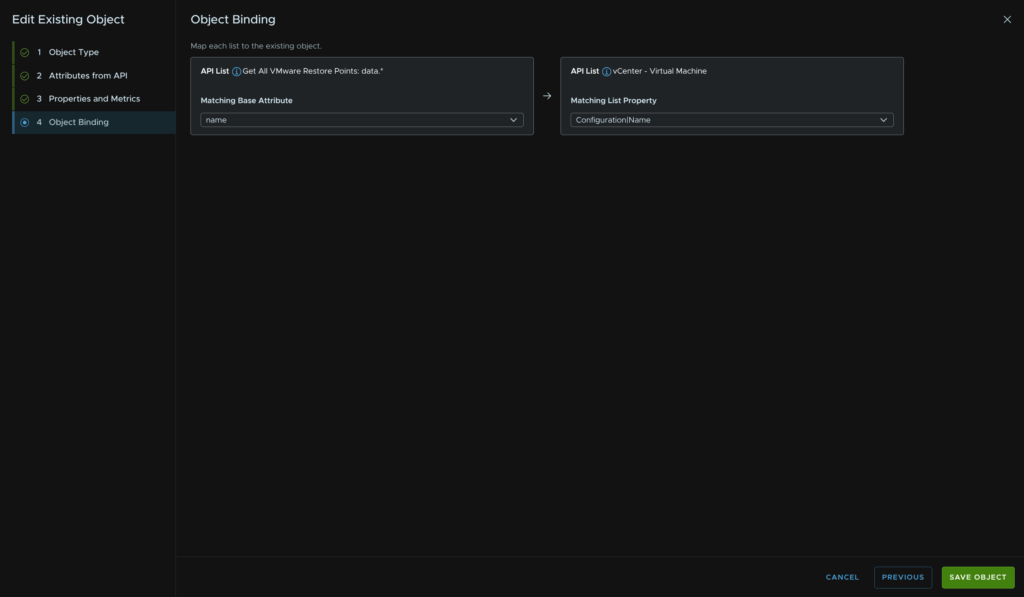
This will fix the issue and the relation works as intended, it is work noting, if you verify the management pack and go to the Install section, you now have the option to upgrade the management pack in Ops 9.1
1.1.8 – Get All Managed Servers
Make sure the HTTP Method is GET, the API path is
api/v1/backupInfrastructure/managedServers
Add a name for the request
We need the variable Authorization into the header with this value adding
Bearer ${authentication.session.access_token}
Then click Make Request
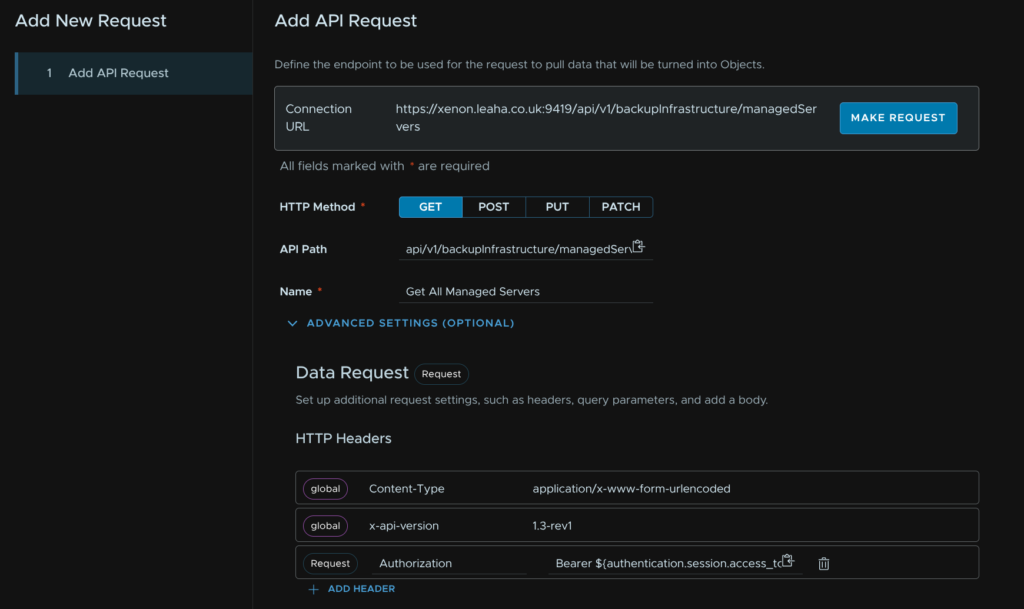
When thats run ok and returns data, click Next
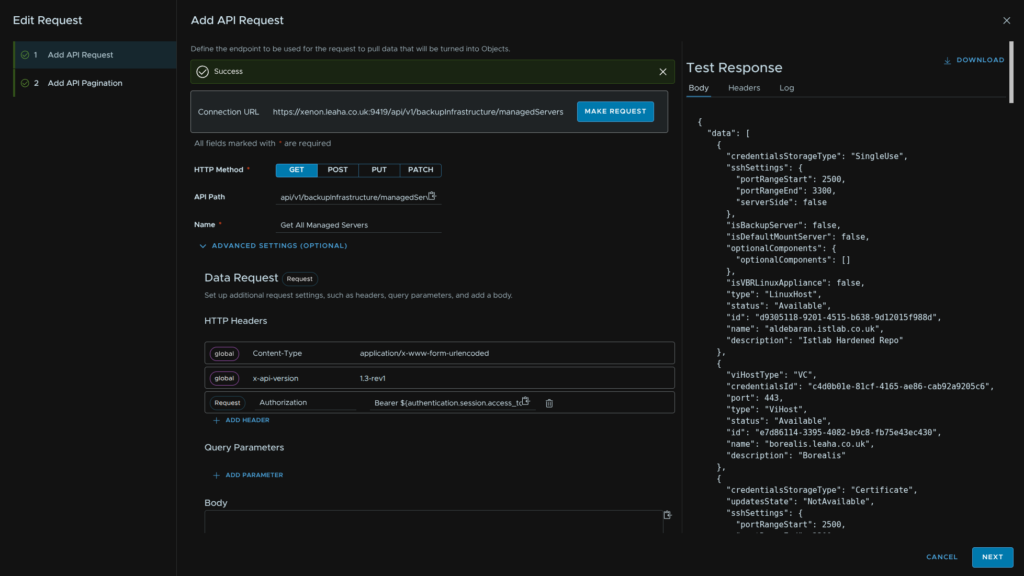
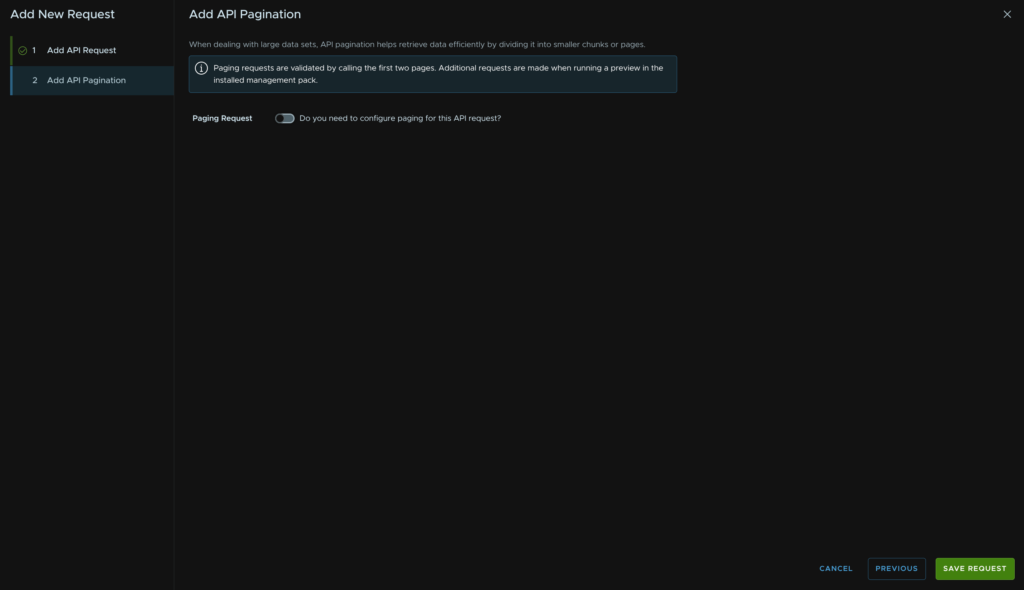
Disable pagination and click Save Request here
Click Objects in the timeline bar at the top and click Add New
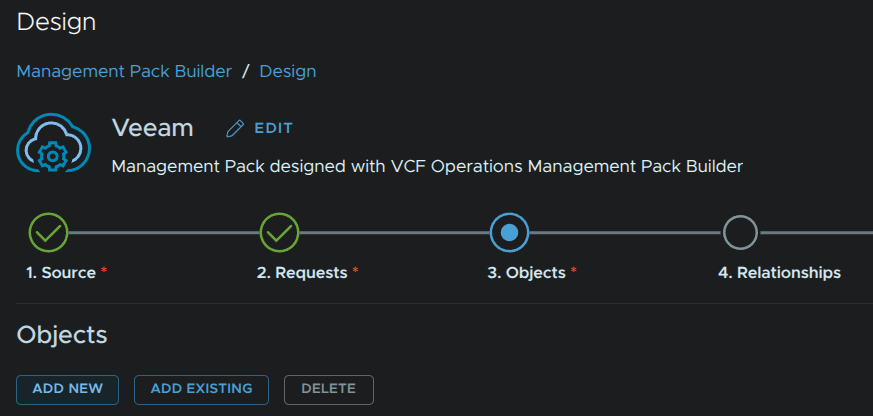
Give it a name and optionally change the default Icon and click Next in the bottom right
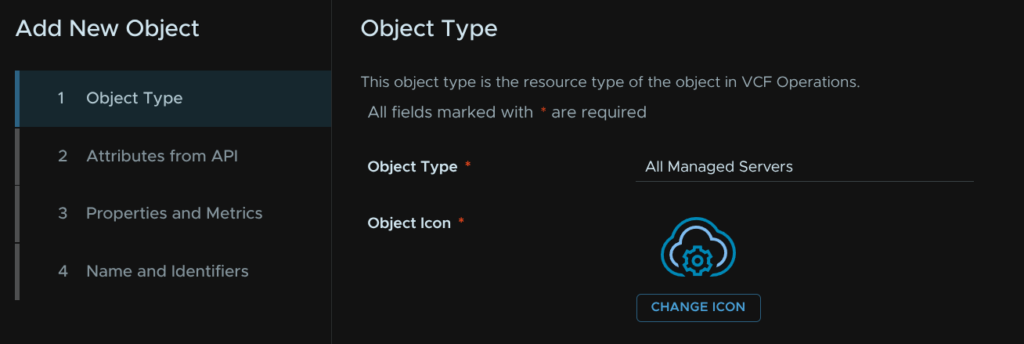
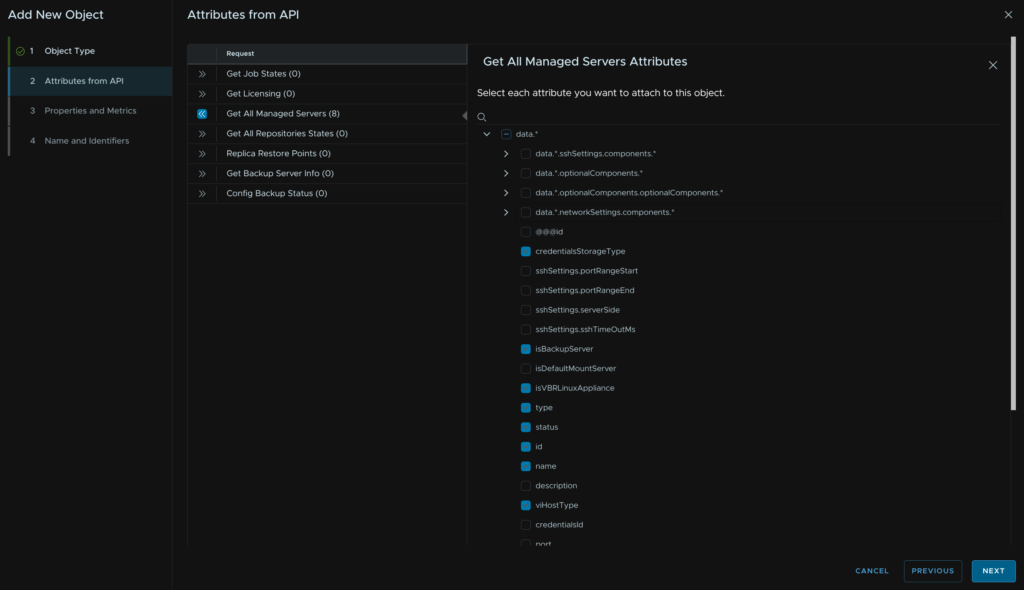
Then expand the Get All Managed Servers request, if you chose a different name, yours will be different
And select the below, then click Next
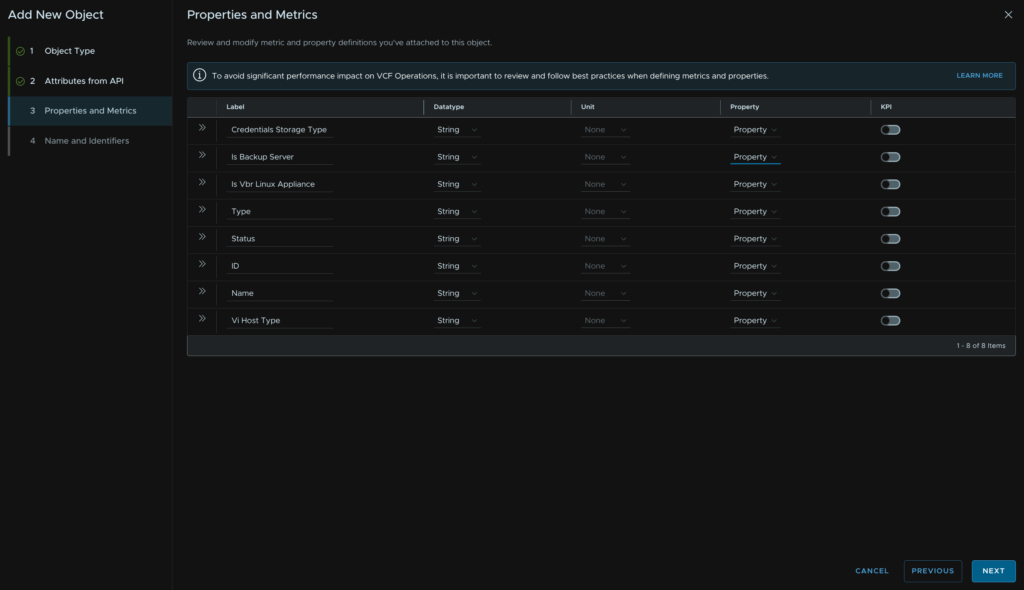
Make sure each label has the correct datatype, this will control if its a property or metric in most cases, here is what I chose, then click Next
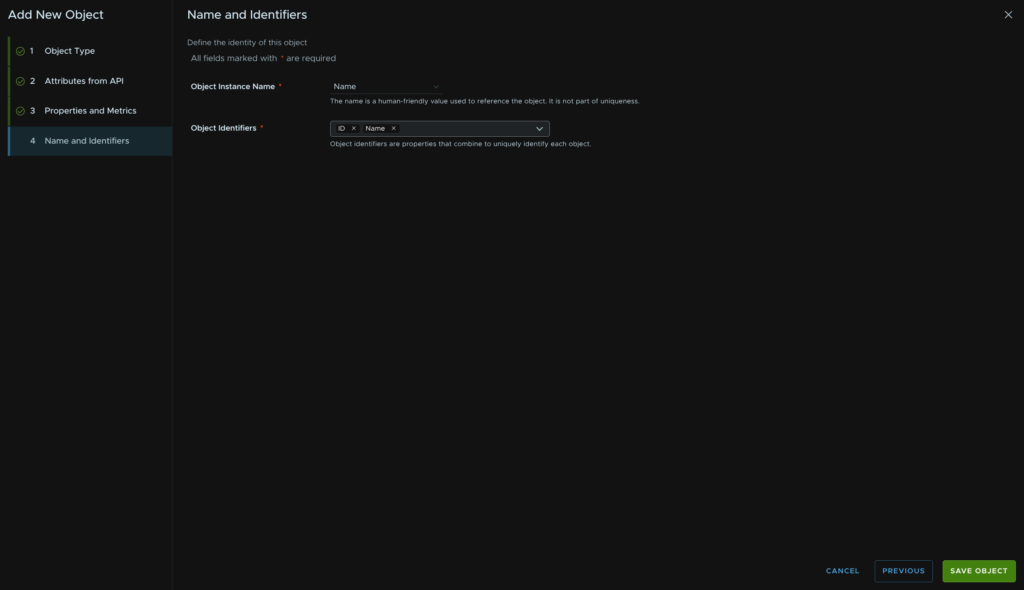
We need some identifiers, for the Object Instance Name, set this to Name, and for the Object Identifiers, use ID and Name then click Save Object
1.1.9 – Get Email Settings
Make sure the HTTP Method is GET, the API path is
api/v1/generalOptions/emailSettings
Add a name for the request
We need the variable Authorization into the header with this value adding
Bearer ${authentication.session.access_token}
Then click Make Request
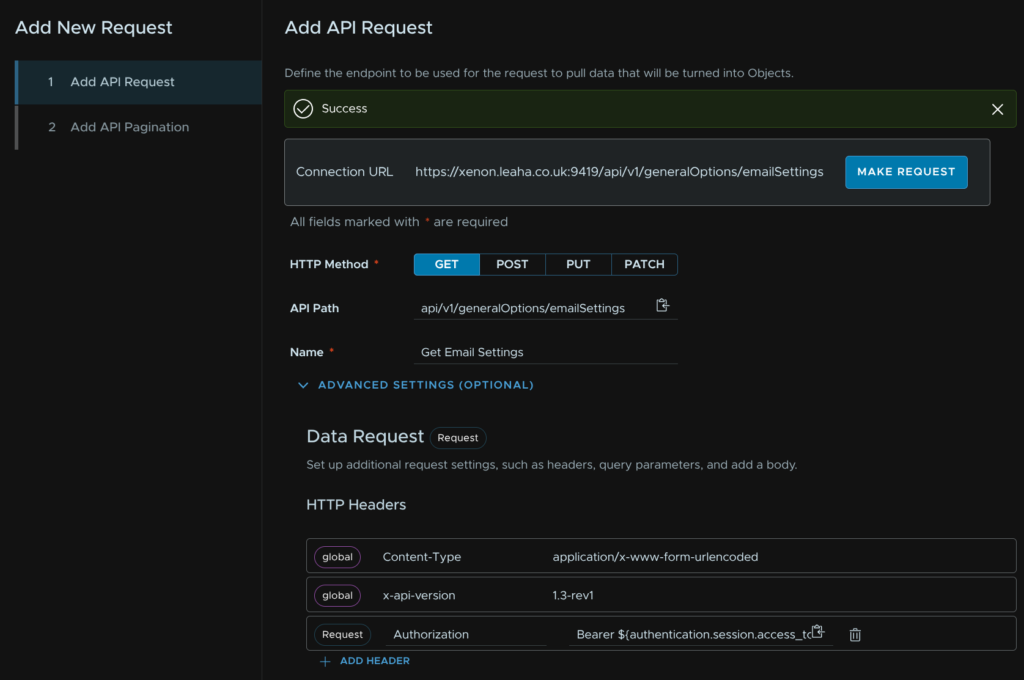
When thats run ok and returns data, click Next
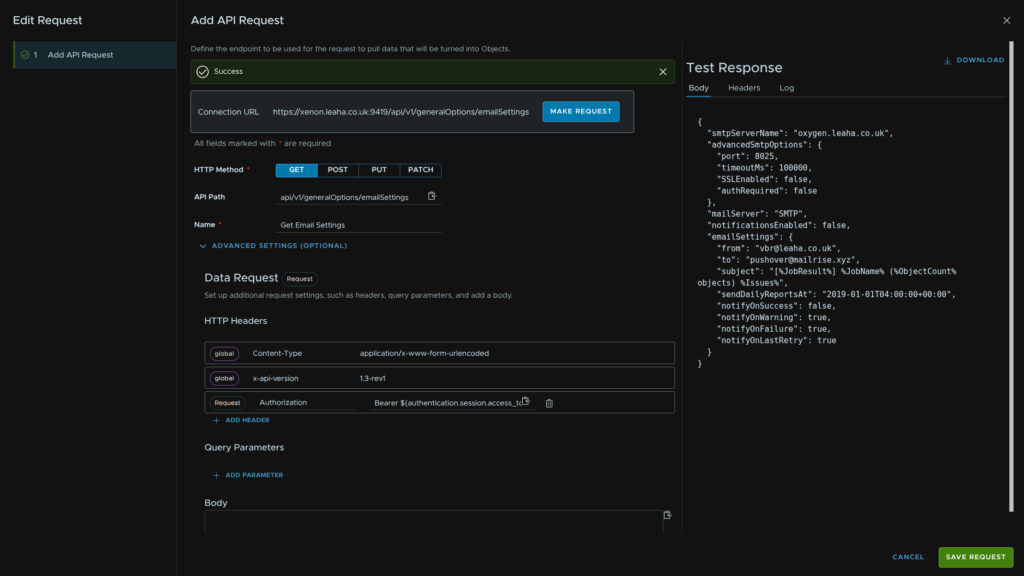
Click Objects in the timeline bar at the top and click Add New
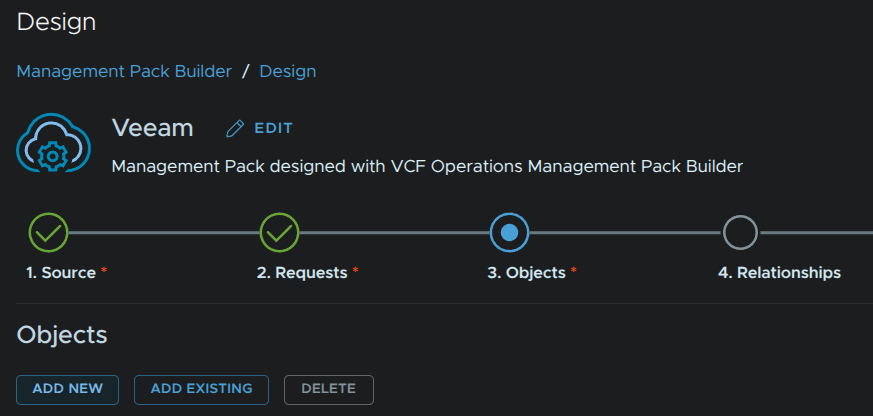
Give it a name and optionally change the default Icon and click Next in the bottom right
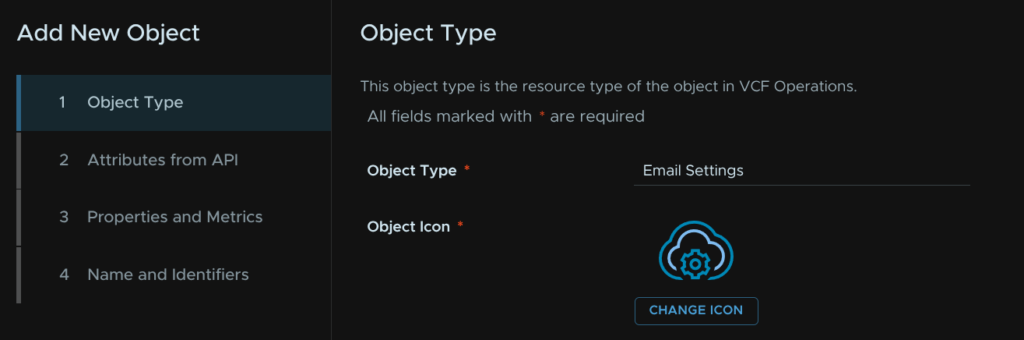
Then expand the Get Email Settings request, if you chose a different name, yours will be different
And select the below, then click Next
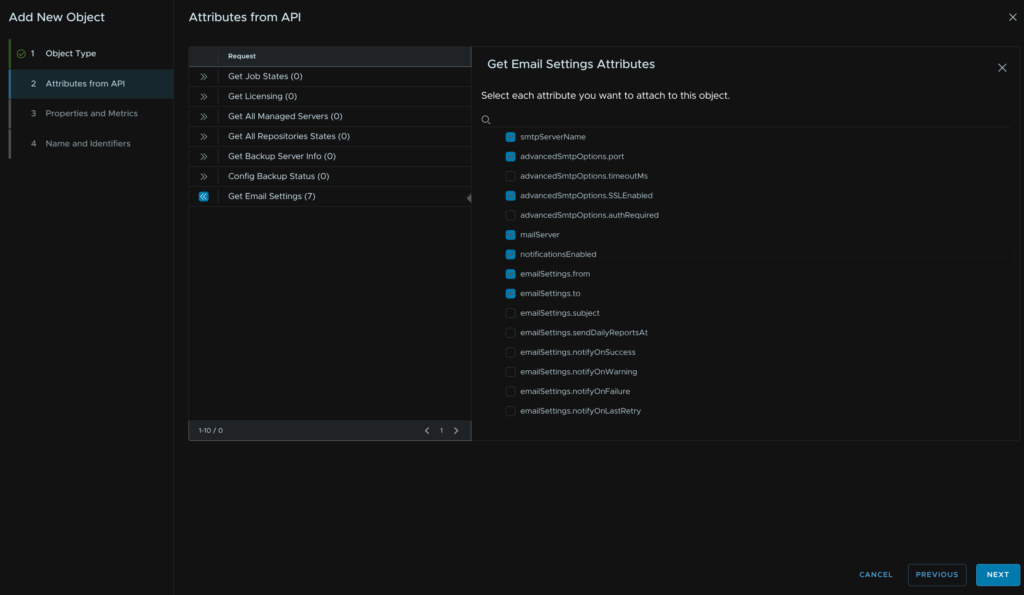
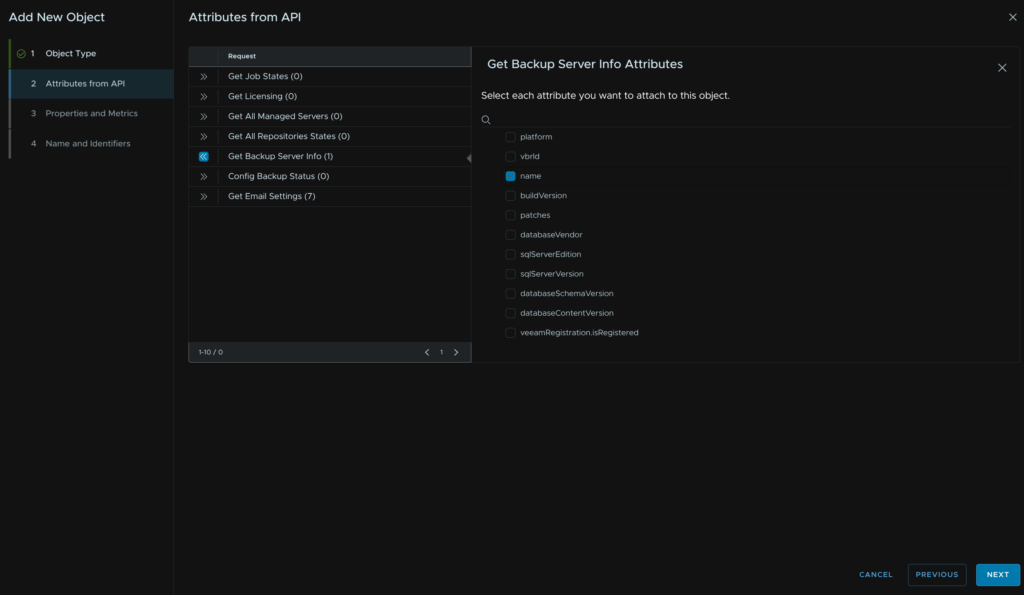
Also expand Get Backup Server Info and select name as this will give us an identifier we need later
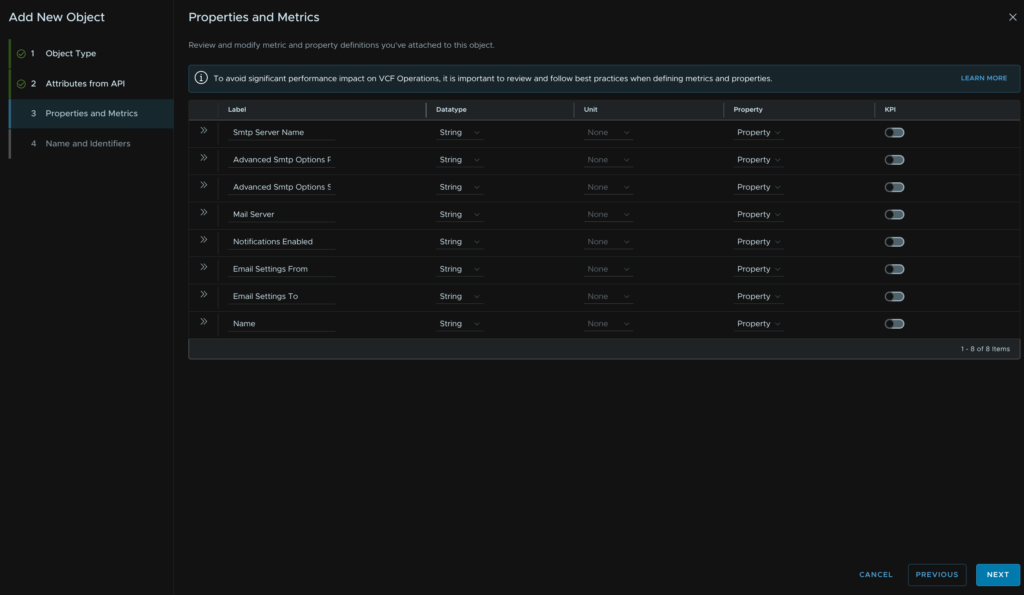
Make sure each label has the correct datatype, this will control if its a property or metric in most cases, here is what I chose, then click Next
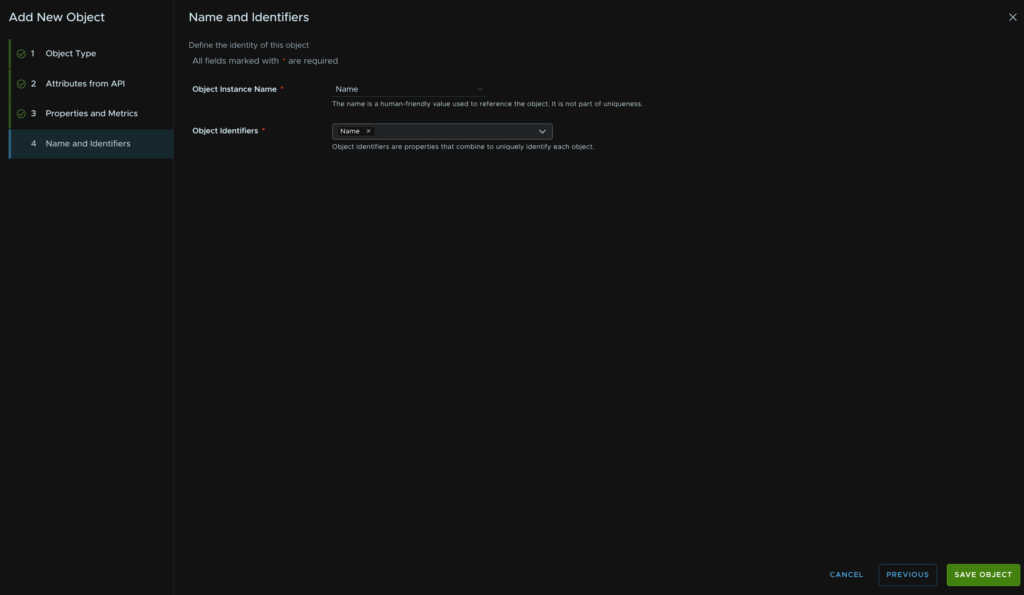
We need some identifiers, for the Object Instance Name, set this to Name, and for the Object Identifiers, use Name then click Save Object
1.1.10 – Get All Proxies
Make sure the HTTP Method is GET, the API path is
api/v1/backupInfrastructure/proxies
Add a name for the request
We need the variable Authorization into the header with this value adding
Bearer ${authentication.session.access_token}
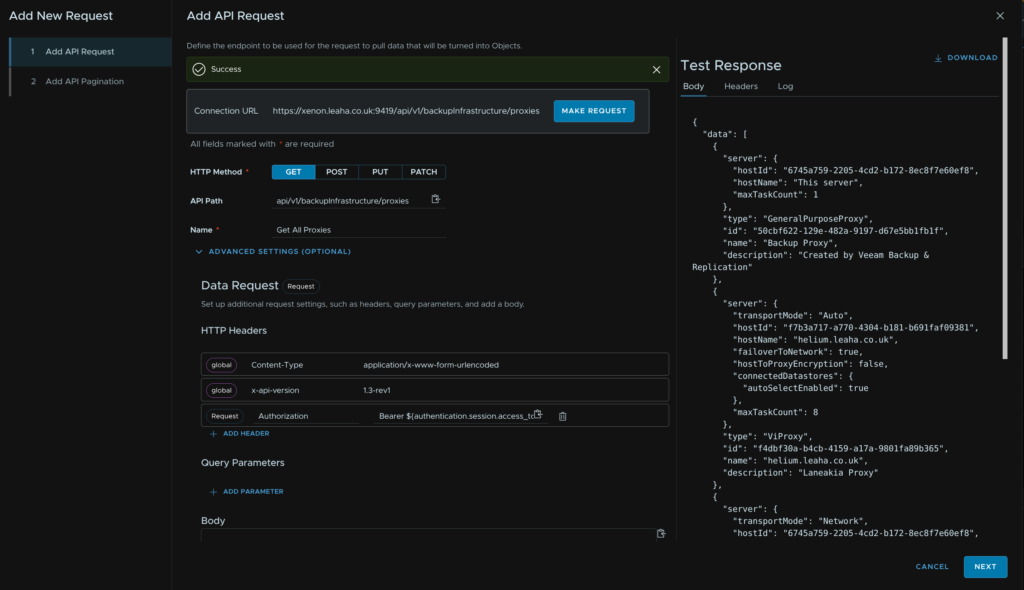
Then click Make Request
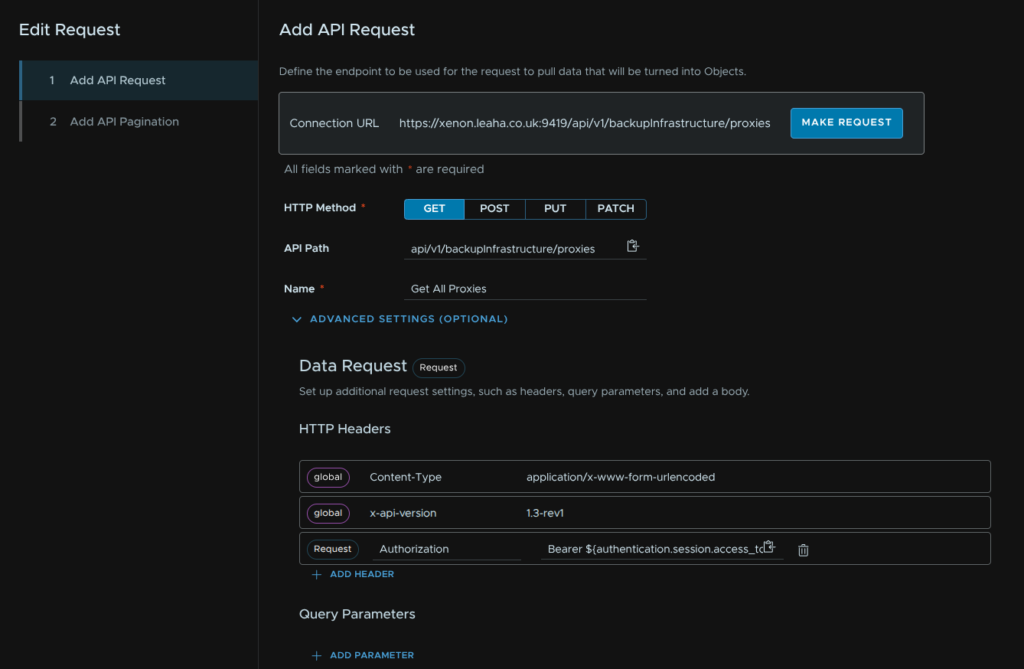
When thats run ok and returns data, click Next
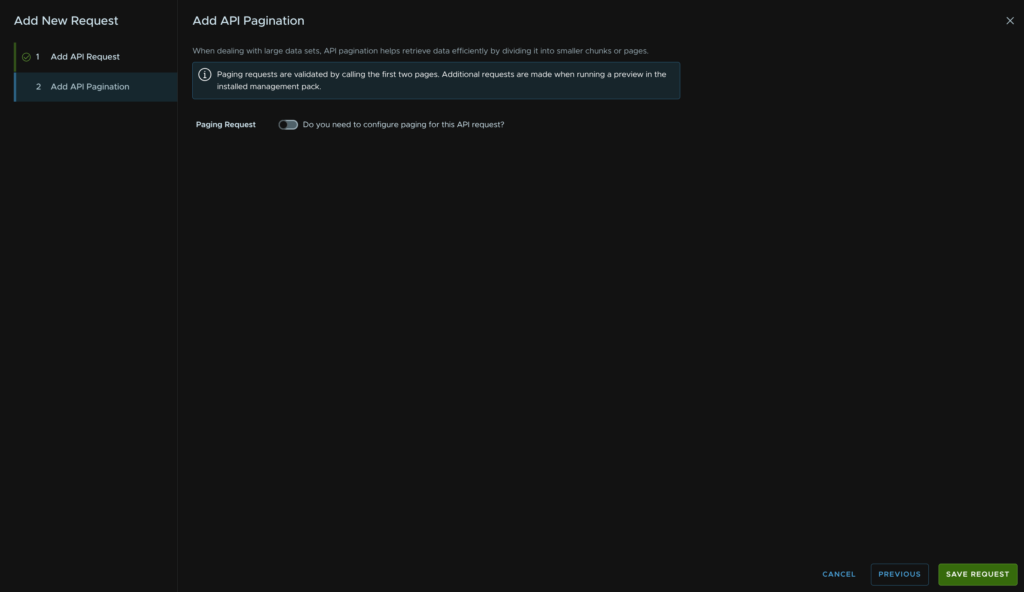
Disable pagination and click Save Request here
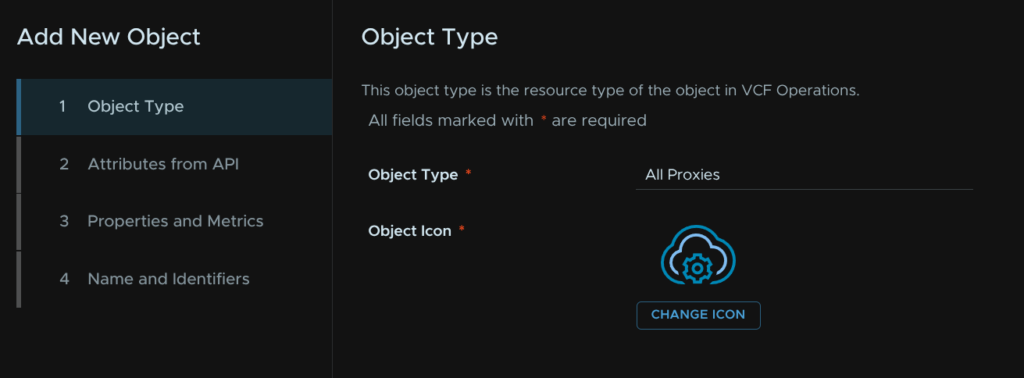
Click Objects in the timeline bar at the top and click Add New and click Next in the bottom right
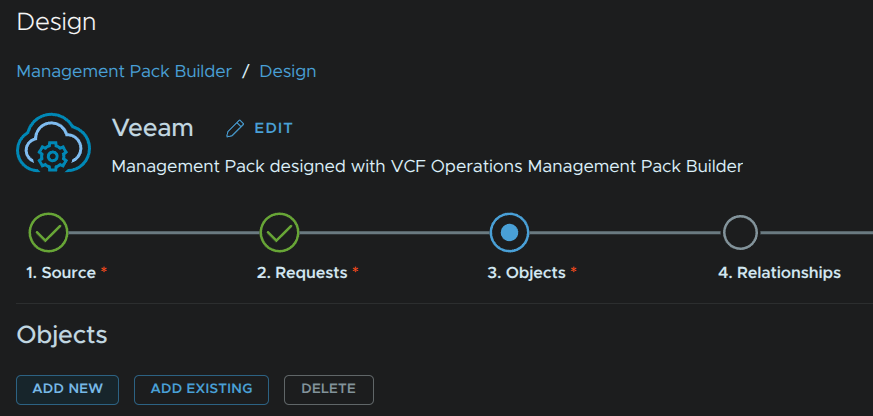
Give it a name and optionally change the default Icon
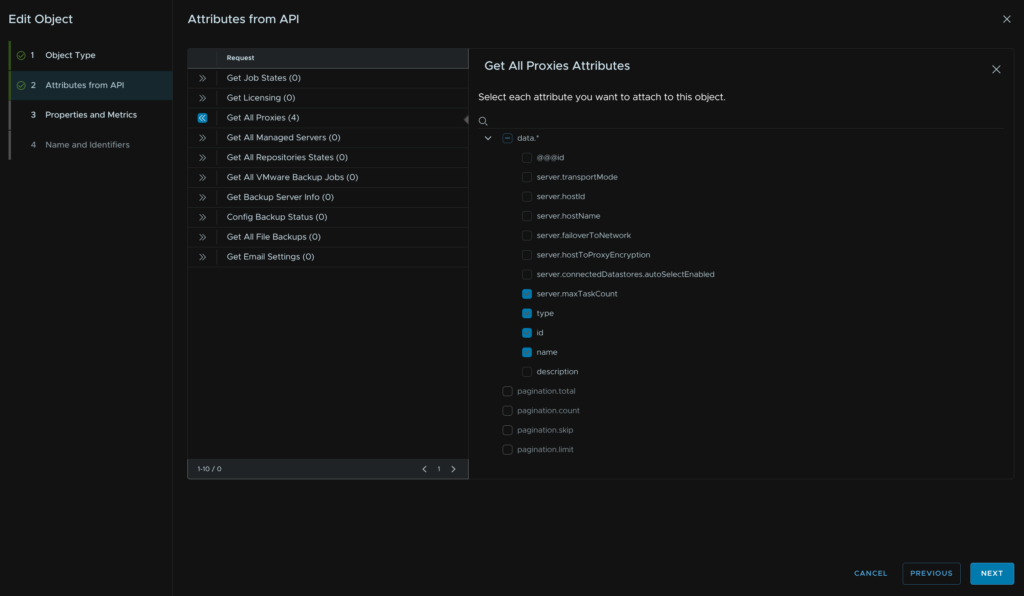
Then expand the Get All Proxies request, if you chose a different name, yours will be different
And select the below, then click Next
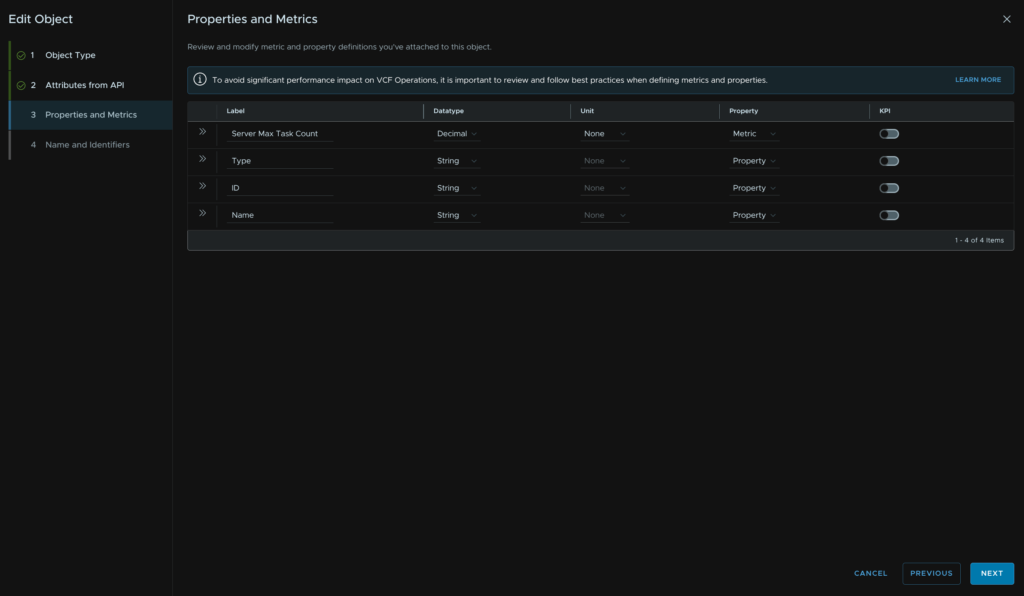
Make sure each label has the correct datatype, this will control if its a property or metric in most cases, here is what I chose, then click Next
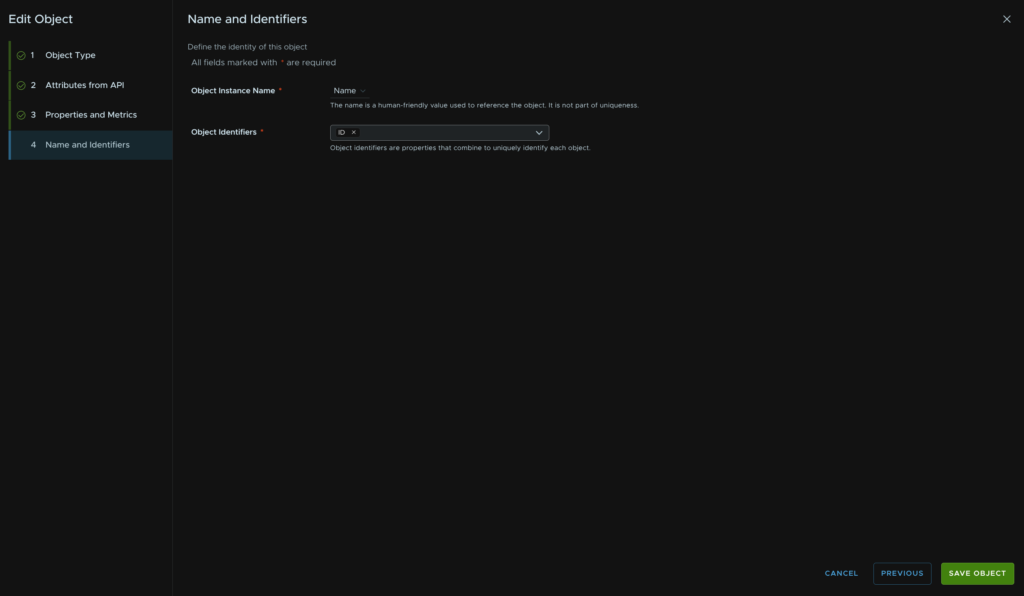
We need some identifiers, for the Object Instance Name, set this to Name, and for the Object Identifiers, use ID then click Save Object
1.1.11 – Get Security Best Practices Analyzer Results
Make sure the HTTP Method is GET, the API path is
api/v1/securityAnalyzer/bestPractices
Add a name for the request
We need the variable Authorization into the header with this value adding
Bearer ${authentication.session.access_token}
Then click Make Request
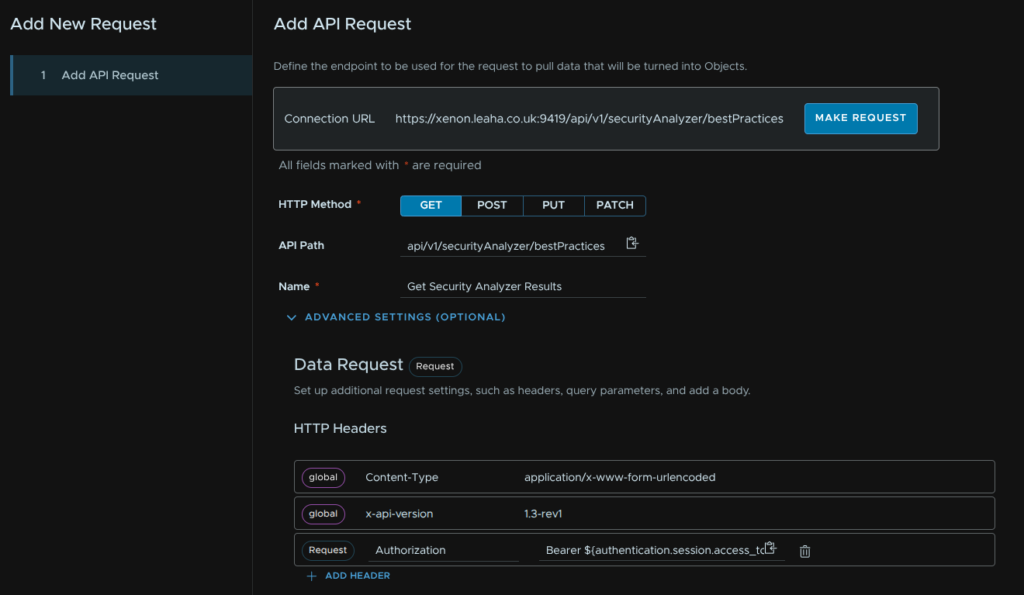
When thats run ok and returns data, click Next
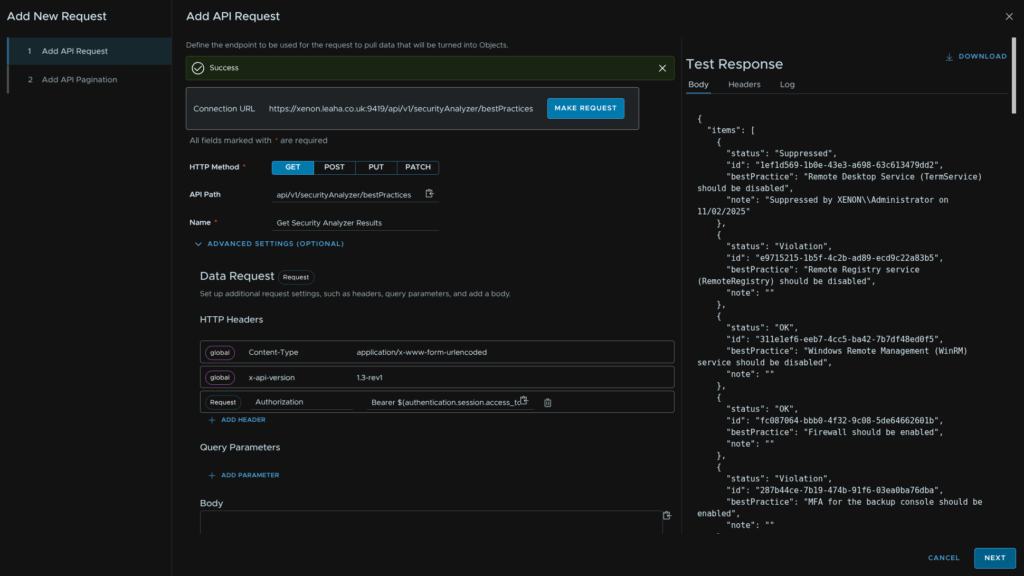
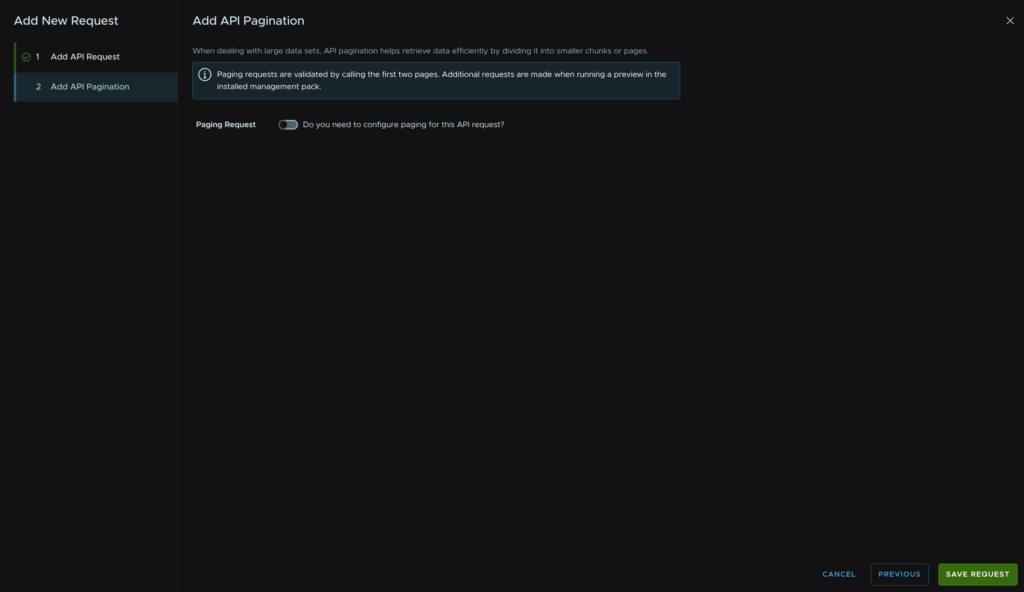
Disable pagination and click Save Request here
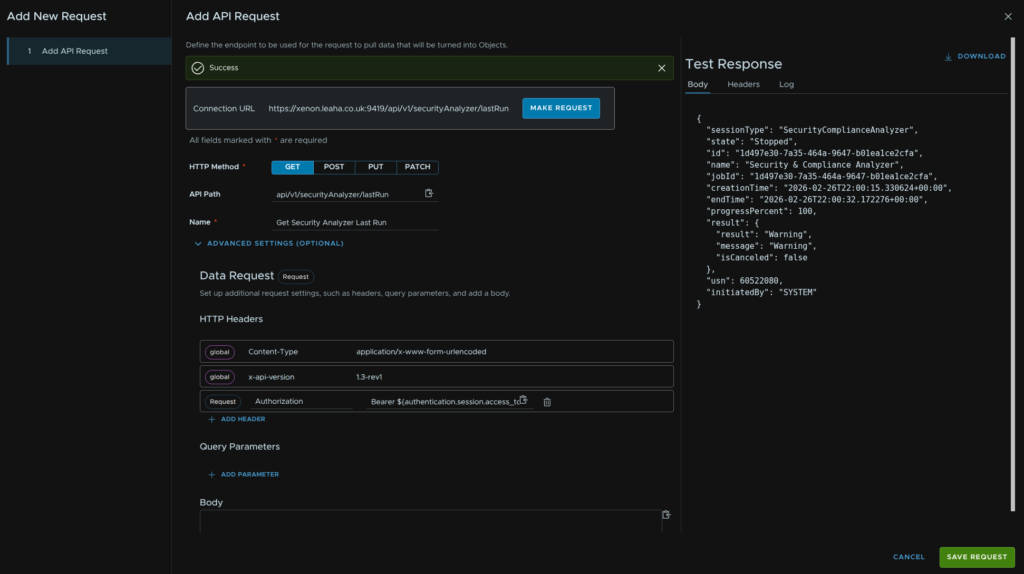
Now this gets us the results, but not when it ran, create another request, we need the same HTTP header with our Bearer token, but the API path should be
api/v1/securityAnalyzer/lastRun
Then click Make Request
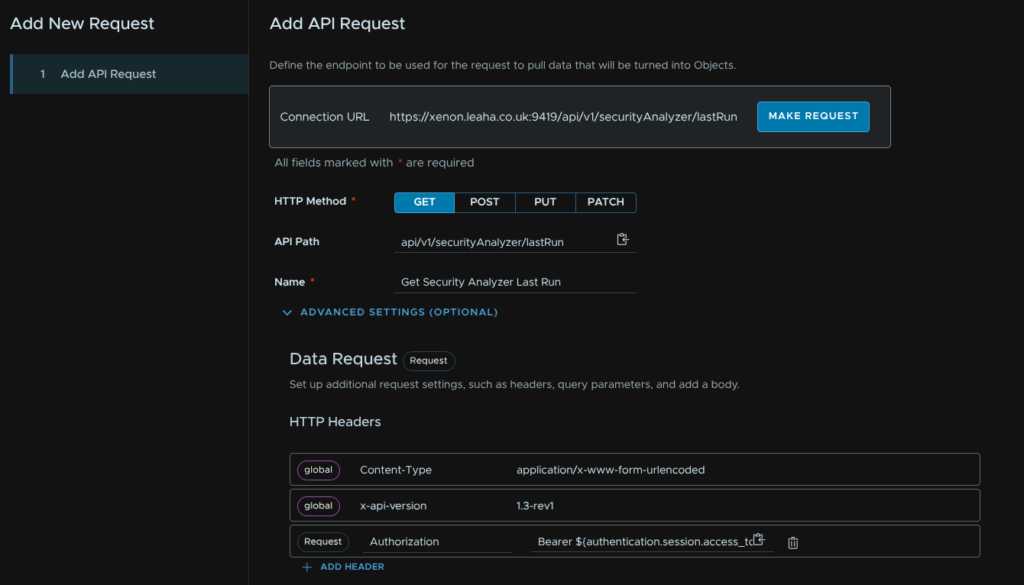
Here we can see its run time was, for me, yesterday at 2200, click Save Request
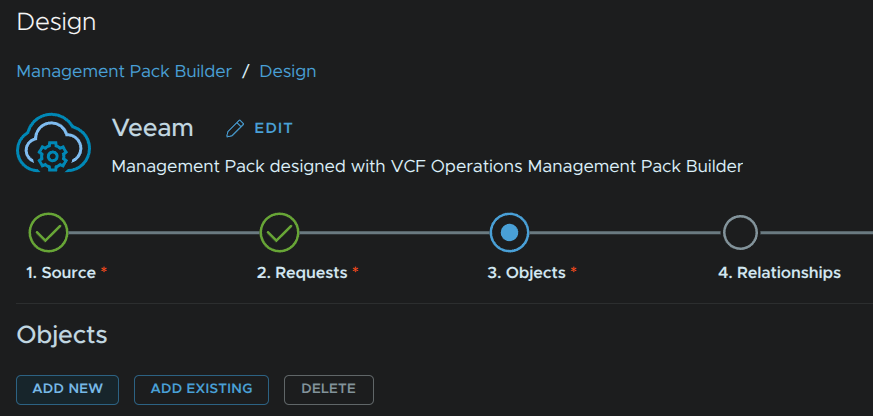
Click Objects in the timeline bar at the top and click Add New
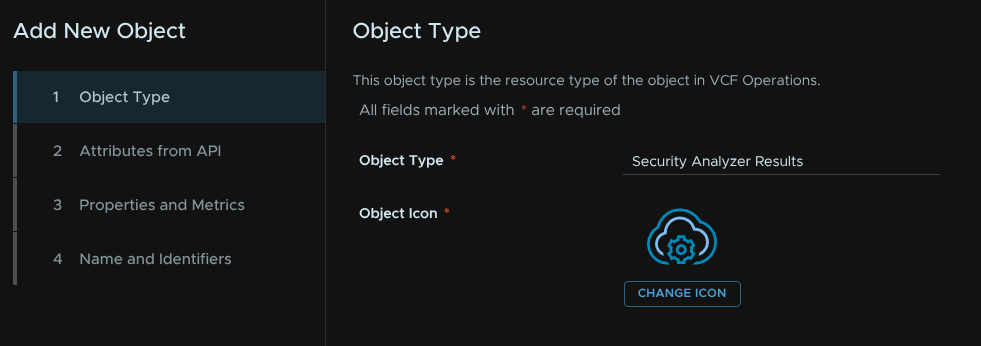
Give it a name and optionally change the default Icon and click Next in the bottom right
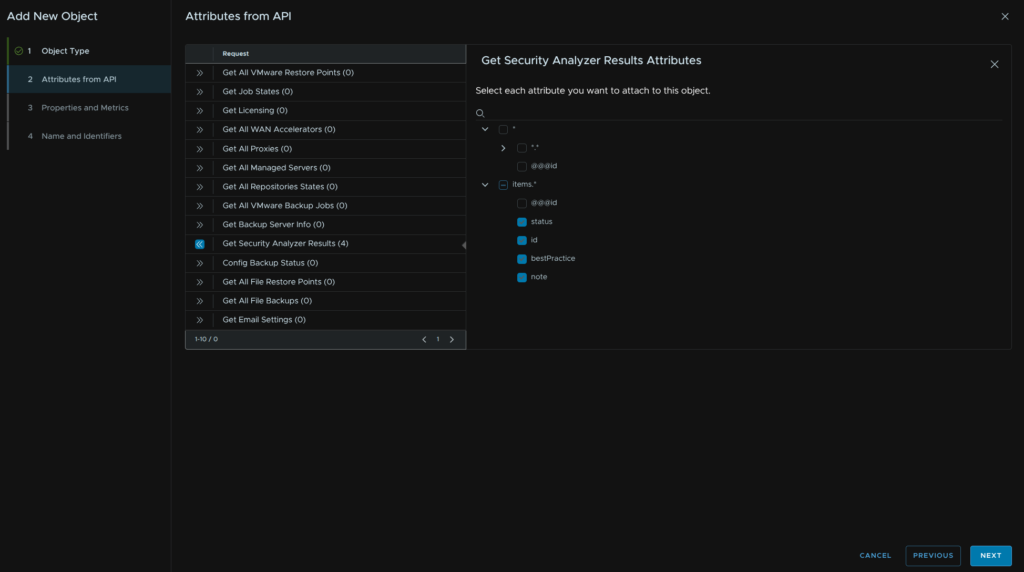
Then expand the Get Security Analyzer Results request, if you chose a different name, yours will be different
And select the below, then click Next
Make sure each label has the correct datatype, this will control if its a property or metric in most cases, here is what I chose, then click Next
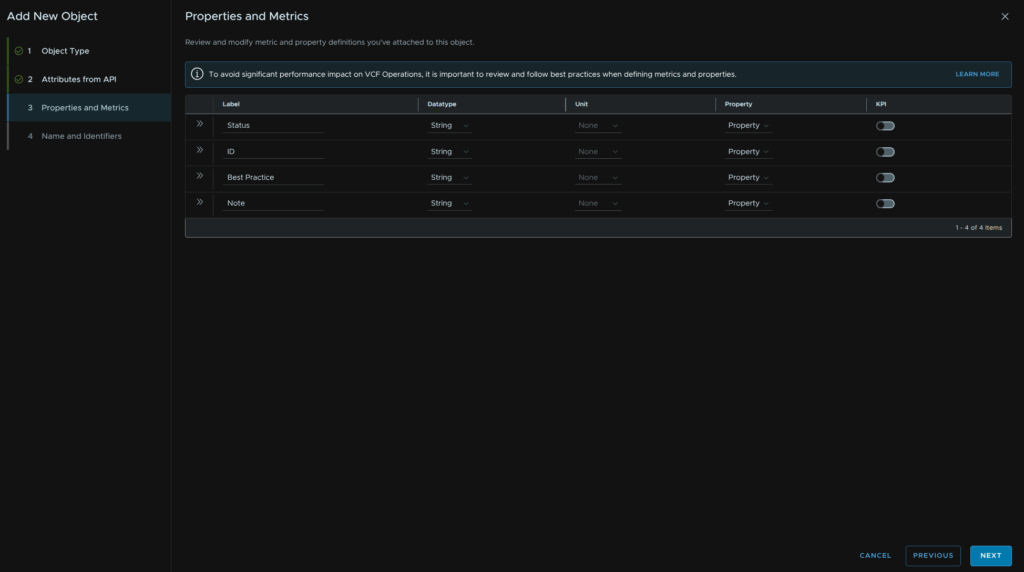
We need some identifiers, for the Object Instance Name, set this to Best Practice, and for the Object Identifiers, use ID then click Save Object
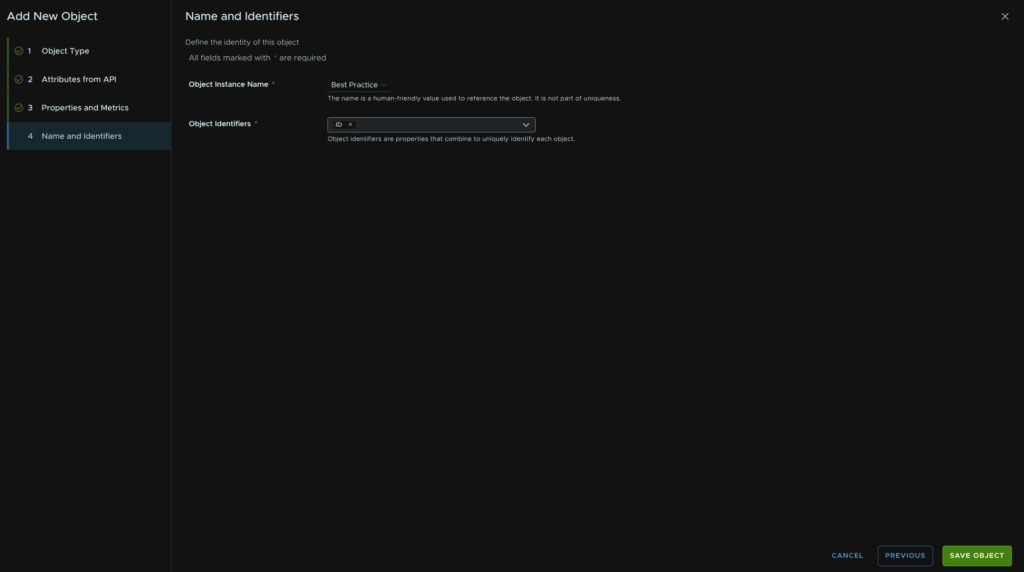
We cant combine the last scan run time we got in our other request, into the one with the results, but we can create another object so the data is in Operations
Click Objects in the timeline bar at the top and click Add New
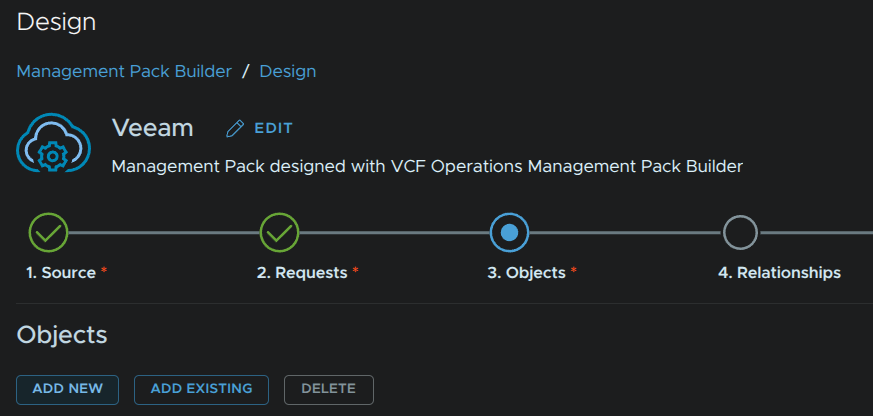
Give it a name and optionally change the default Icon and click Next in the bottom right
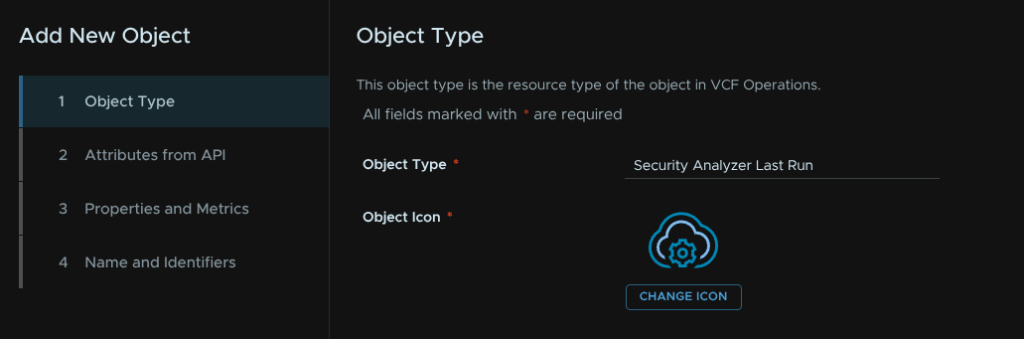
Then expand the Get Security Analyzer Last Run request, if you chose a different name, yours will be different
And select the below, then click Next
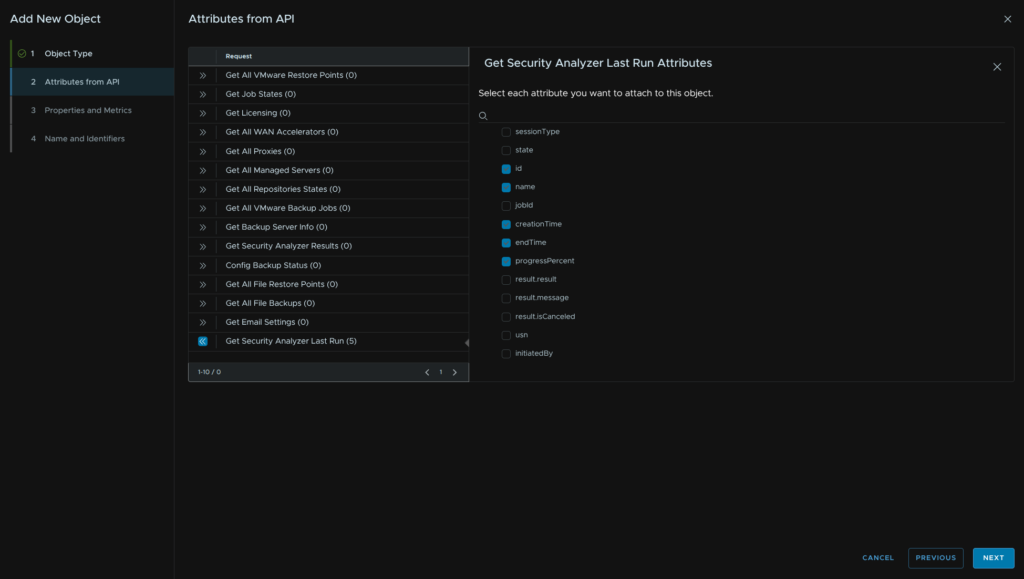
Make sure each label has the correct datatype, this will control if its a property or metric in most cases, here is what I chose, then click Next
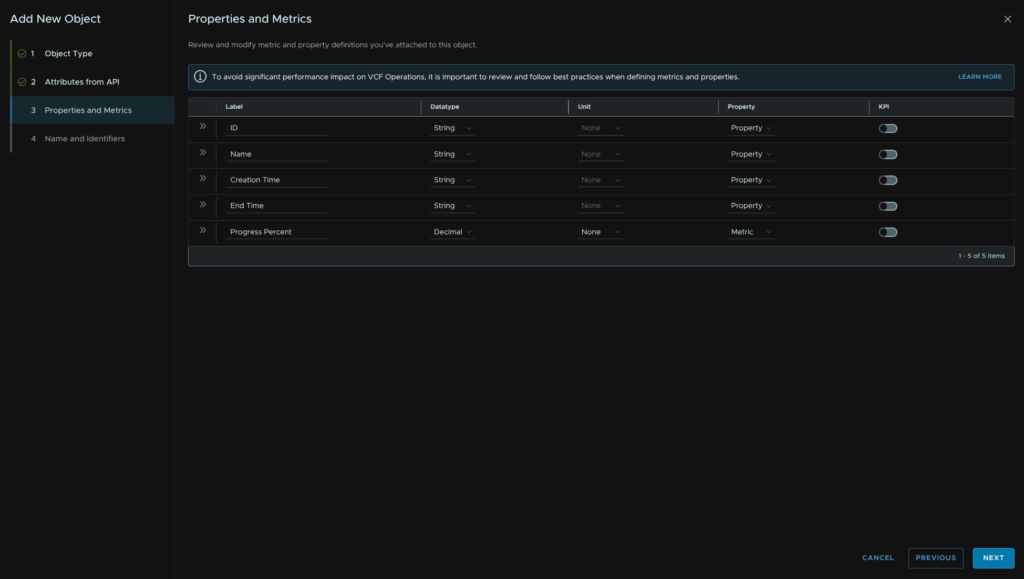
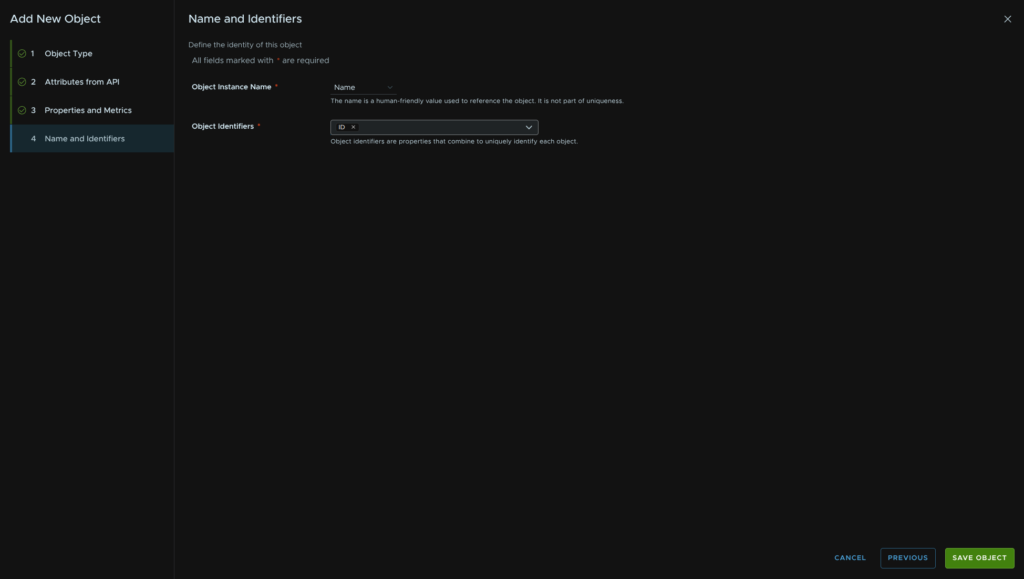
We need some identifiers, for the Object Instance Name, set this to Name, and for the Object Identifiers, use ID then click Save Object
1.2 – Home Assistant
1.2.1 – Getting Our API Key
Before we start we will need a long term API key from Home Assistant, to get this log into the application in a web browser, in the bottom right click your username, in my case, leaha
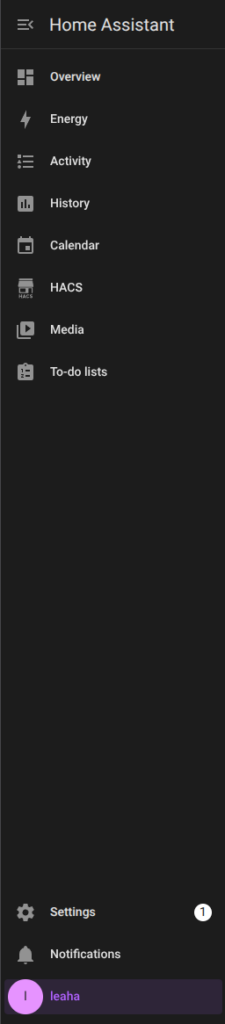
At the top, click Security

At the bottom you will see a section called Long-Lived Access Tokens, click Create Token
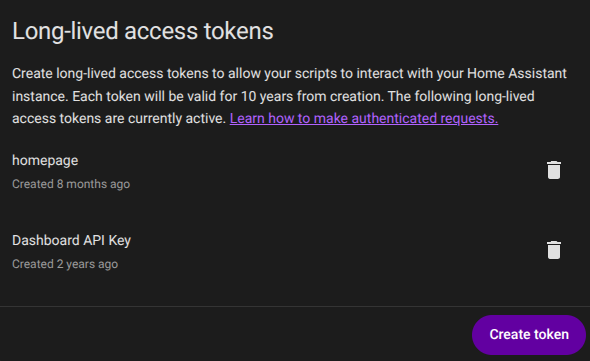
Give the token a name and click Create Token
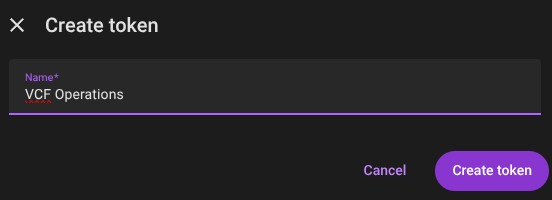
Copy and save this key, it wont be shown again, then click close
1.2.2 – Mapping The Source
Log into VCF Operations and click Developer Center/Management Pack Builder, then click Create New
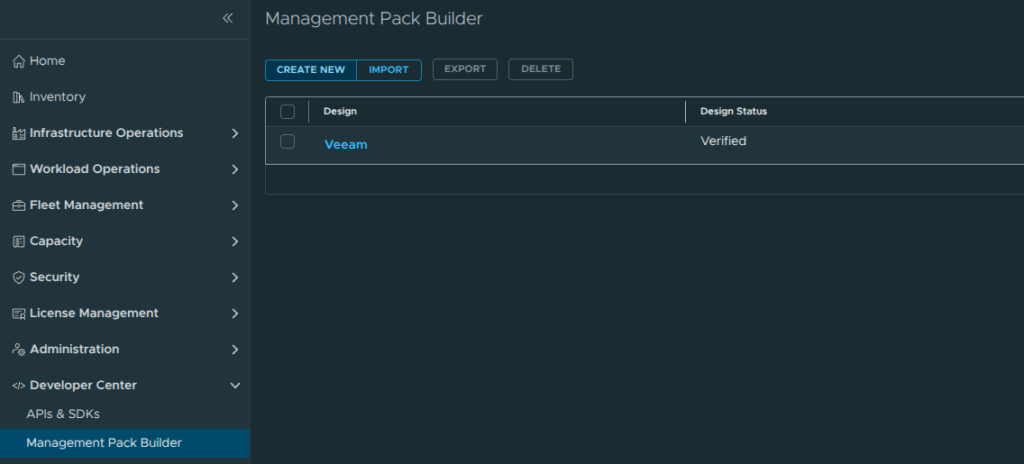
Give it a name and click Create
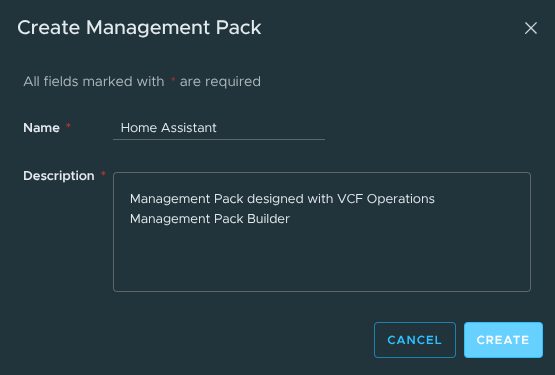
Click Add Source
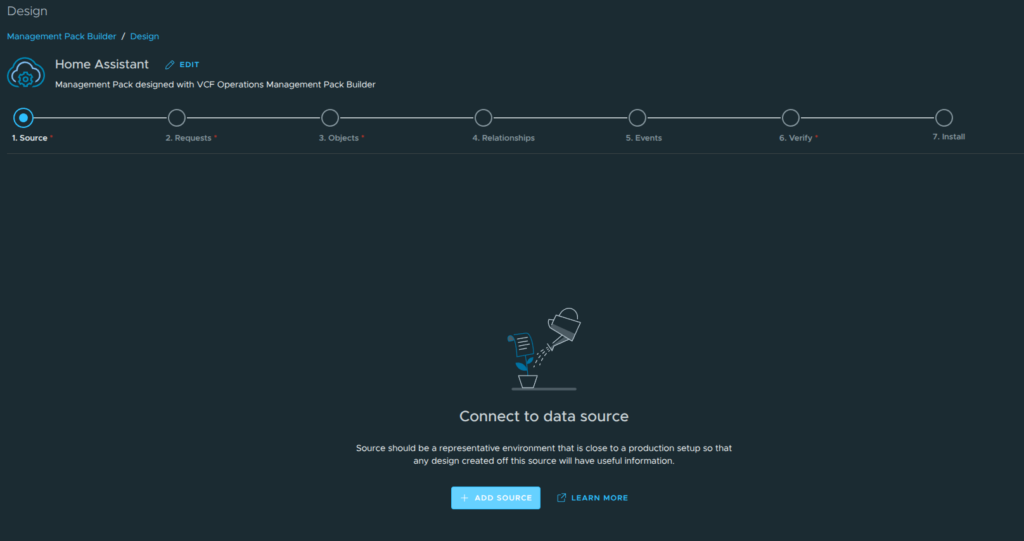
For the source details we need a few bits, first select the collector, then add the host name, this should be just the FQDN of your Home Assistant server, then its port, this should be 8123, the TLS configuration, the OVA I deployed doesnt have it and I havent set it up, so I am using no TLS, this is sorted locally on my network so TLS isnt strictly required, and then we need the base API path which is api, like this
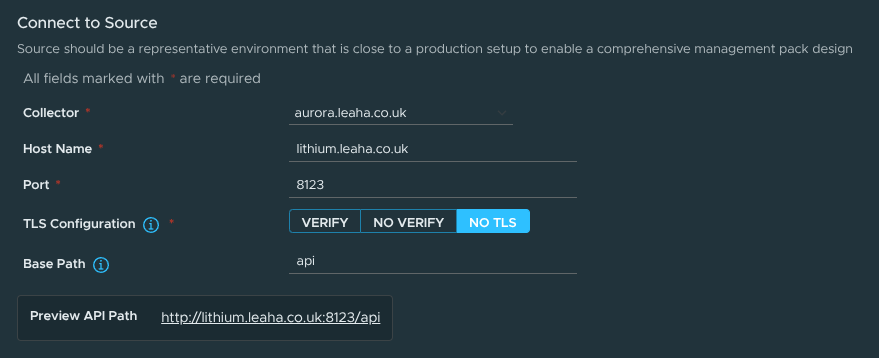
We are then going to need some authentication details, here we want to type Custom, in the first field, enter a name, this doesnt really matter what you use, I used APIKey, then in the value second to the right, enter your key which we got from Home Assistant and click Next
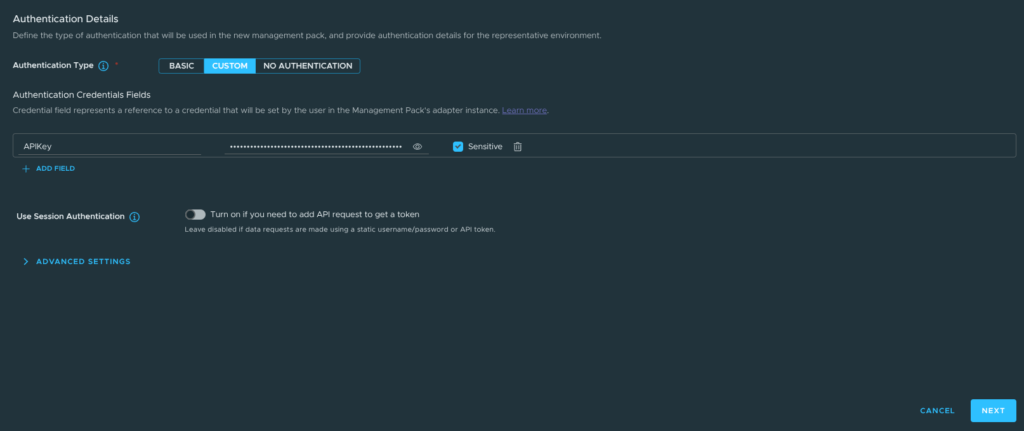
For the authentication, the API request expects this in a very specific format, this is expected as a HTTP header so we can add this here as a global setting, so its applied on every request we make later, which is really important
Click Add Header
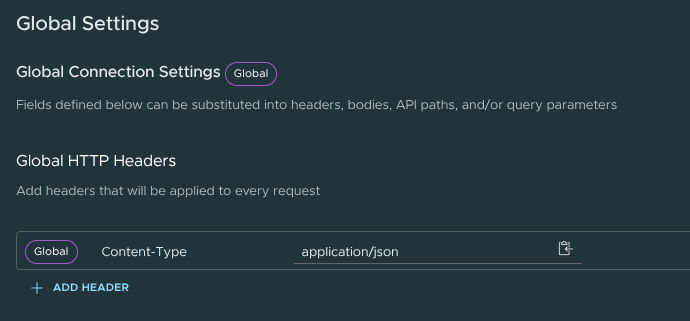
Now for the left field enter ‘Authorization’ and for the right value enter ‘Bearer ‘, you’ll notice there is a space after Bearer, this must be included, if you then click the little paste icon on the right of Bearer, we can see the credential we entered earlier for APIKey, click that
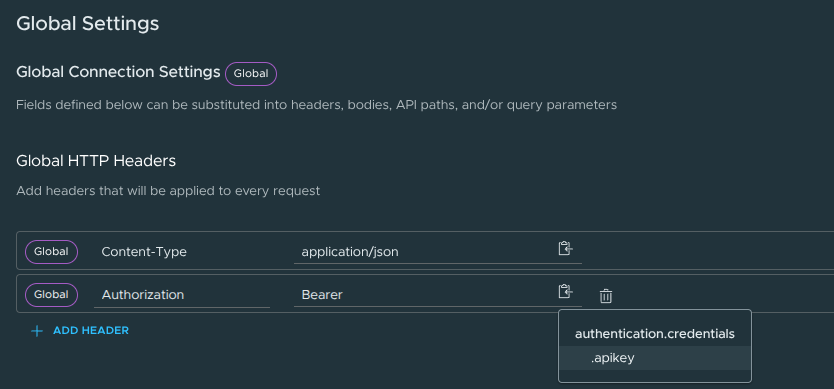
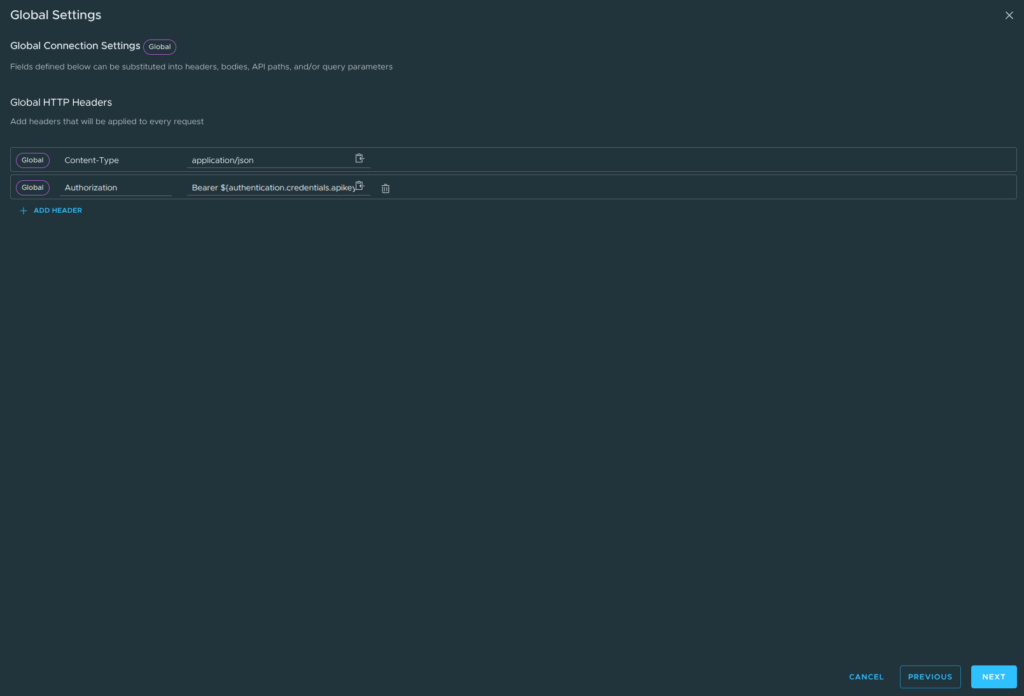
It should look like this, click Next
The exact value, assuming your API Key value was called APIKey like mine will be
Bearer ${authentication.credentials.apikey}
Now we need an endpoint to test this against, my goal here is to take whats is on my Home Assistant dashboard and get a copy running in VCF Operations, so I will be getting my sensor values from there, you can always check from a list of everything from, Settings/Devices & Services in Home Assistant
But if I click my widget that has the data I want to pull to Ops, we will use this as the first test
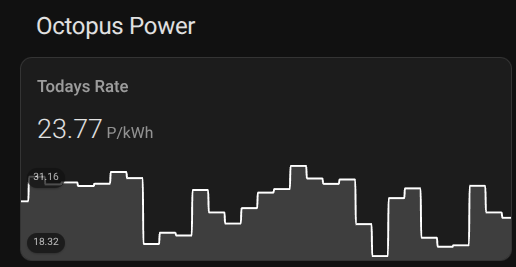
I get a window that looks like this, click the Settings Cog in the top right
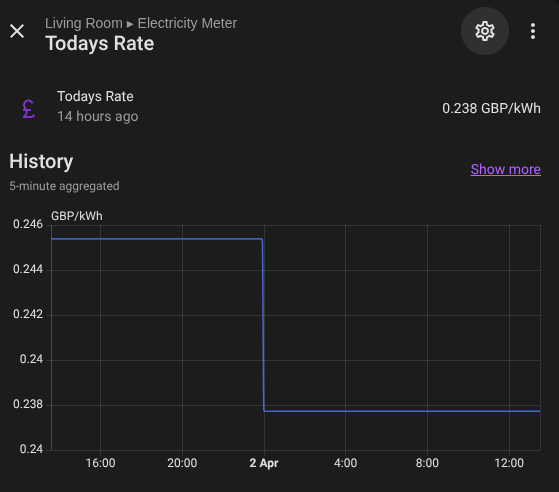
What we want to copy out is the entity ID, I have blocked some parts out, as for Octopus, this relates to my actual physical meter, but click the copy icon on the right on the Entity ID field
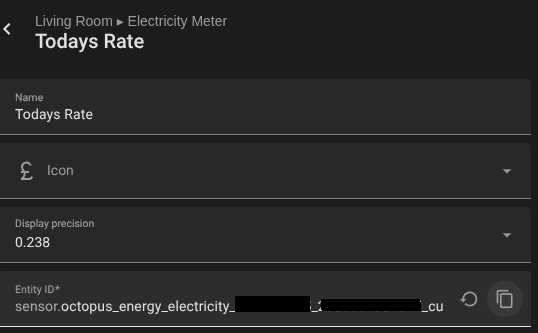
The API Path we need for the tests will be
states/<entity-id>
It should look like this, leave the method on GET and click Test Connection
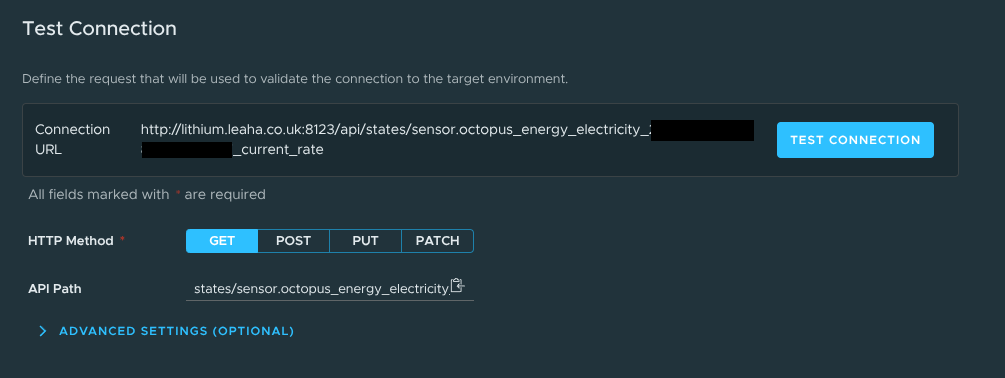
And the result should pass and pull the data the entity in Home Assistant has, then click Save Source
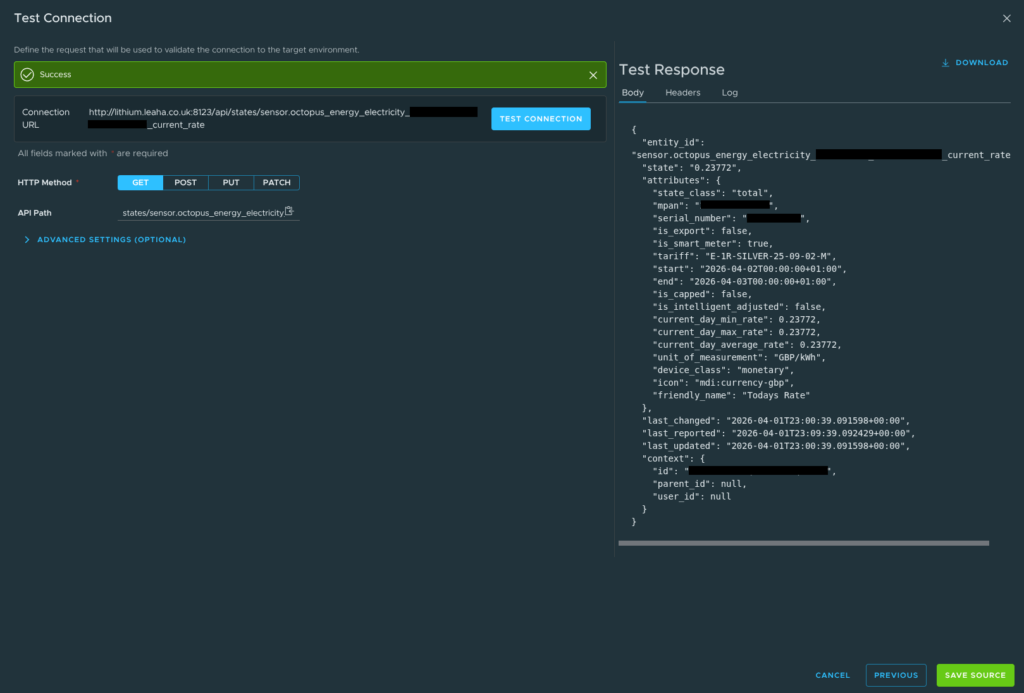
1.2.3 – Requests
Now we need to add requests, and what these are will vary depending on what your entity IDs are in Home Assistant, so I’ll use my Octopus Power from earlier as a baseline for a detailed description on how make requests but wont do the full detail for all my data points as they are unique to me
First click on Requests at the top and click Add Request
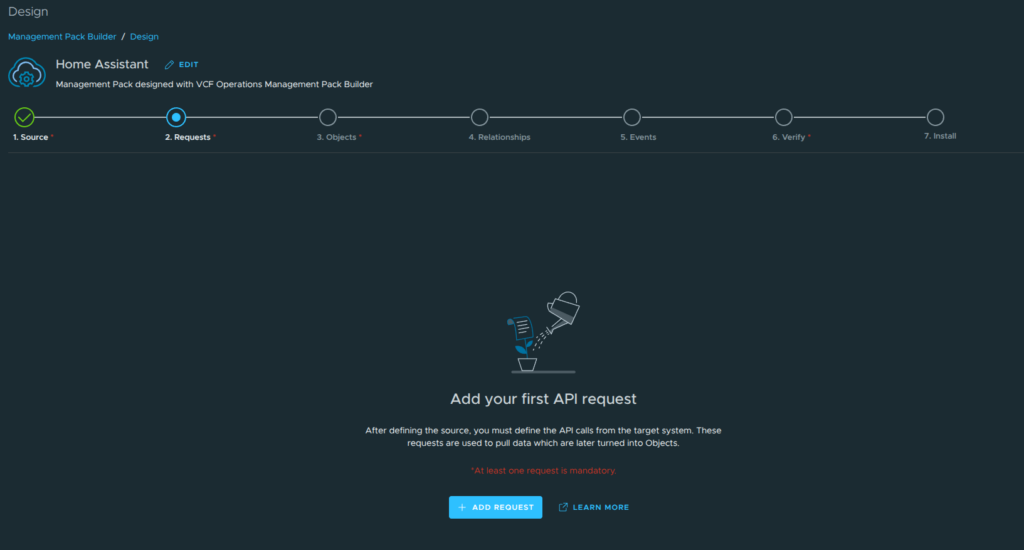
Set the HTTP method to GET, for the API path this needs to be the following, like we got in our test
states/<entity-id>
I have expended the Advanded Settings to show whats there, I havent added anything, the only thing we need is a HTTP header for authorization, but thats already been added from the setup
Click Make Request
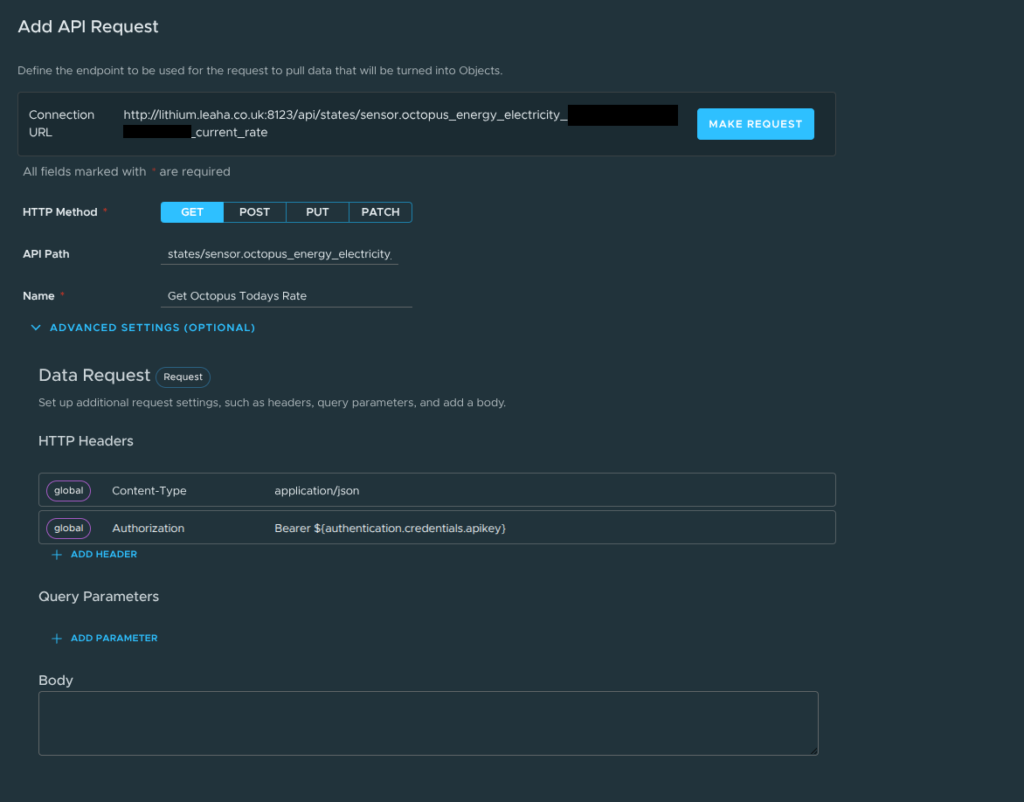
We should see the request go through, if not do double check the API path, you can see the sensor value I have got, your should match the general idea, but for your sensor, when thats ran fine click Save Request
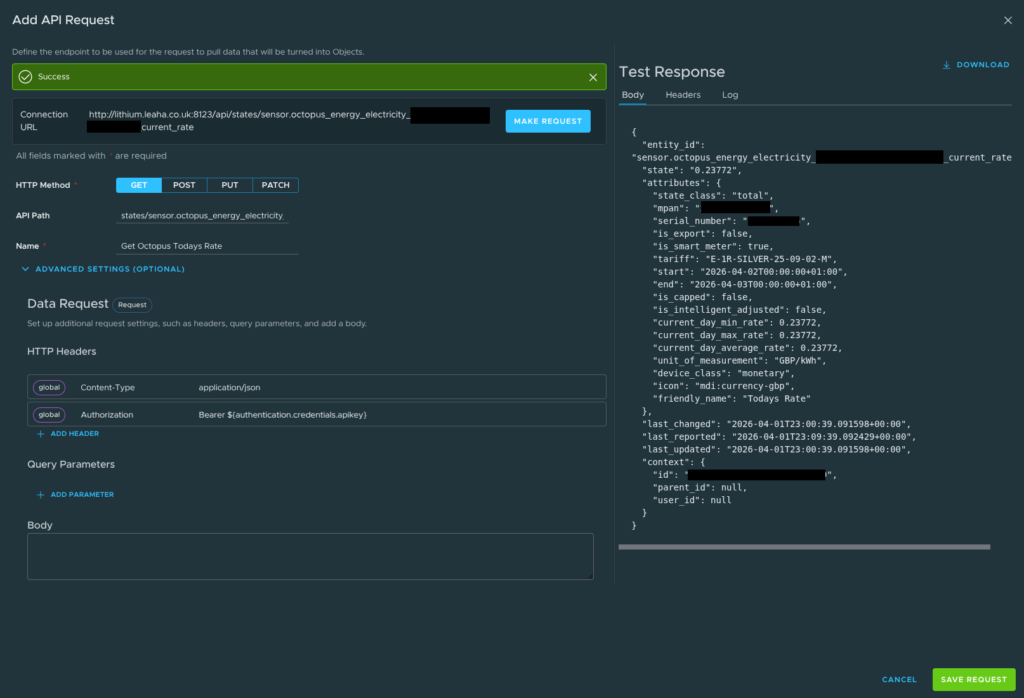
You may have a second page for pagination, this can be disabled unless you know you need it
Once we have all our requests it should look like this, depending on what you added
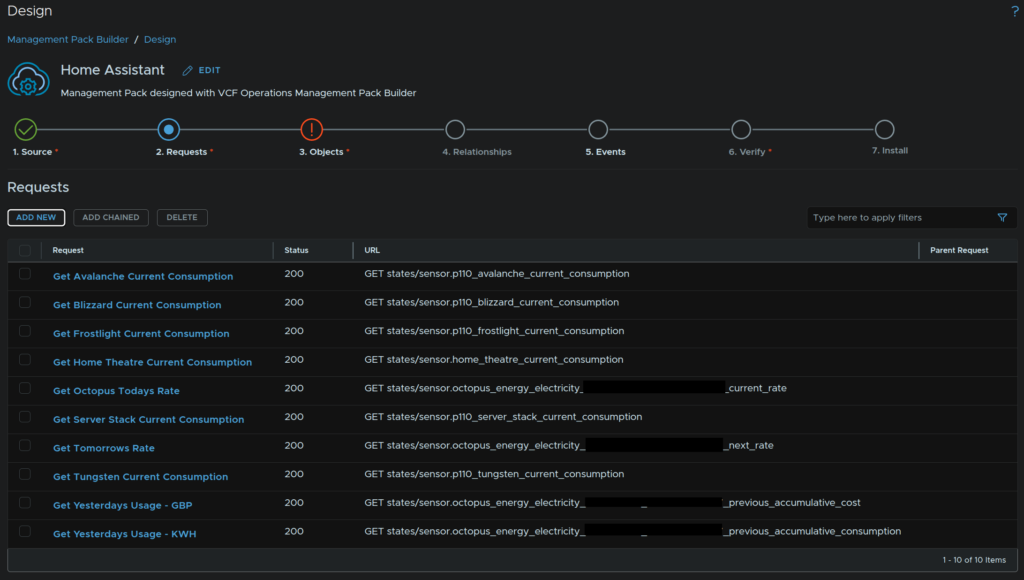
1.2.4 – Objects
How you define your objects will depend entirely on what data you are pulling, but numerical data, in my case my power stats, will all be metrics, names or other values will be properties
To configure this, click Objects and click Add New Object
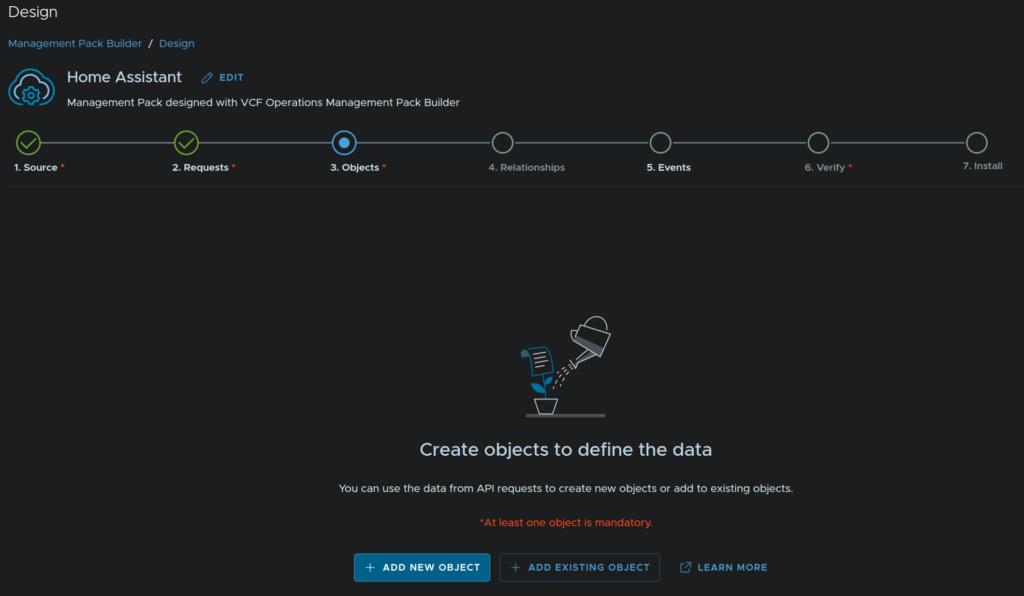
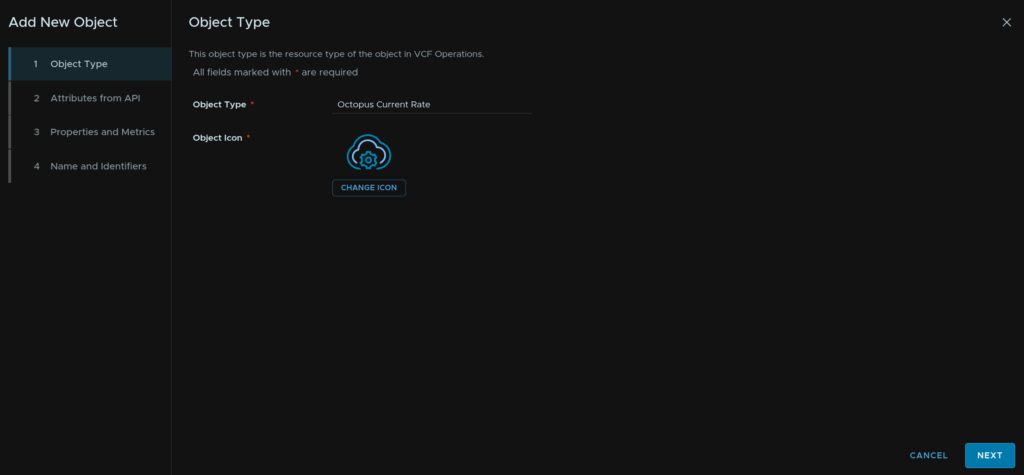
Lets define data for my current electricity rate, following on from our example in Requests, give it a name and click Next
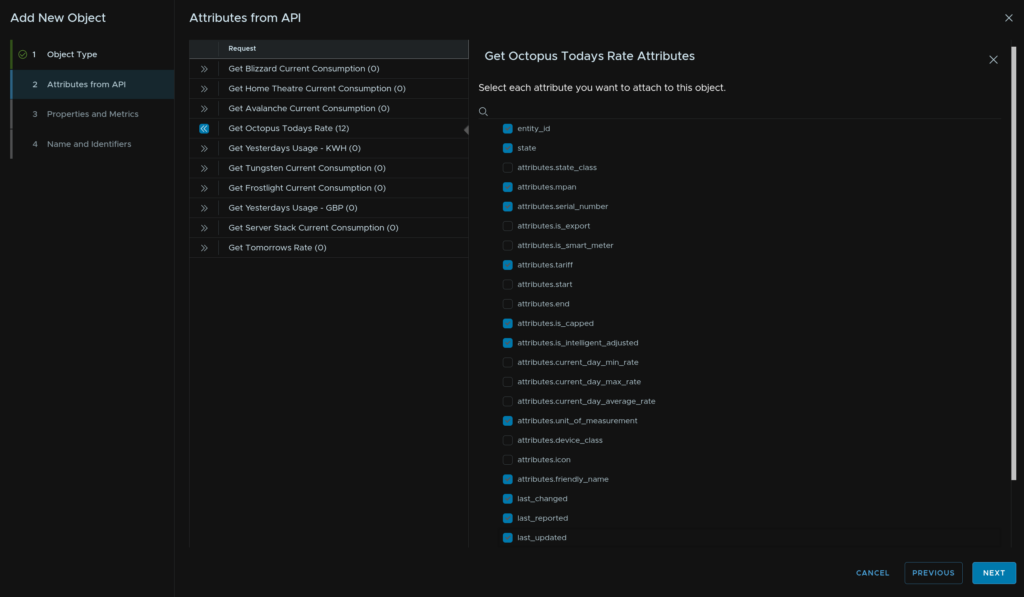
Expand the request we defined earlier, and select all values you want in this object definition and click Next
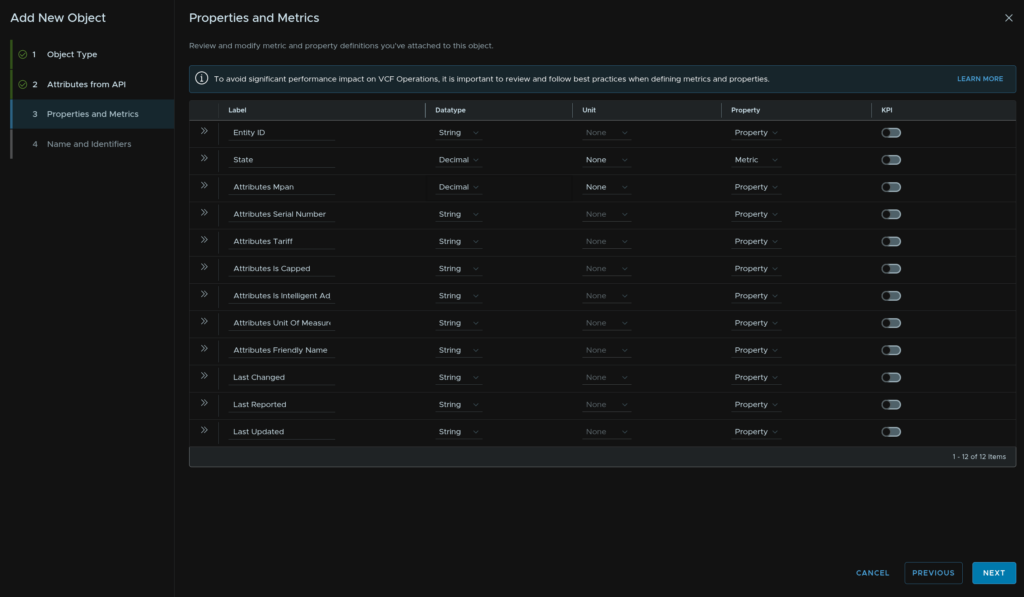
Make sure all our values that we want as metrics/properties are defined, for me the only metric is the rate, and everything else is a property and click Next
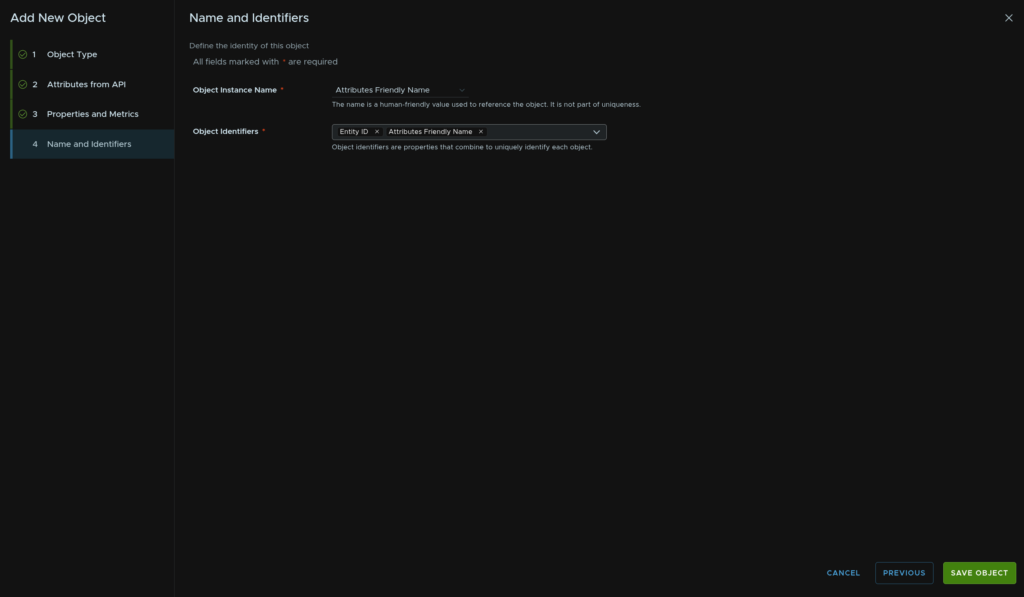
Now we need to set a field for uniquely identifying each object instance, for me the friendly name was the clear choice for the Object Instance Name, as this is something I can easily identify with VCF Operations, and for the Object Identifier, what uniquely identifies a value from this object and its request, the ID and Name fit well here
When you are happy, click Finish
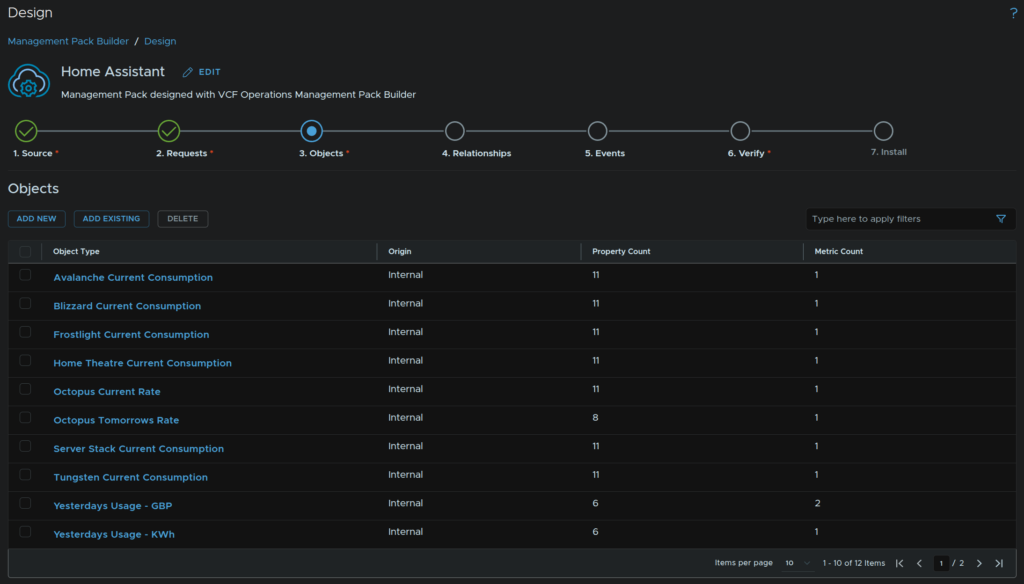
You will then need to repeat for all other requests so we have defined objects for the data in Operation
When you are done it should look a little like this
1.2.5 – Verify And Install
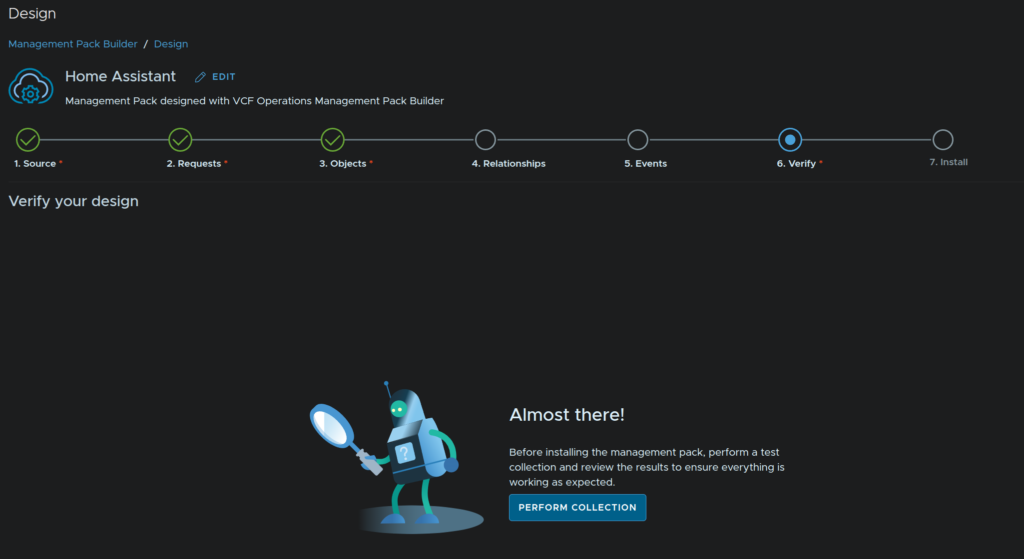
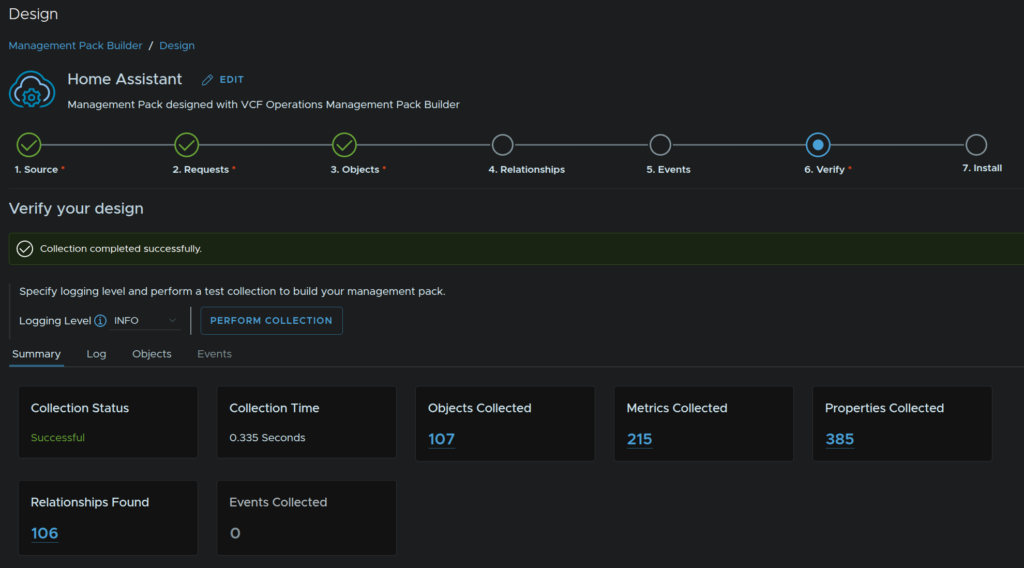
Once you have all your objects click Verify/Perform Collection
When its all gathered successfully, click Install
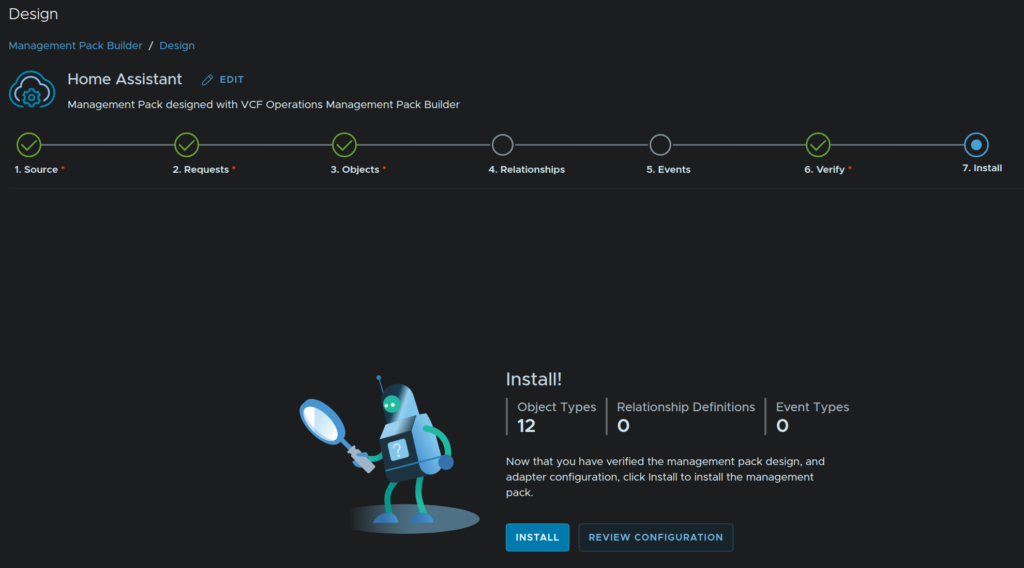
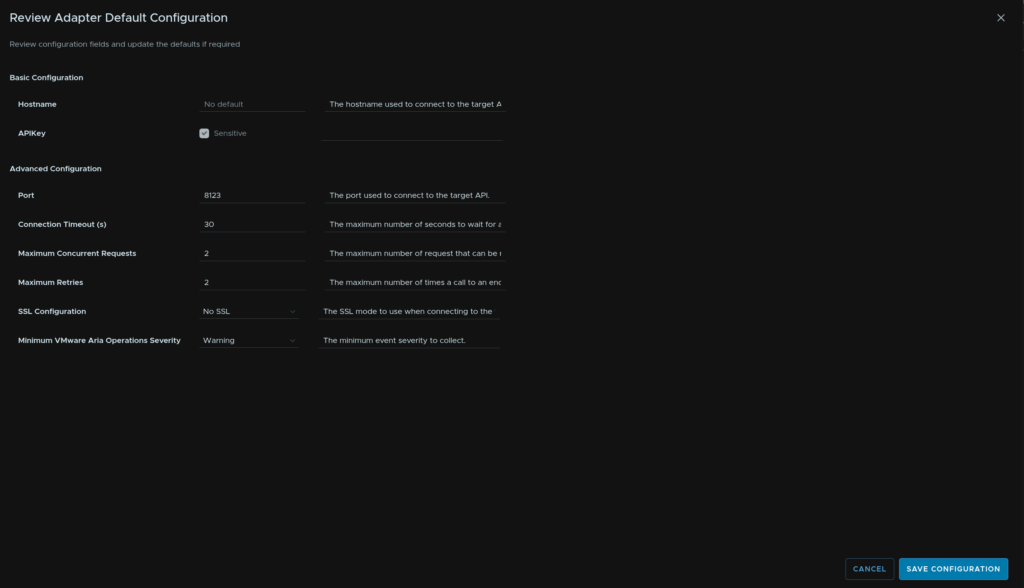
Click Review Configuration
Make sure you change the port to 8123 and SSL to no SSL then click Save Configuration
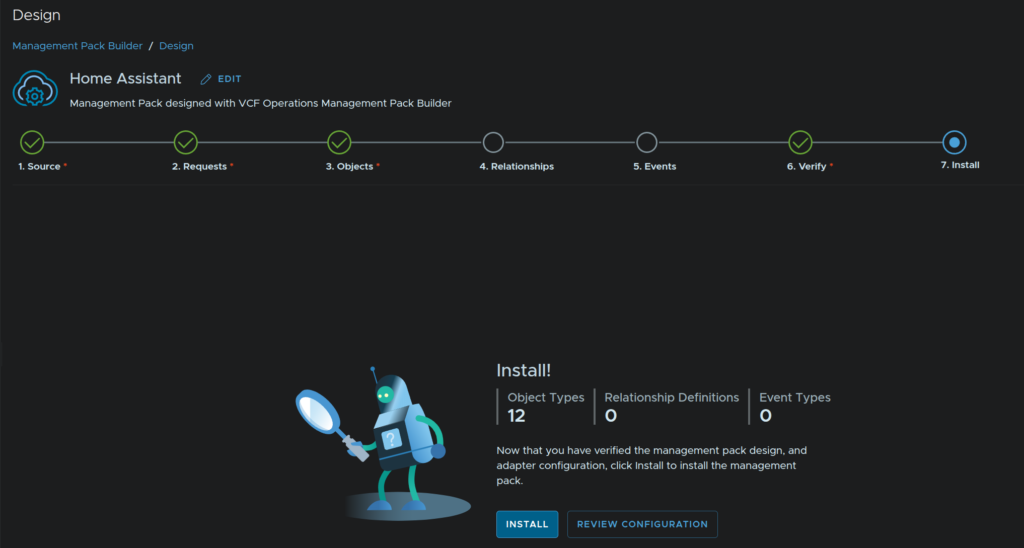
Now click Install
1.2.6 – Adding The Integration
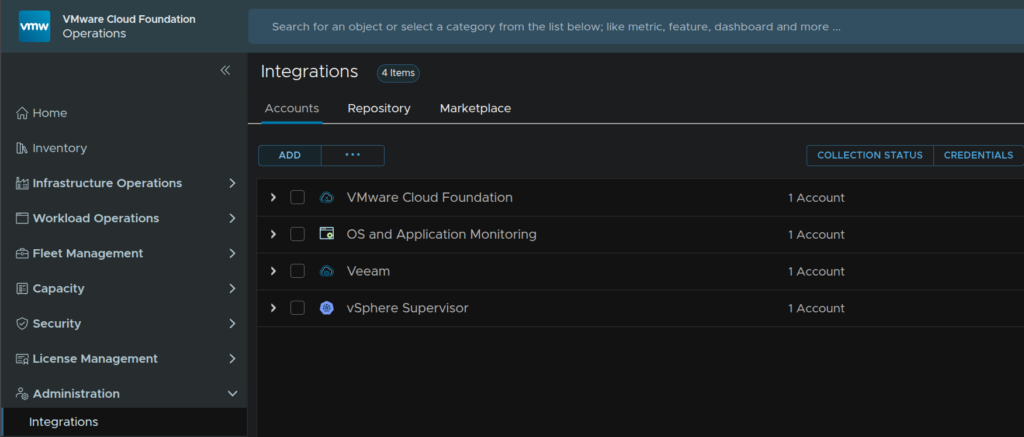
Now we can add the integration, click Administration/Integrations/Add
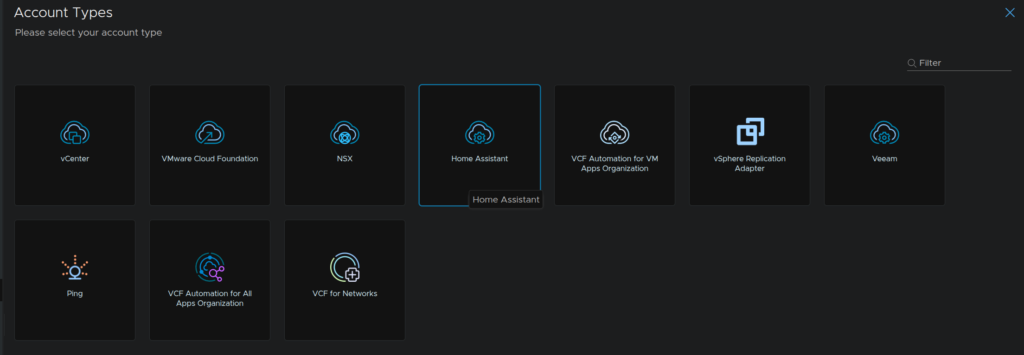
Select our new Home Assistant type
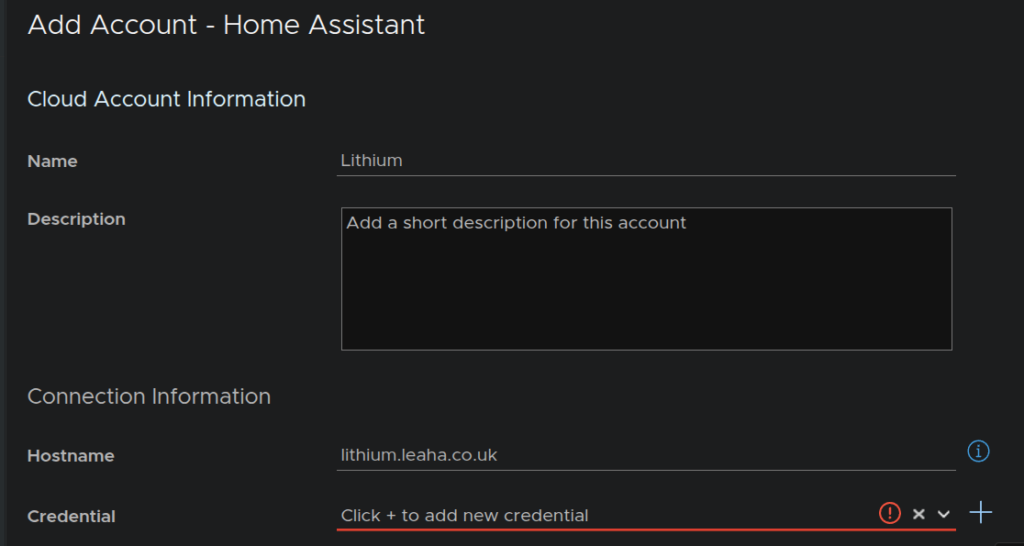
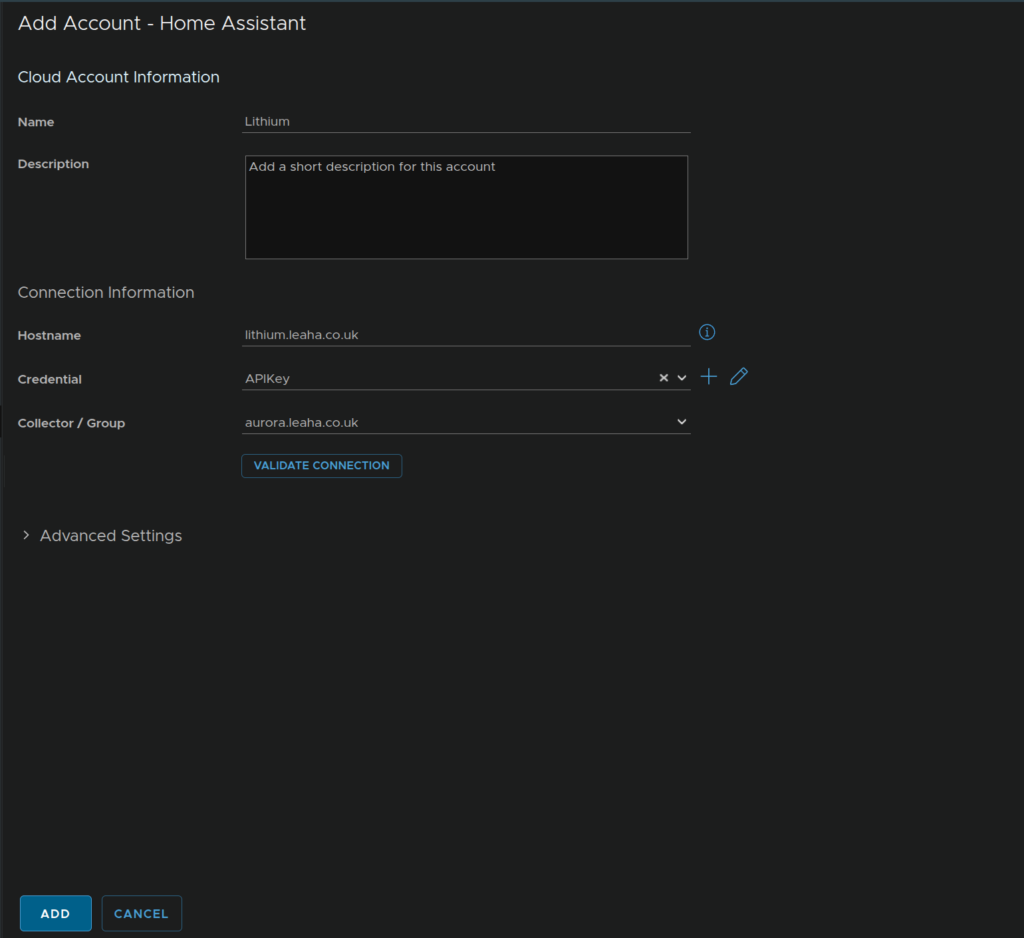
Give it a name, then enter the hostname of the Home Assistant server, and click the + to add your API key
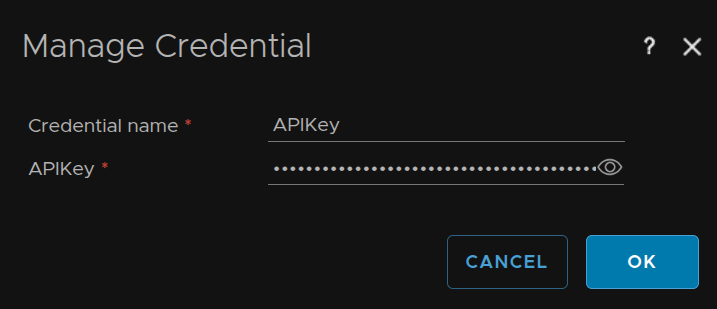
Name the credential and add the API key and click ok
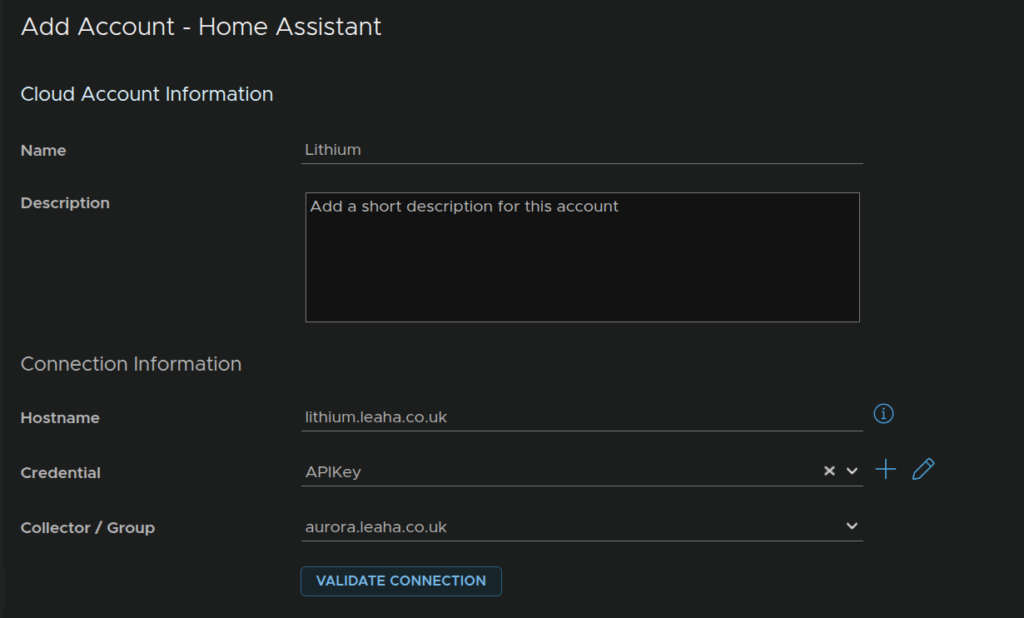
Select your collector from the drop down and click Validate Connection
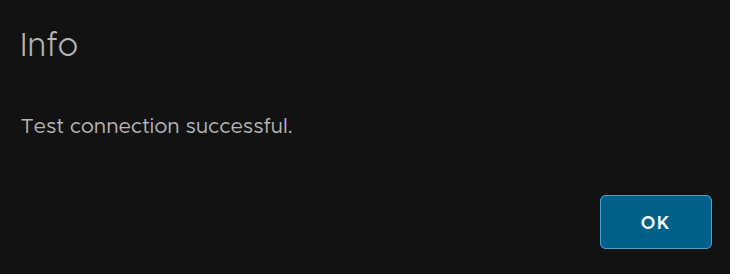
That should be successful, click ok
Then click Add at the bottom
2 – Dashboards
2.1 – Veeam Backup & Replication
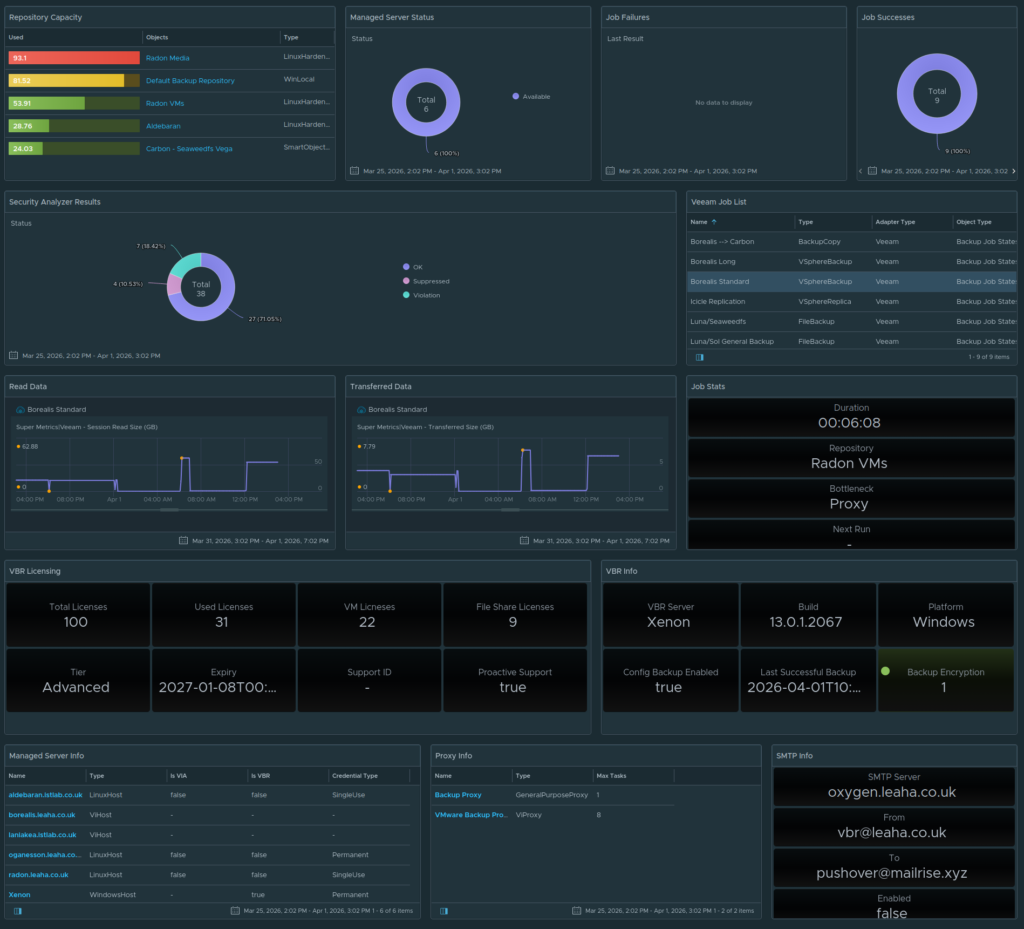
This dashboard does assume you have a single VBR instance, if you have multiple added some parts may show data differently, or need additional filtering
Here we will create the widgets to form this dashboard, the widgets are in no order, and can be re arranged in any way you like
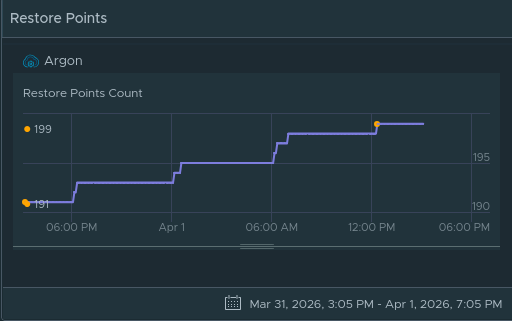
The other thing that will be created is a widget for my VM dashboard which shows the restore points of a selected VM, if its backed up by Veeam, if its not, its empty
2.1.1 – Creating The Dashboard And The Licensing Widget
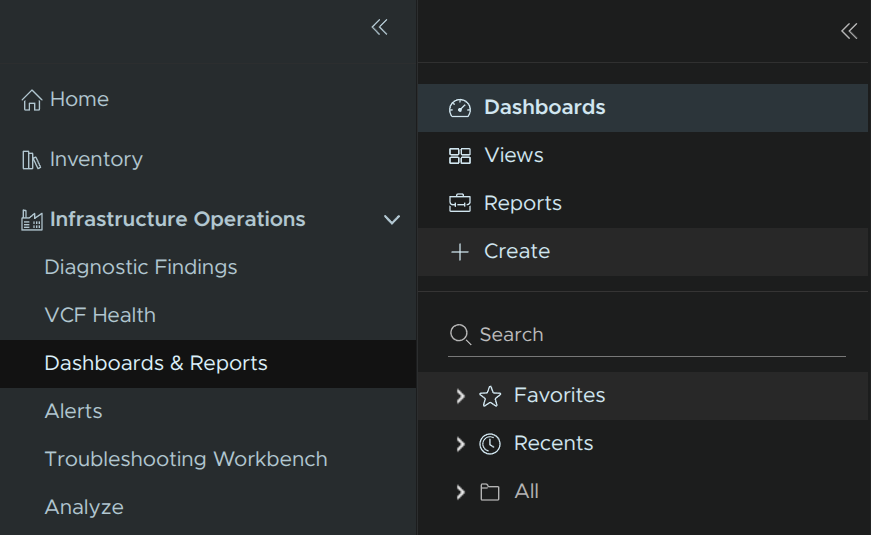
We first need to create a new dashboard, in VCF Operations click Infrastructure Operations then click Dashboards & Reports then click Create
Give it a Name and click Save

Then click Actions/Edit Dashboard

We now need to drag a Score Board onto the cavas
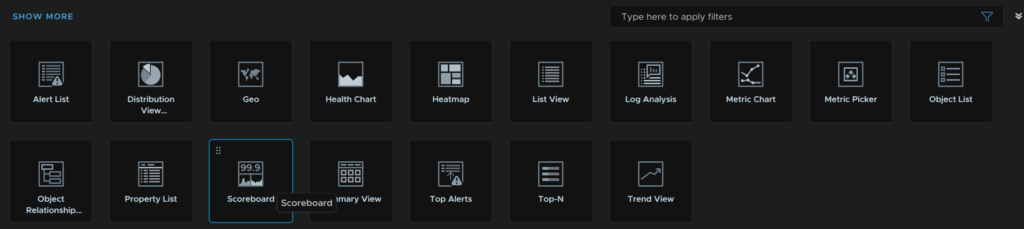
Click the pencil to edit it

Give it a name, then ensure Refresh Content and Self Provider are set to On, Box Columns is set to 4, visual theme you can change, I opted for Pastel
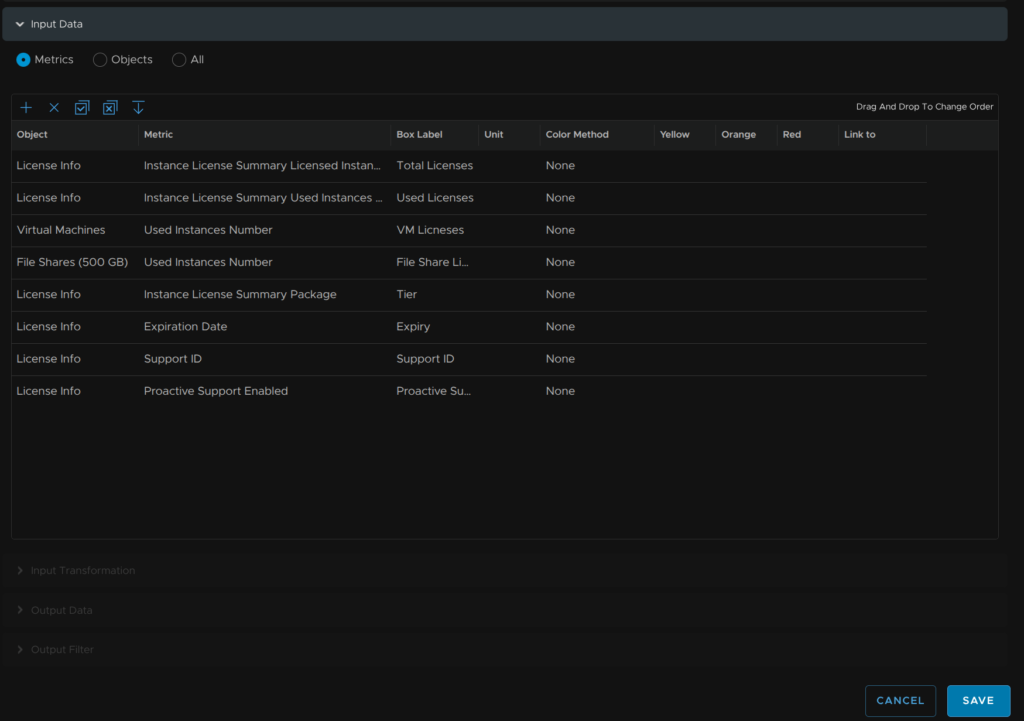
Then click Input Data at the bottom
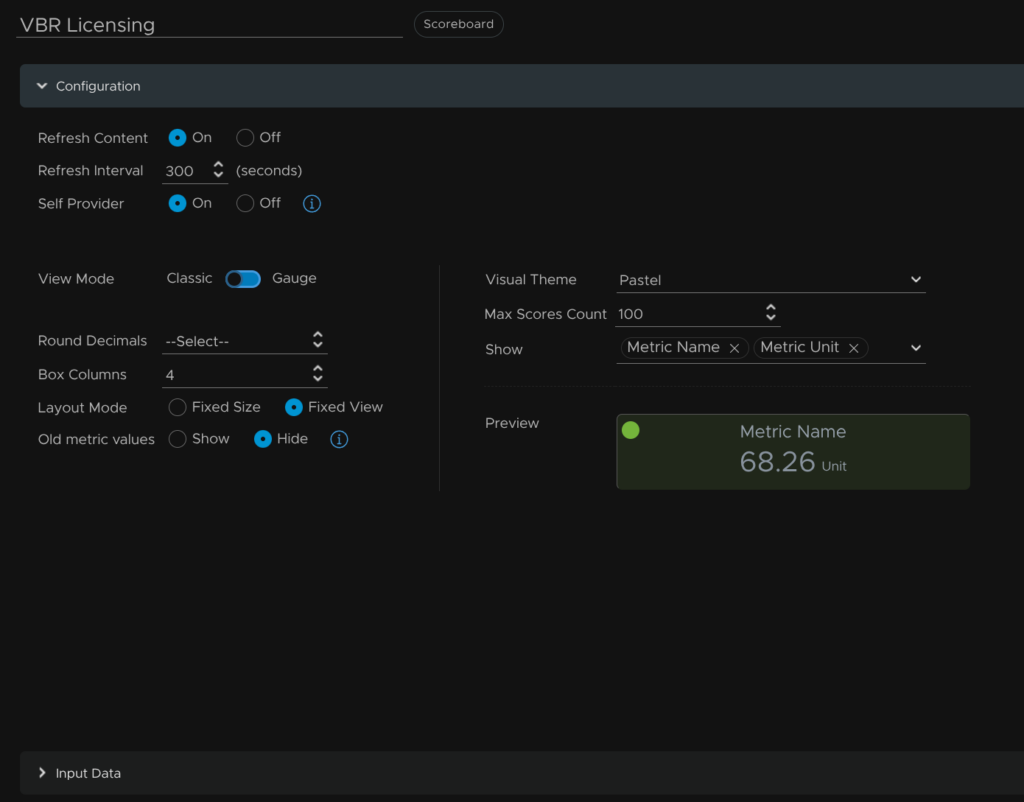
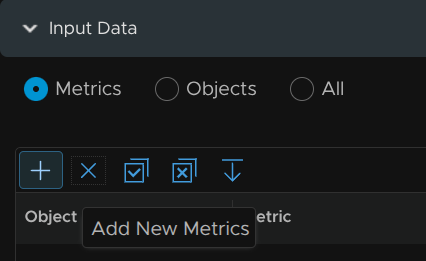
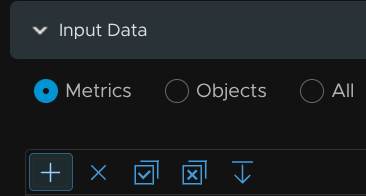
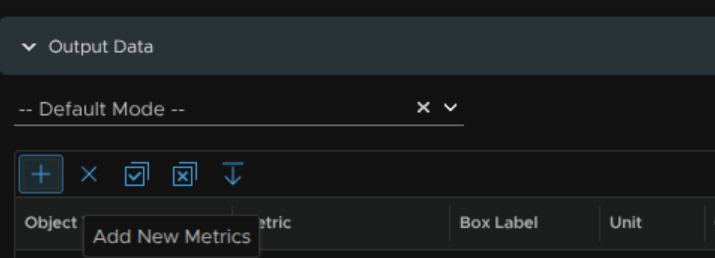
Click the + icon
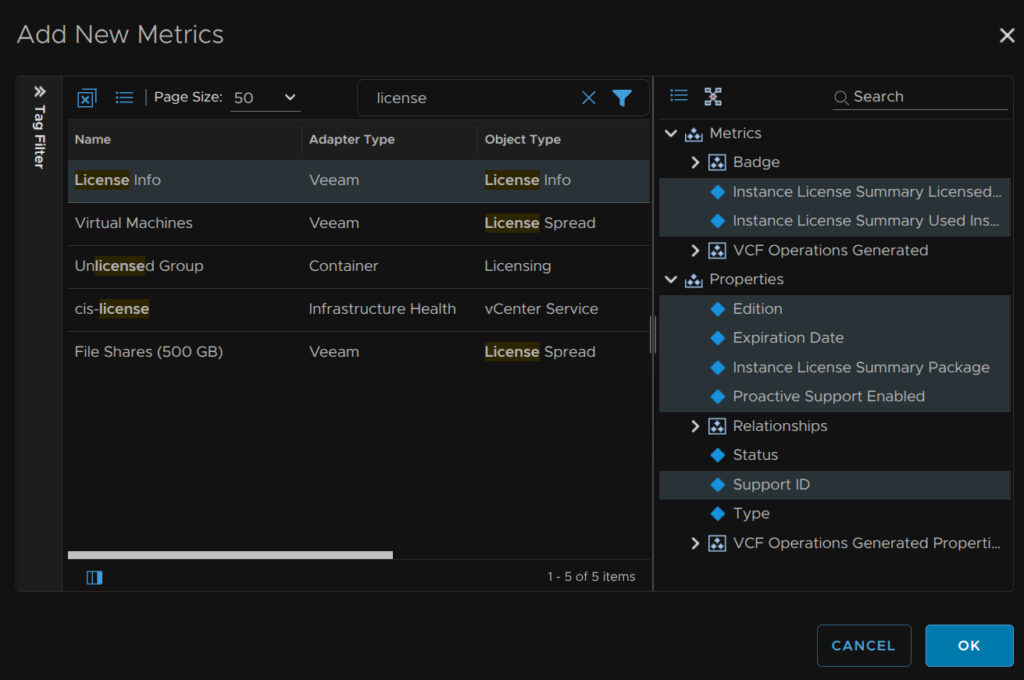
Search for License, and we should see the License Info name from the License Info Object Type, click that and expand Metrics and Properties and click all of the ones shown below
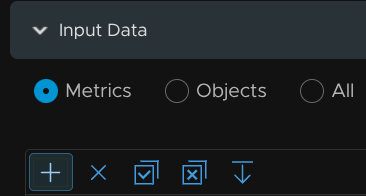
Click the Plus again
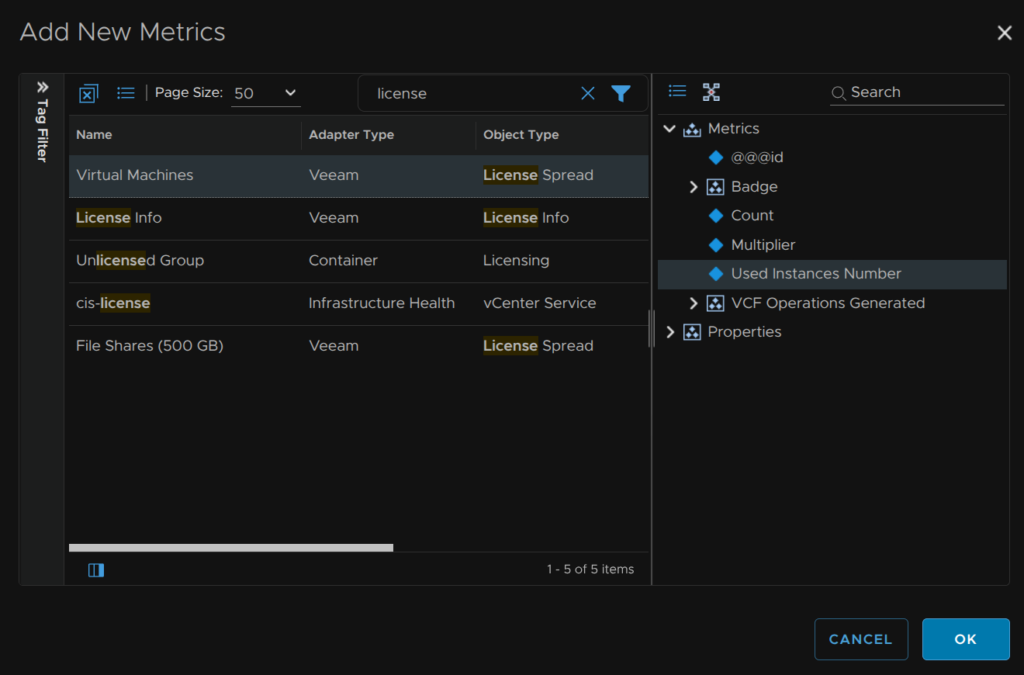
Then click Virtual Machines and click Metrics|Used Instance Number
And click the Plus one more time
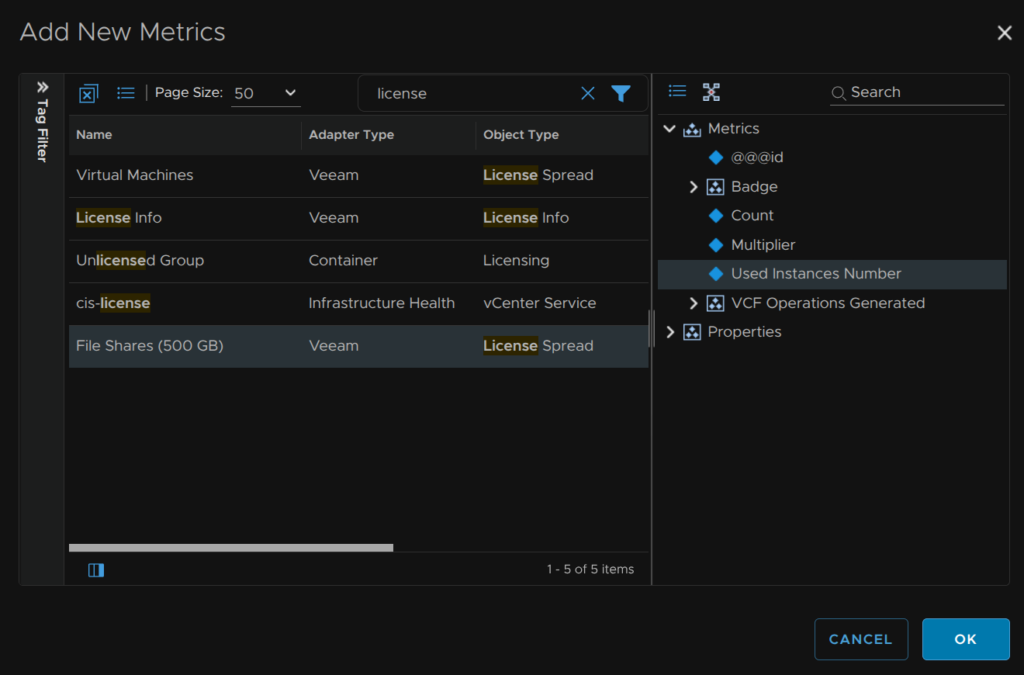
And repeat for File Shares, if you have those, then click ok
Double click the first object, give the Box Label a name, set the Color Method to None and click Update

Repeat for the rest, you can drag them into any order, when you are happy, click Save
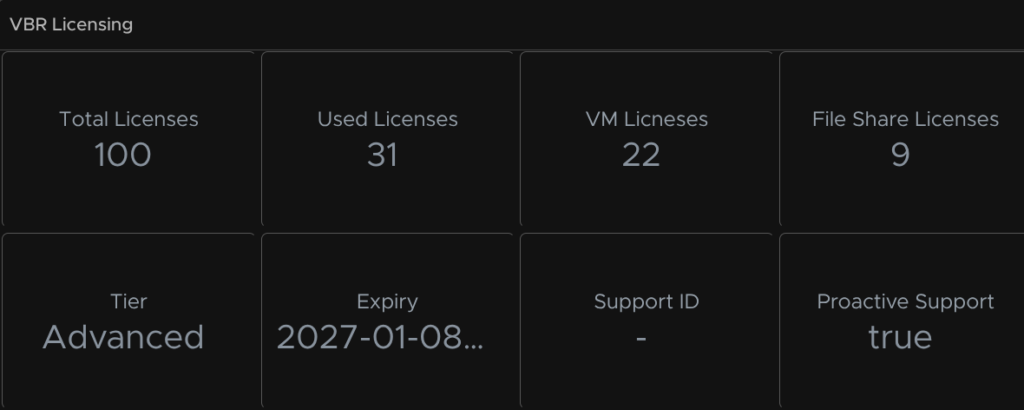
And when you are done you should get something like this
2.1.2 – Repository Capacity
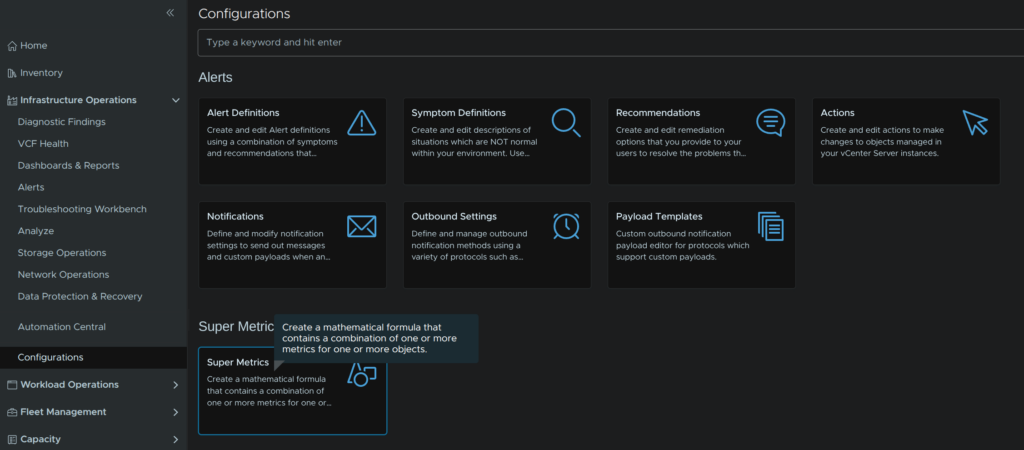
We first need a Super Metric, head to Infrastructure Operations/Configurations and click Super Metrics
Then click Add
Give it a name and click Next
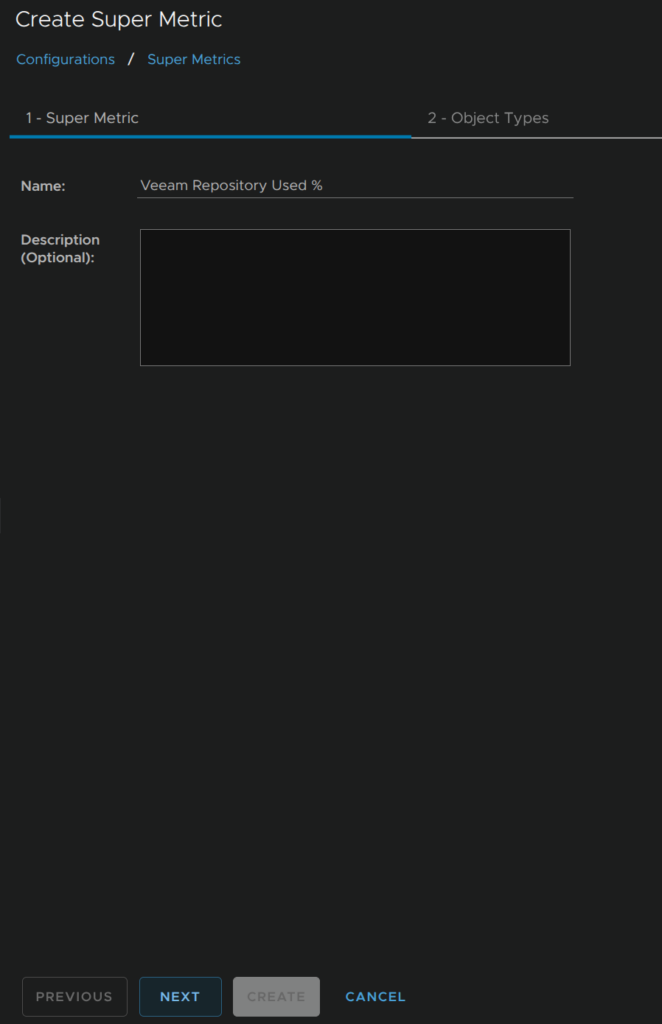
Search for repository states and click it
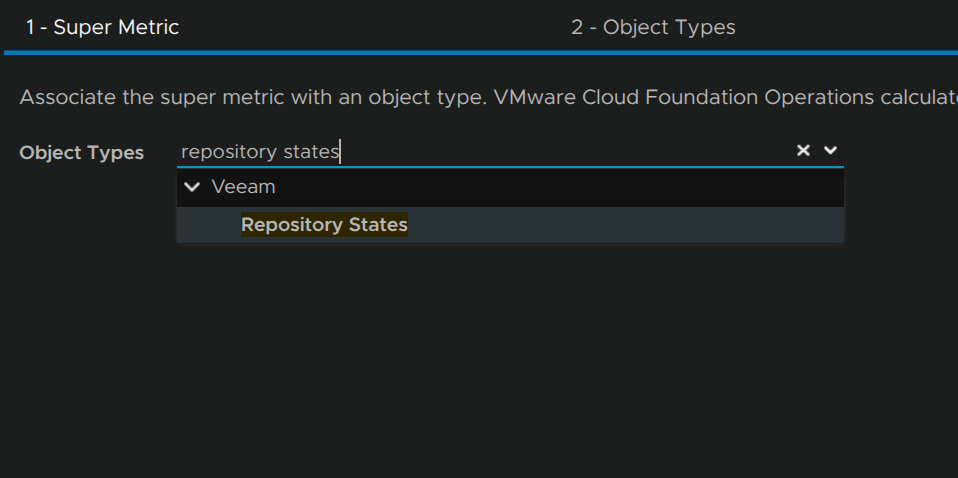
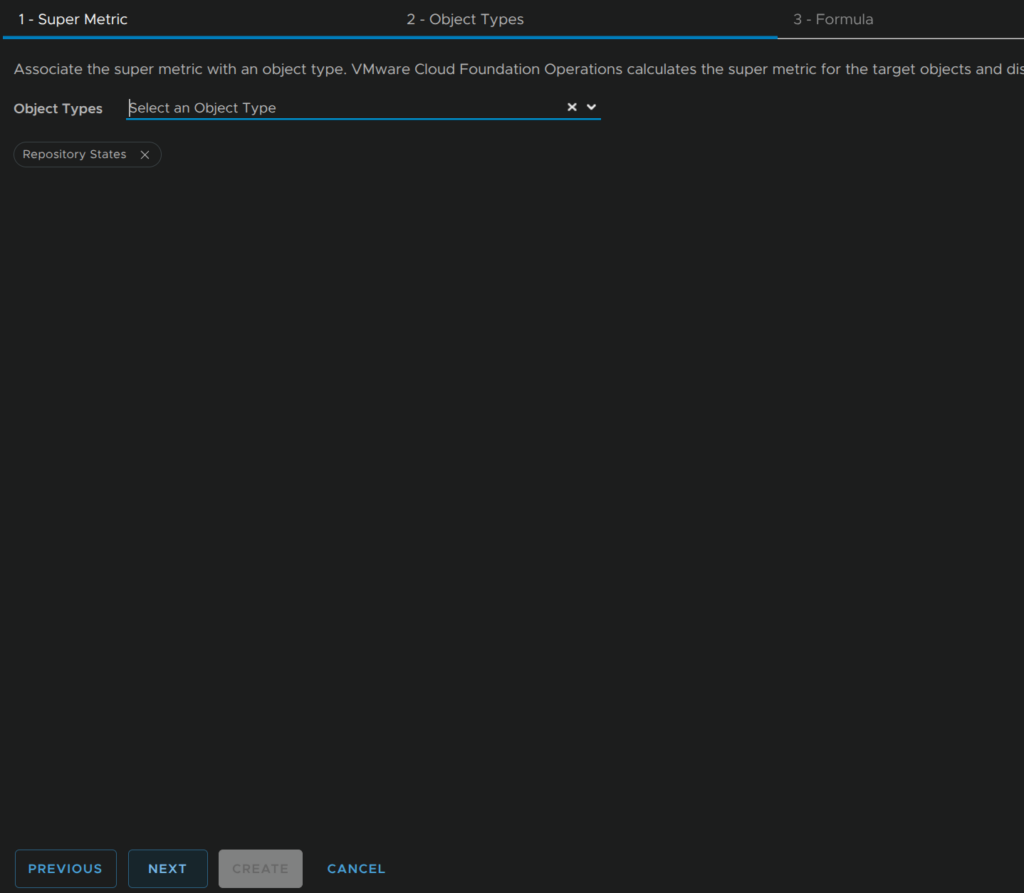
Then click Next
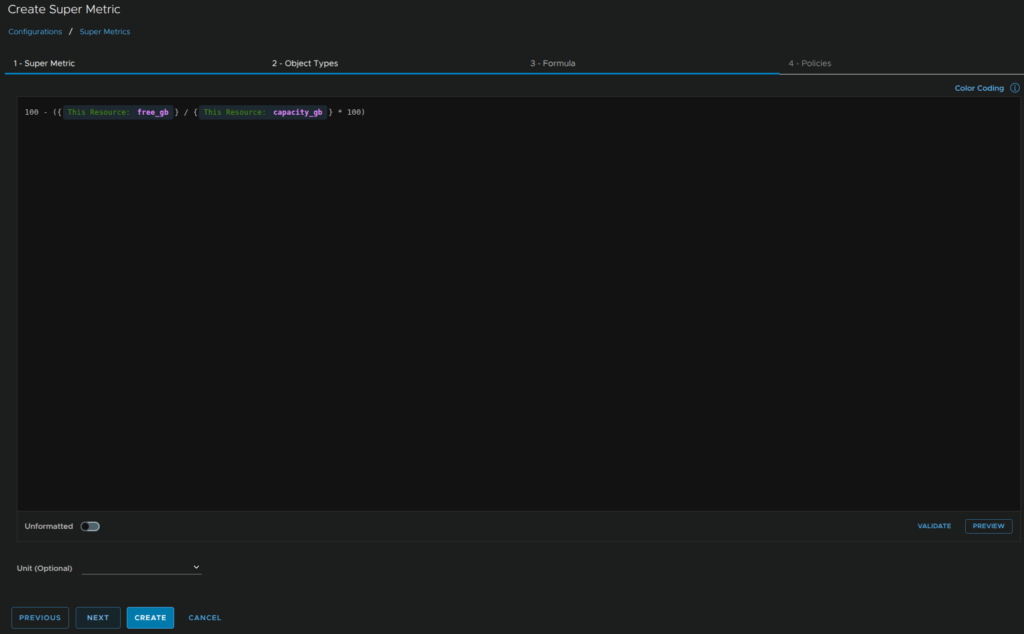
Now we need our formula, the Veeam API doesnt return a % free on the metric list, but we have the total capacity and the used capacity so we can calculate the used %
Make sure the toggle is set for unformatted text, then enter this in the box
100 - (${this, metric=free_gb} / ${this, metric=capacity_gb} * 100) 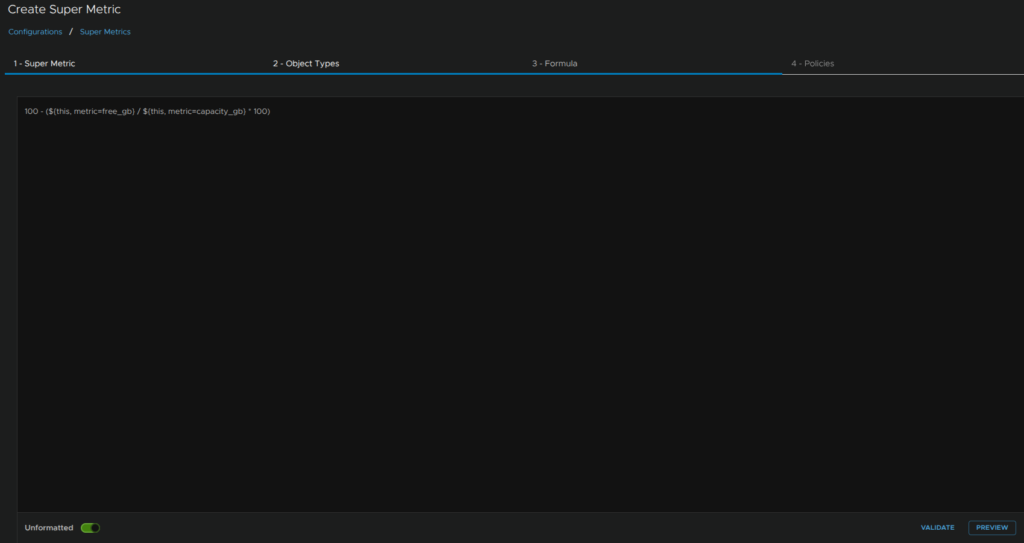
Then click the unformatted toggle to reformat it, we can also click Preview to see what it will look like if you need, then add the % unit at the bottom, when you are happy, click Next
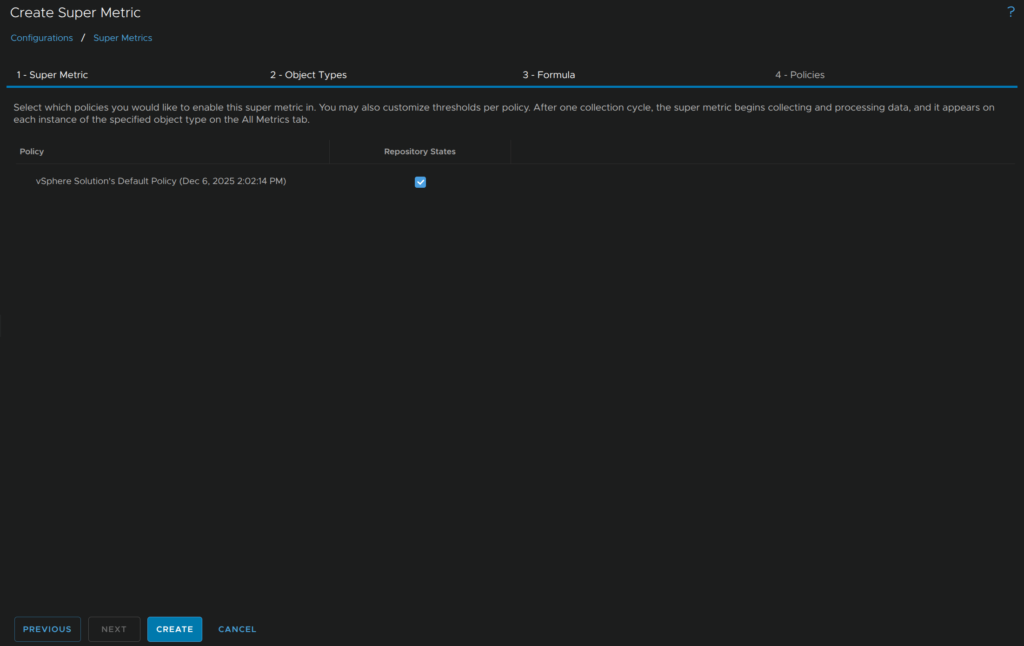
Select the default policy, if you miss this, the super metric wont be created
And click Create
This metric will take 5-10 mins to show through when creating the dashboard
We can then head back to our Dashboard editing
For a nice widget for our repository free capacity, drag a Top-N onto the canvas
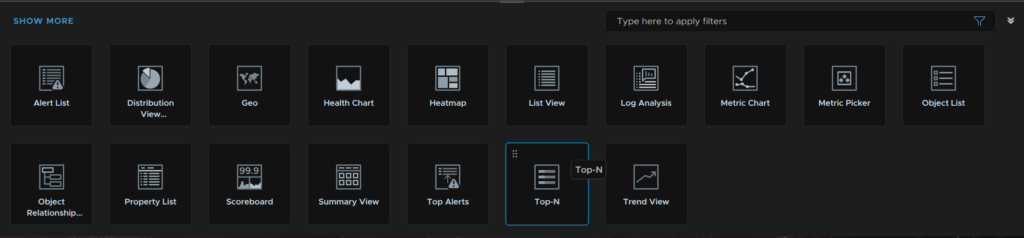
Click the pencil to edit it

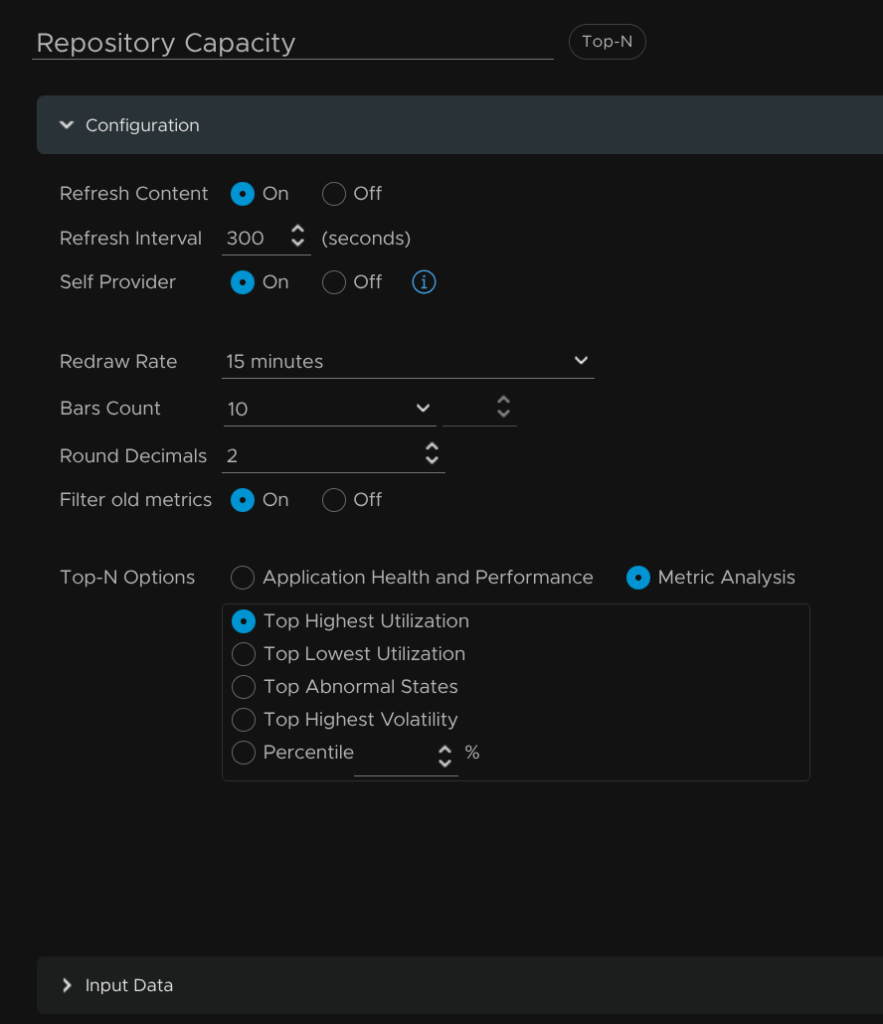
Give it a name, set Refresh Content and Self provider to On, then set the Bars Count to 10 or 15, Round Decimals to 2, Filter Old Metrics to On, the Top-N Options should Metric Analysis and select Top Highest Utilization
Then click Input Data
Make sure this is set to all and click Output Data
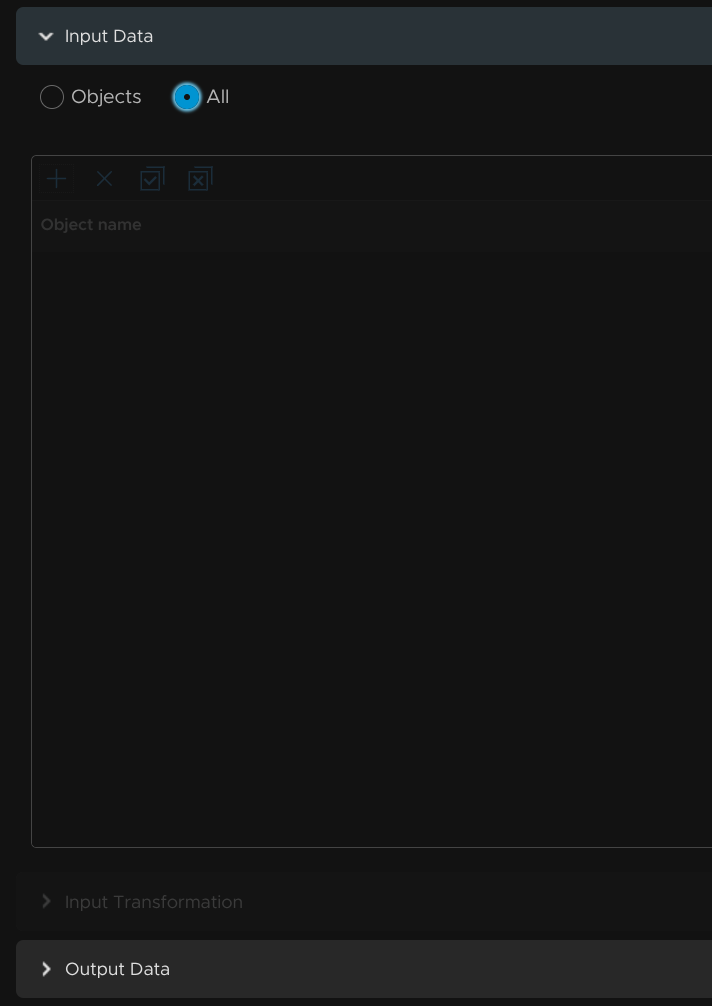
Click the +
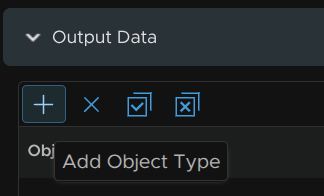
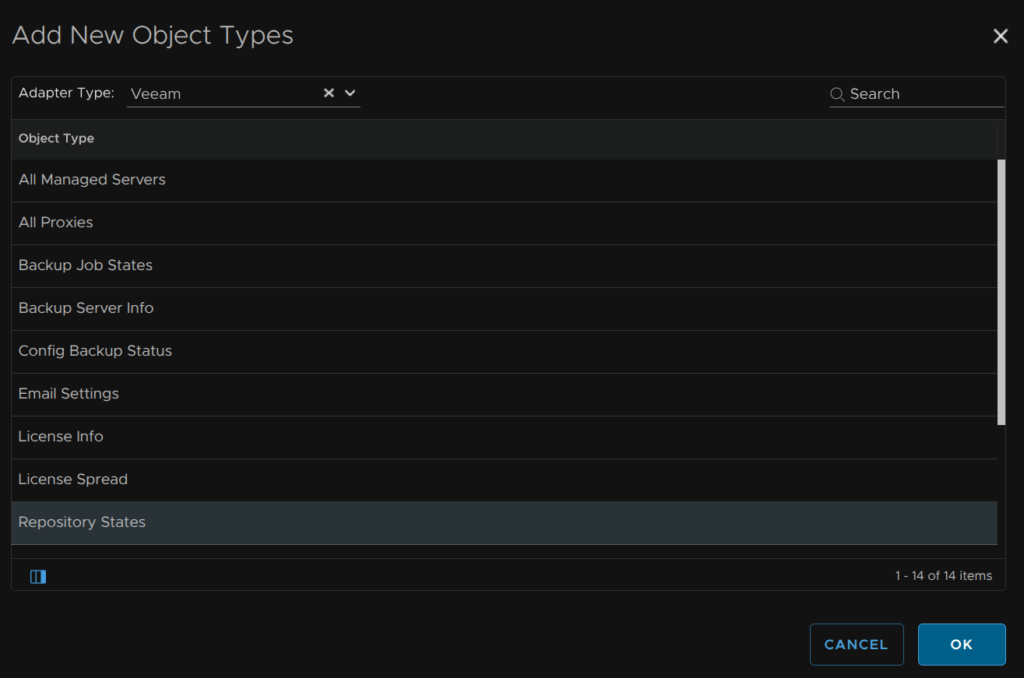
Use the drop down to set our adapter to the Veeam adapter then click the Repository States object and click ok
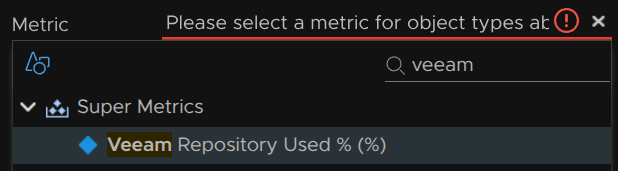
Then we need to select our metric, find and double click our new super metric
If its not there, give it 10-15 mins, the metric needs to be populated on a data collection cycle
Add a label, ensure the unit is %, and add a custom Color Method, I went for 80/88/92% for my thresholds but you can change this, then click Additional Columns
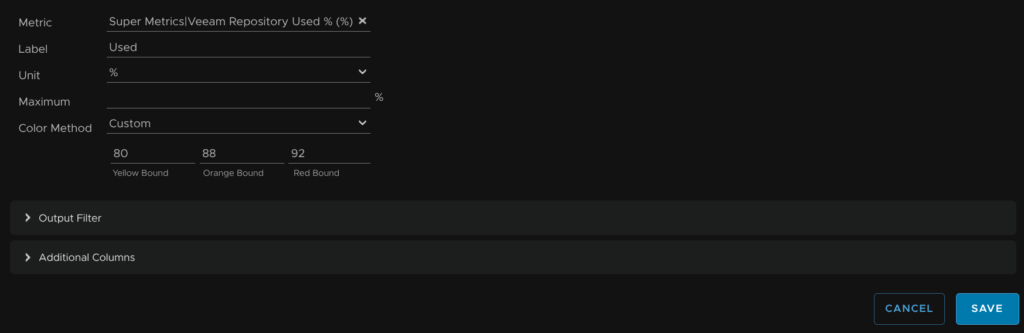
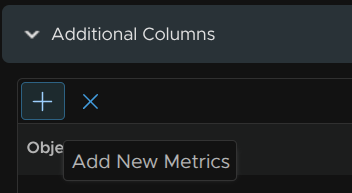
Click the +
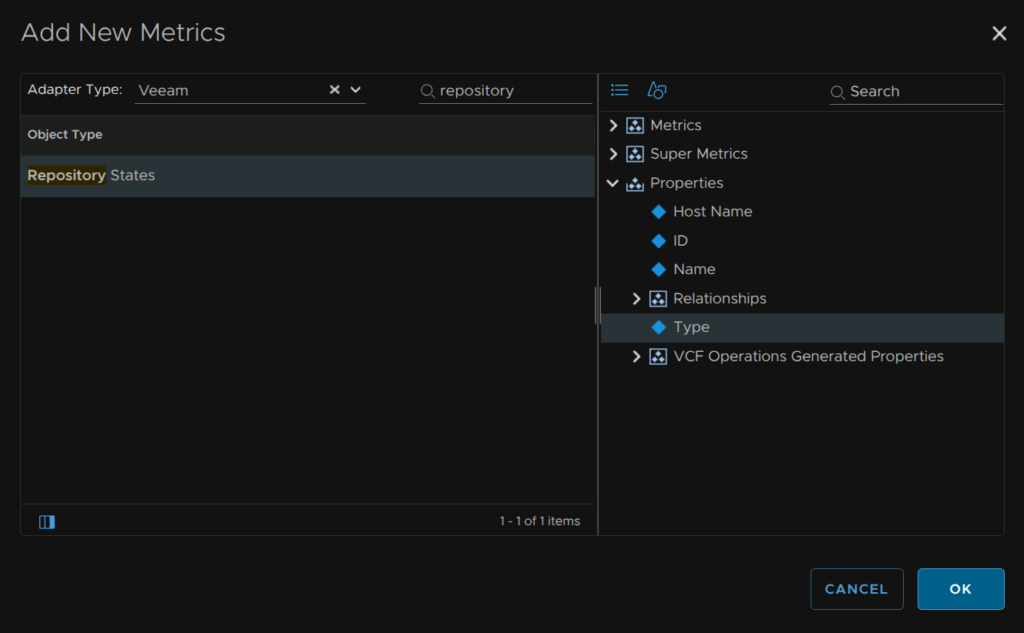
Use the adapter drop down to select our Veeam adapter, then search for and click Repository States, on the right, expand properties and click Type, then click ok
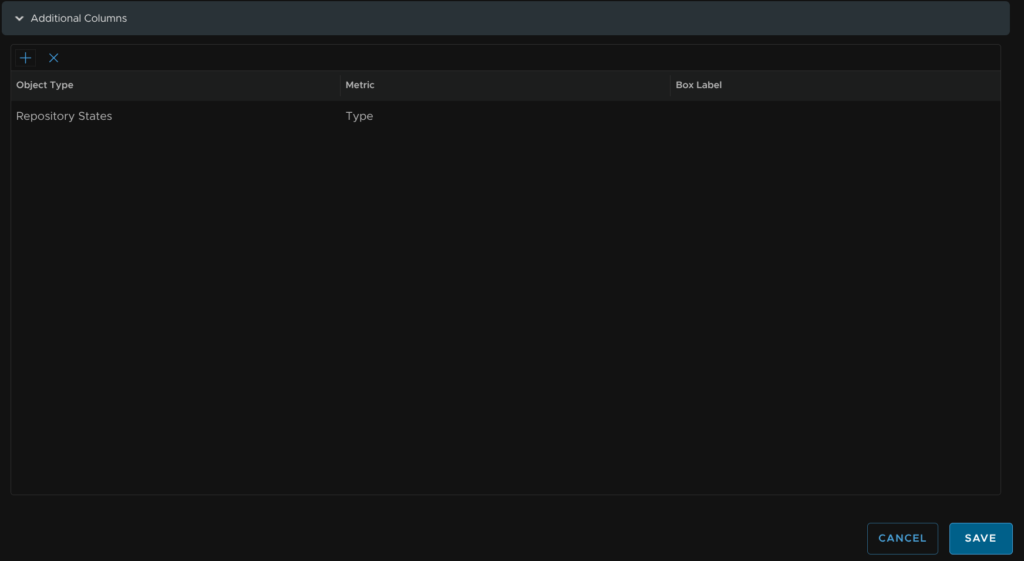
Now click Save
When you are done, you will end up with a widget like this
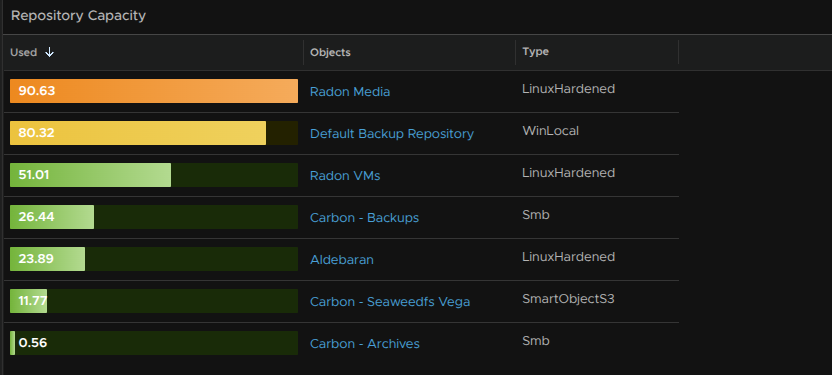
2.1.3 – VBR Info
Drag a scoreboard onto the canvas
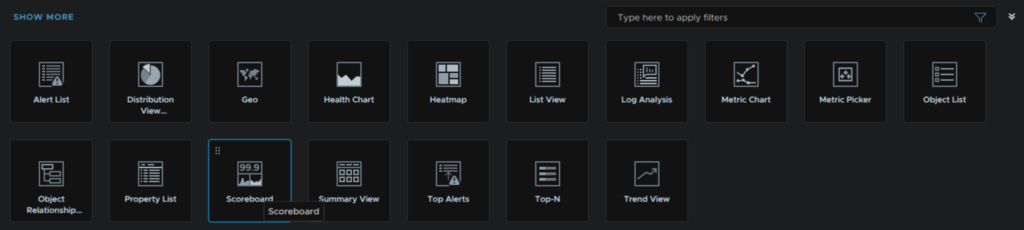
Click the pencil to edit it
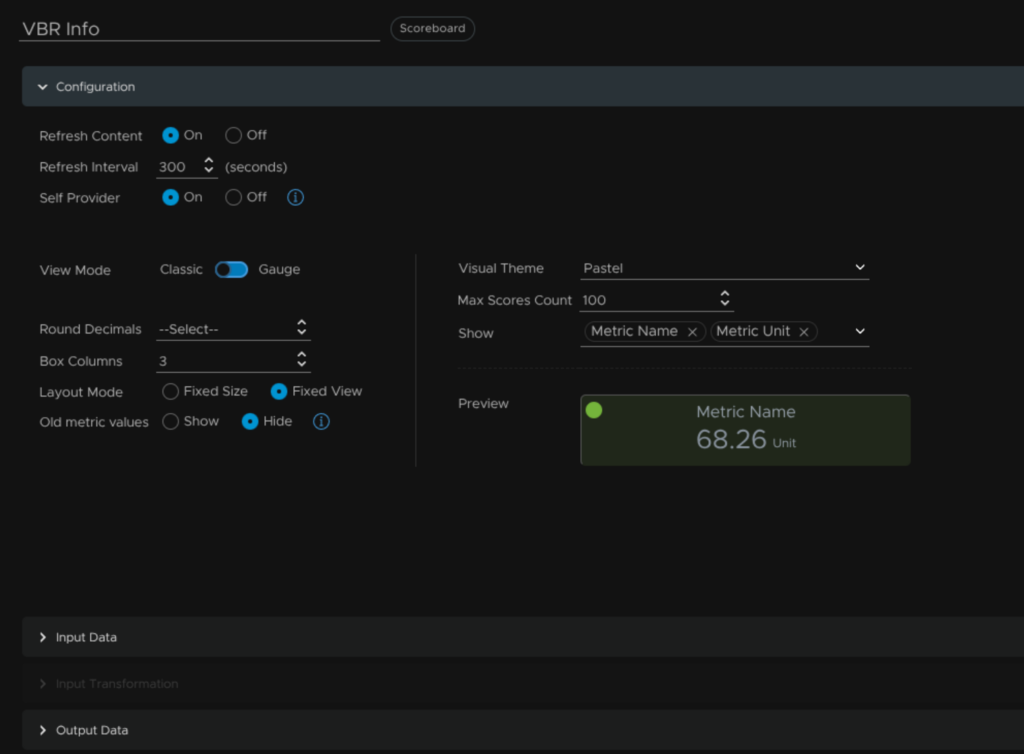
Give it a name, then set the following
- Refresh Content to On
- Self Provider to On
- Box Columns to 3
- Visual Theme to Pastel
Then click Output Data
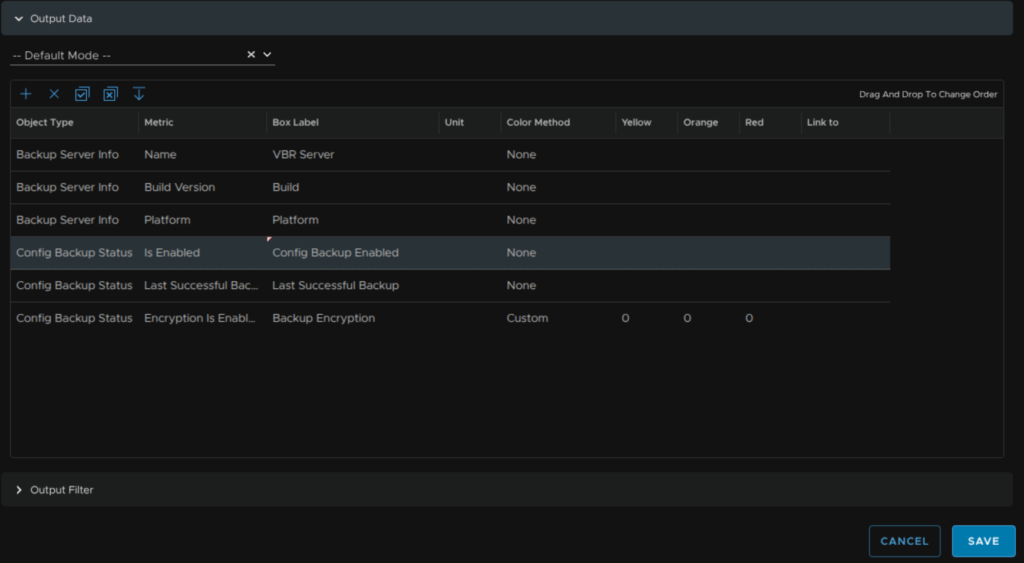
Click the +
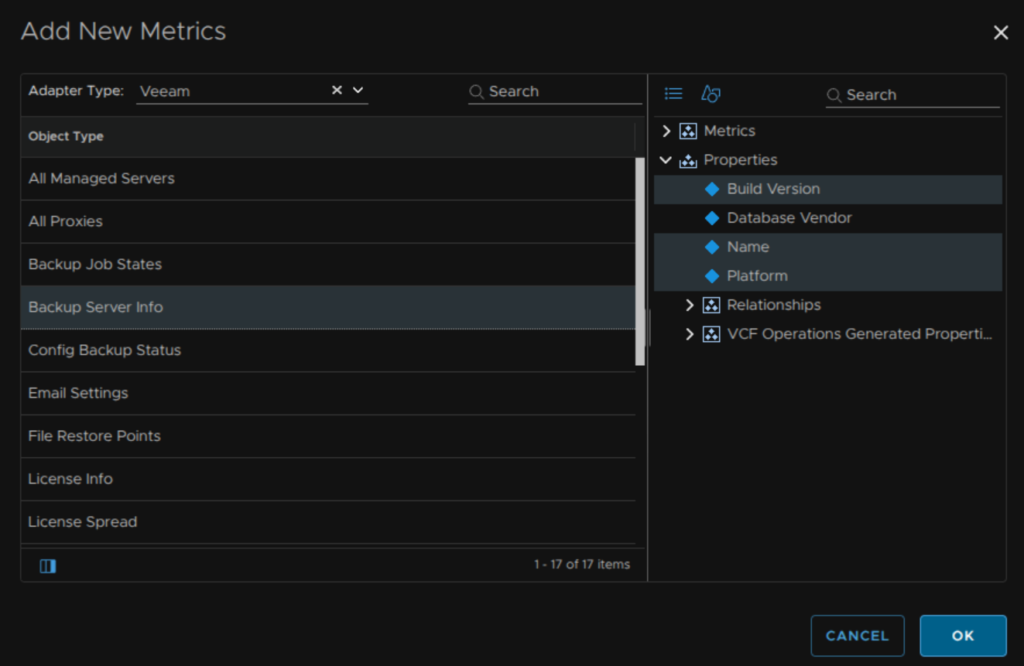
Change the Adapter Type to Veeam and click Backup Server Info, then click properties/Build Version, Name and Platform, then click ok
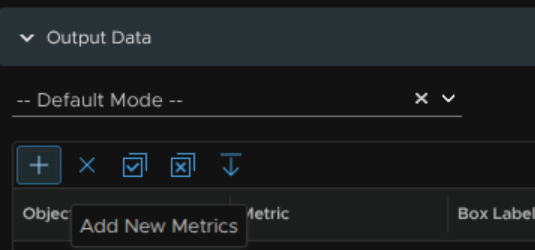
Click the + again
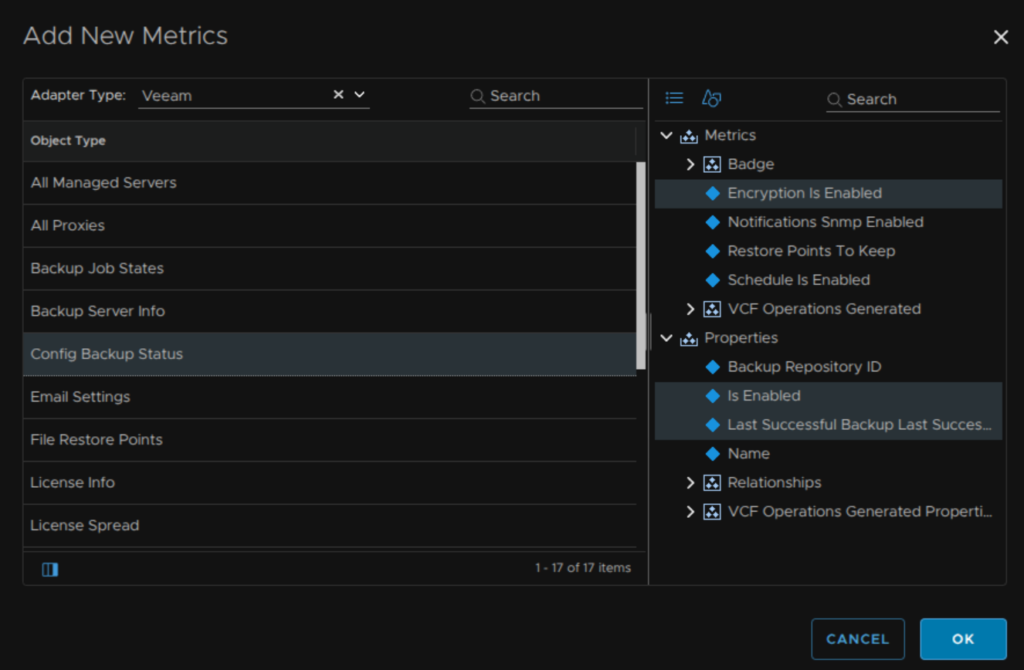
Set the Adapter Type to Veeam like before, then click Config Backup Status, then click Metrics/Encryption Is Enabled, Properties/ Is Enabled and Last Successful Backup Last Successful Time, then click ok
We can double click an object under the Box label to edit its display name and colour method, when its set, click Update

You can also drag them around to change the order, this is what I ended up with, when you are happy click Save
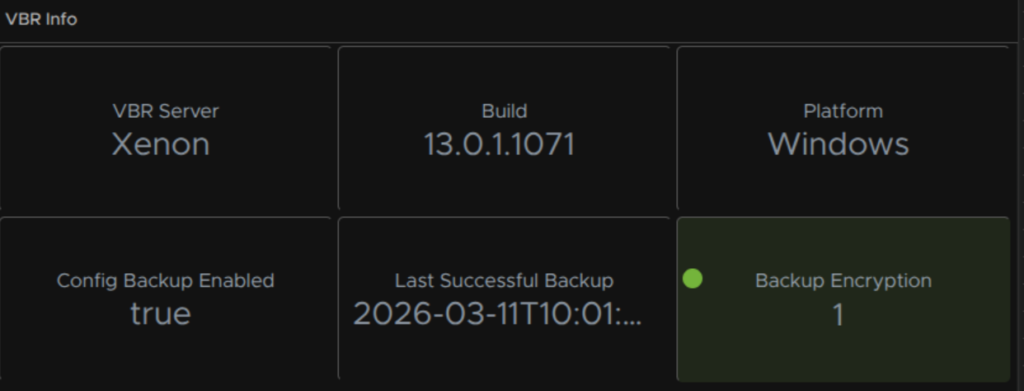
And you should end up with something that looks a little like this
2.1.4 – Security Analyzer Results
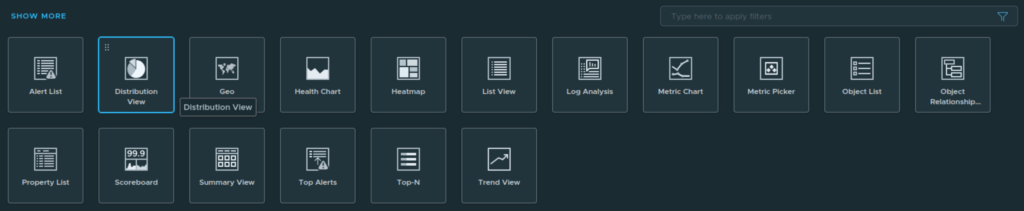
Drag a Distribution View onto the canvas
Then click the Pencil
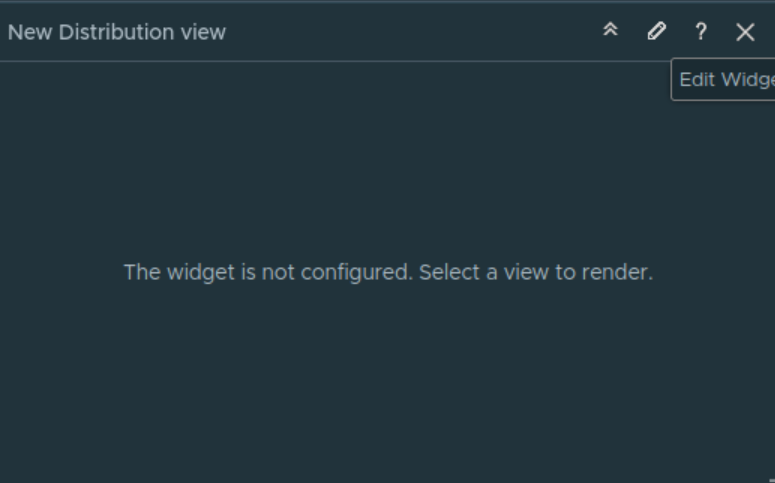
Give it a name and set Refresh Content and Self Provider to On, then click Input Data
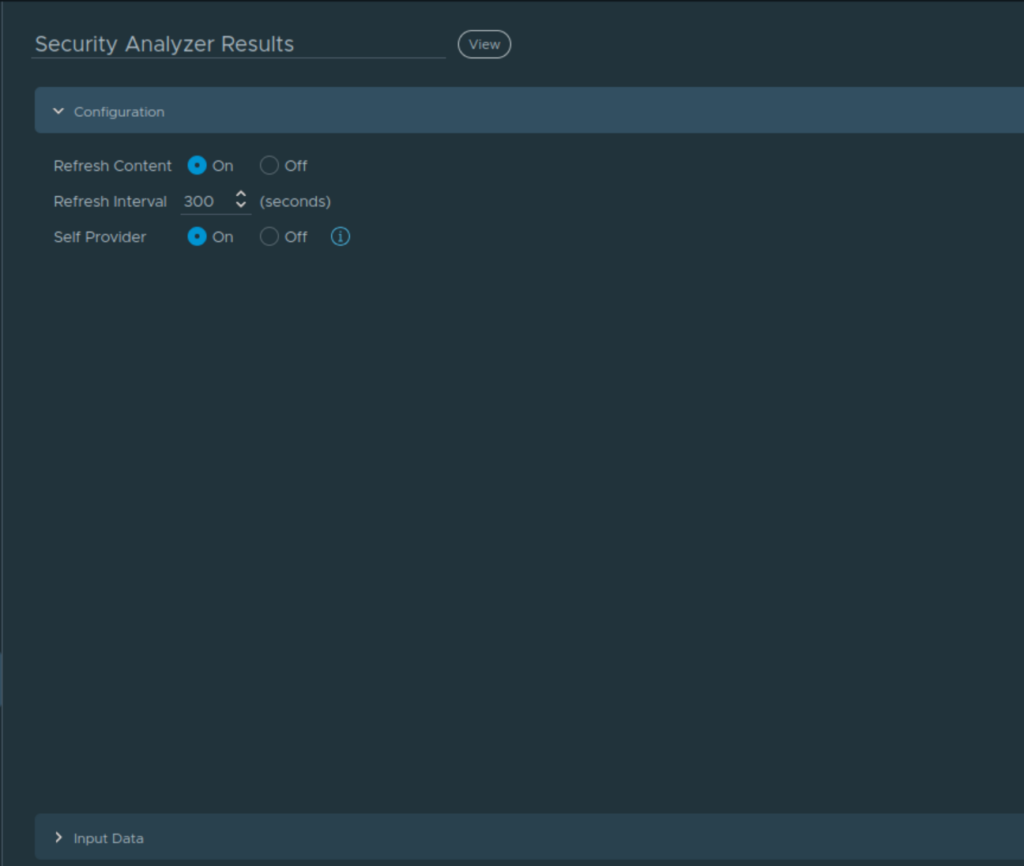
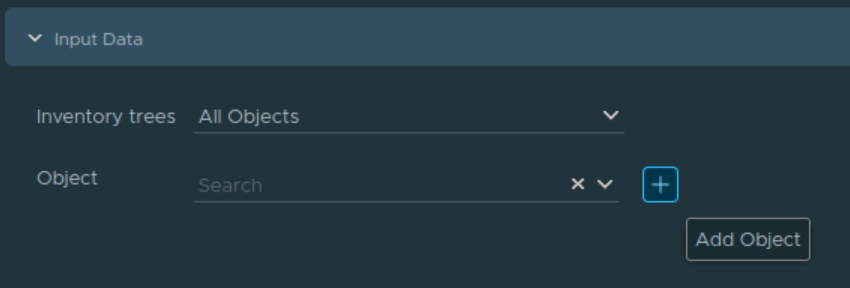
Click the +
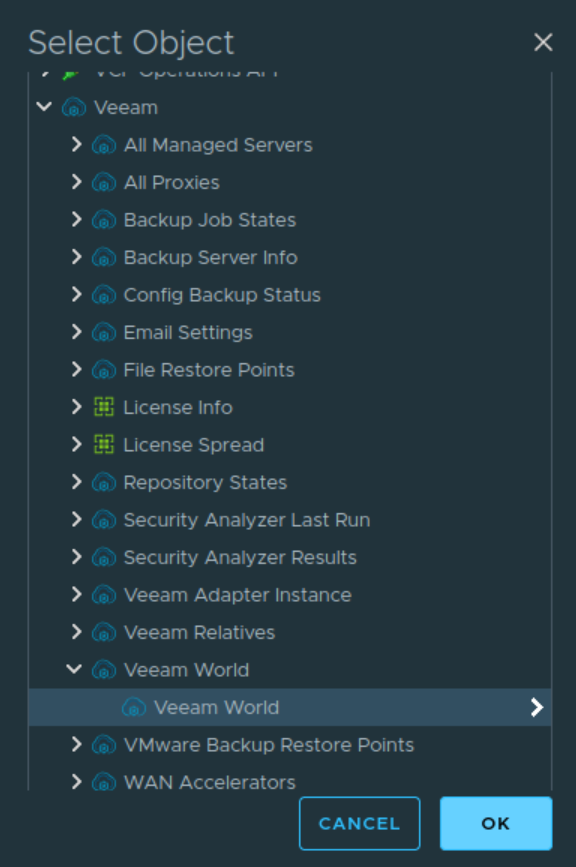
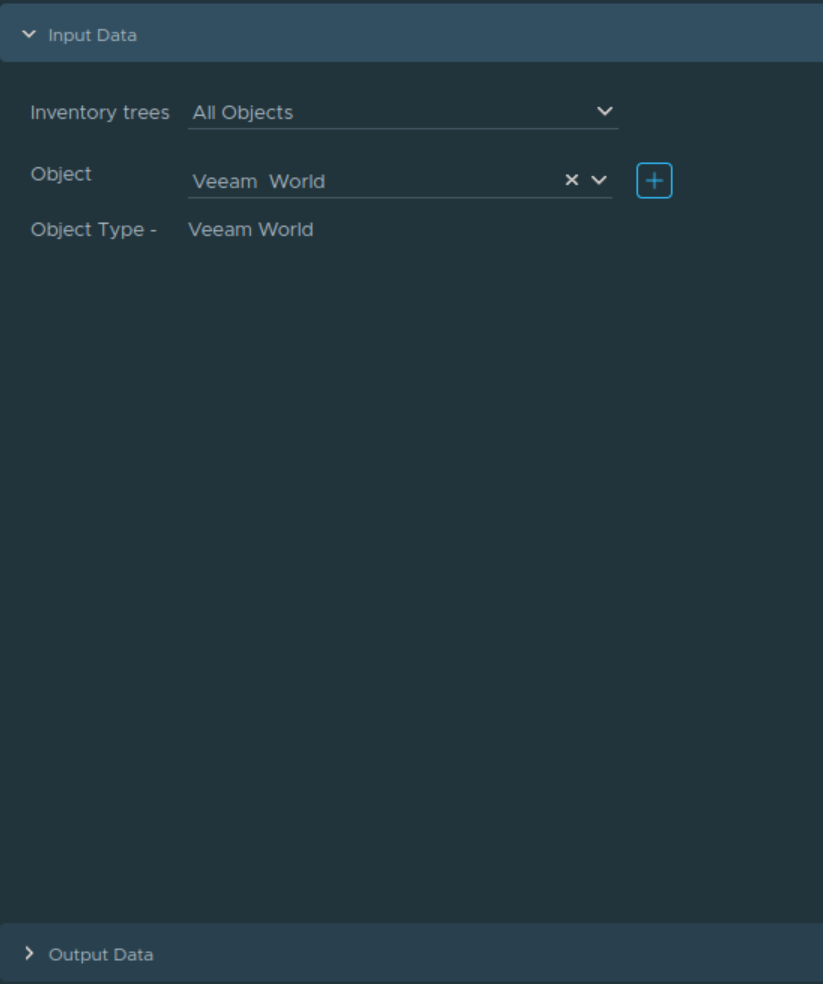
Expand Veeam/Veeam World and click Veeam World then click ok
Then click Output Data
Click the + to create a new View
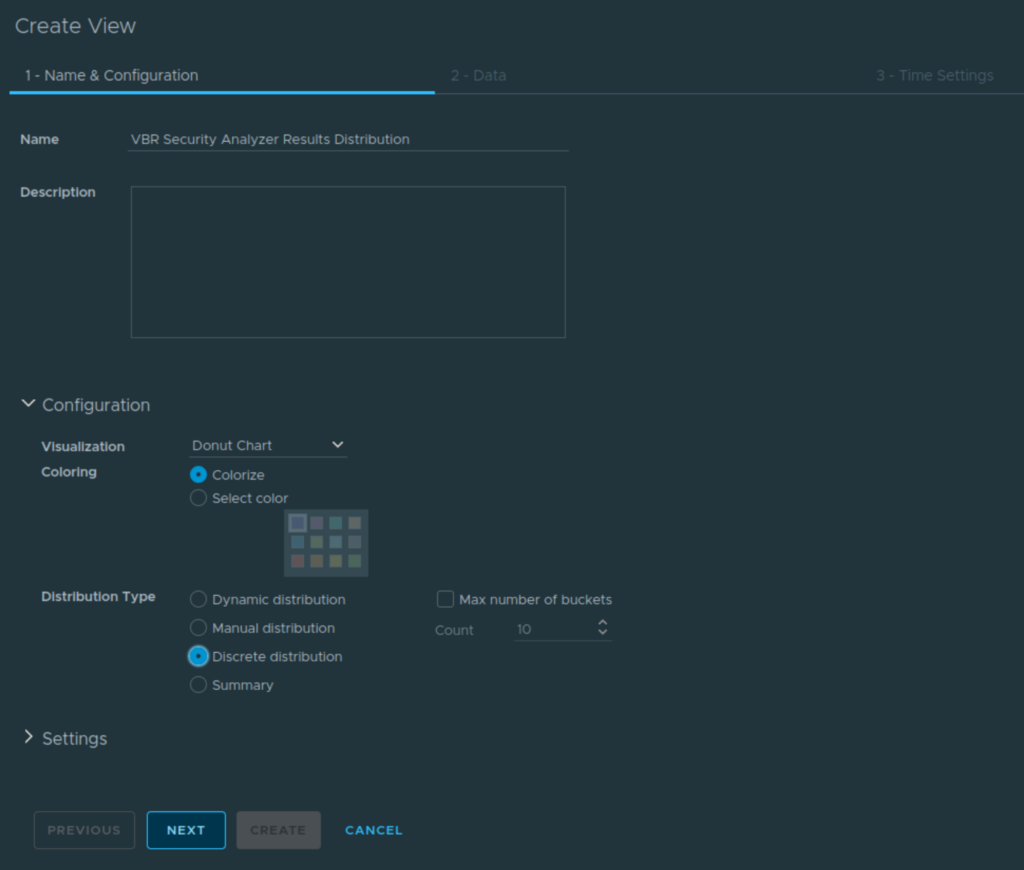
Give it a name, set the visualization to Donut Chart, set the Distribution Type to Discrete Distribution and click Next
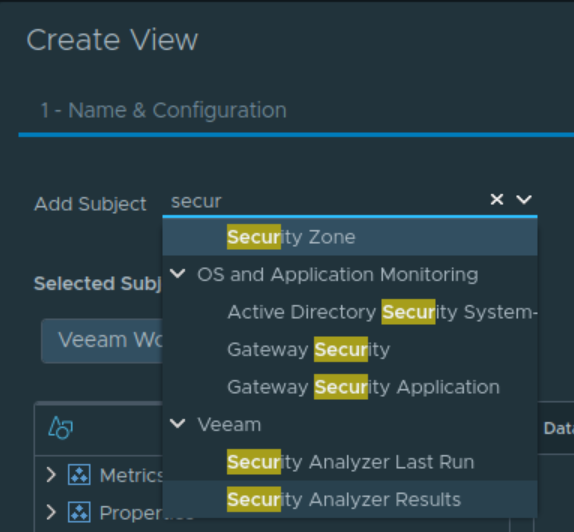
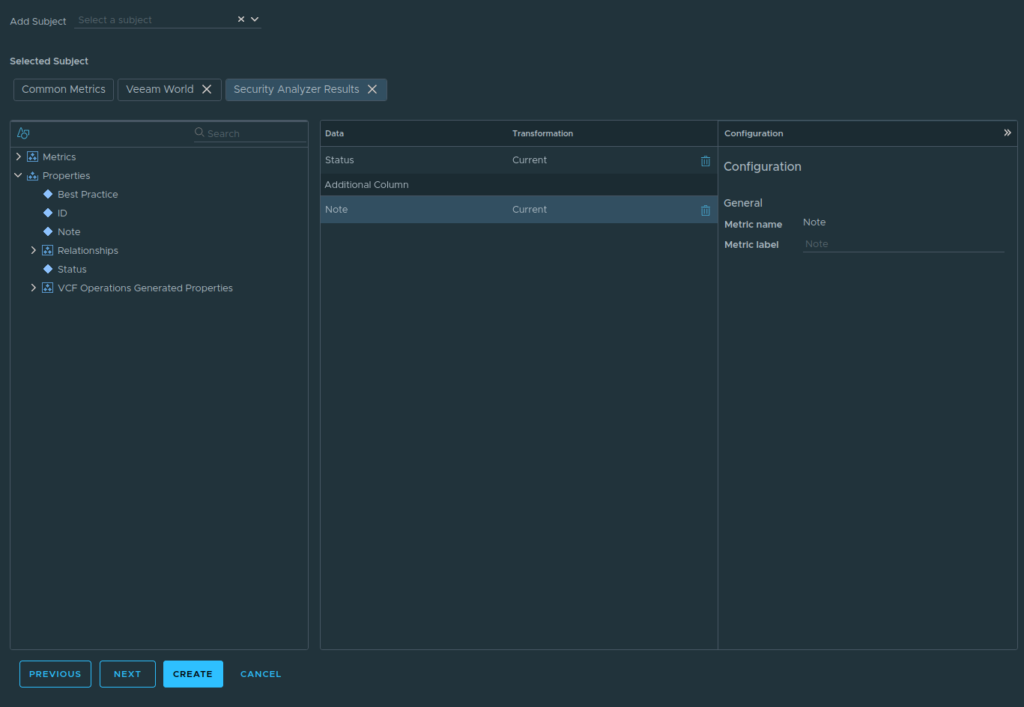
For the Subject, search for and add, Veeam/Security Analyzer Results
Click Security Analyzer Results on the Selected Subject, then drag Properties/Status over to the middle section like so and select the Preview Source as Veeam World, we should see the chart populate
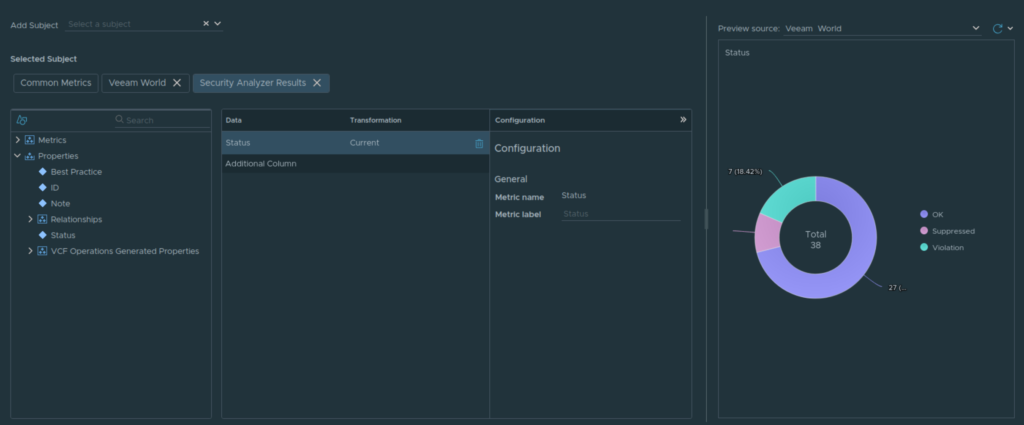
Now also drag over Note then click Create
Then hit Save
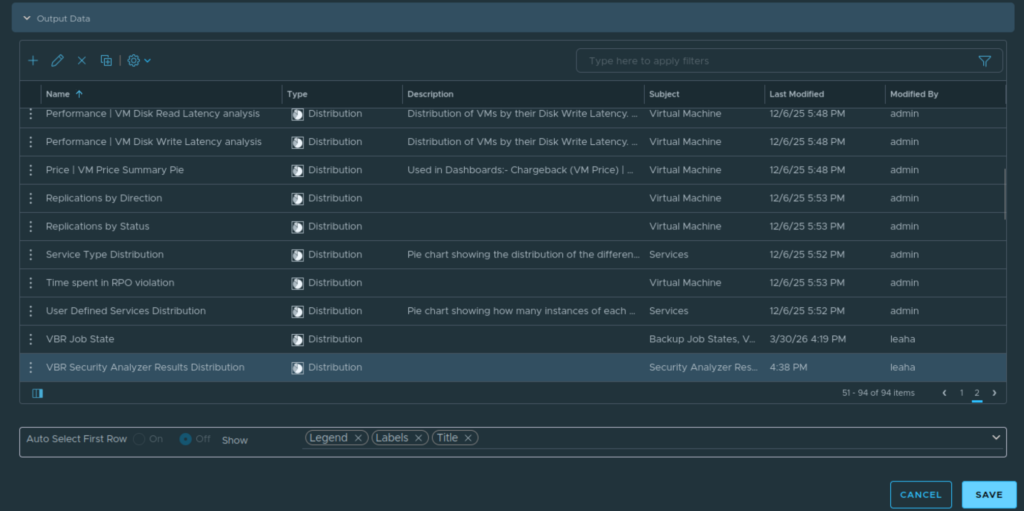
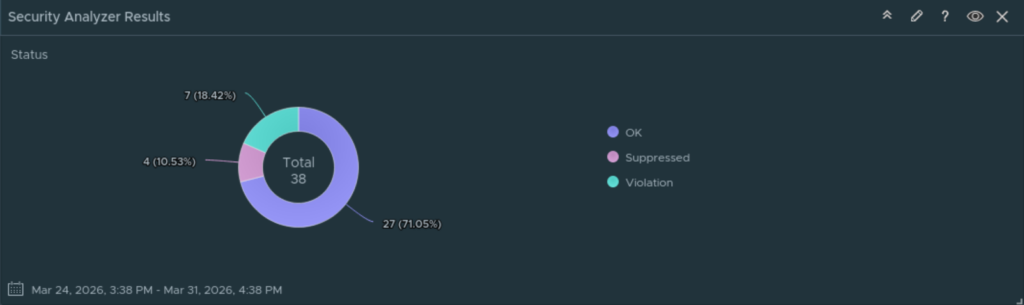
The widget will then look like this
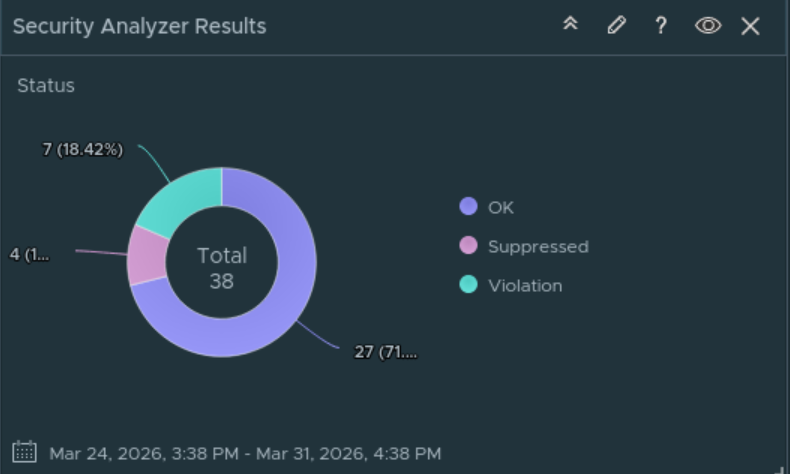
If you click any section of the donut, we get extra information about the status, and here we can see the best practice and note, as part of the additional information we added, I made the widget longer and made the details box on the right take up about two thirds, when its done you’ll get something like this
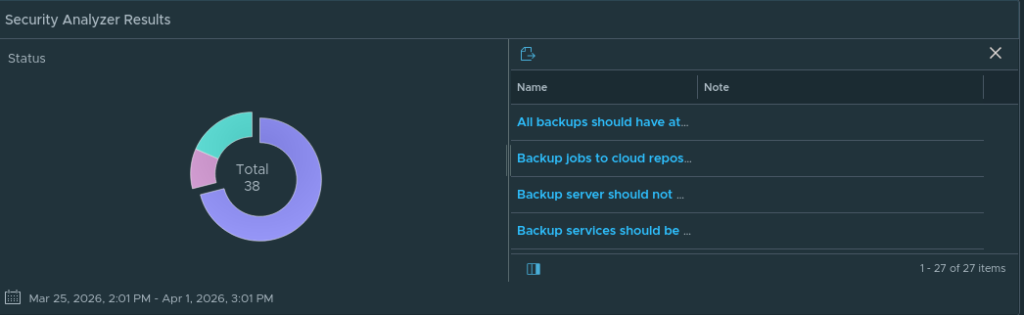
And if we need to close the extra information, we get this
2.1.5 – Job Results
For this widget we will be configuring a pair, ideally I wanted a bar chart of the last 7 days with the number of failures and successes like in Veeam ONE, you can also configure that in Grafana so its a shame I couldnt find a way to do this in VCF Operations
This will have two widgets, failures in red, nice and clear so you can see if anything needs immediate attention, and another for successes in green
Drag a Distribution View onto the canvas

Click on the pencil to edit the widget
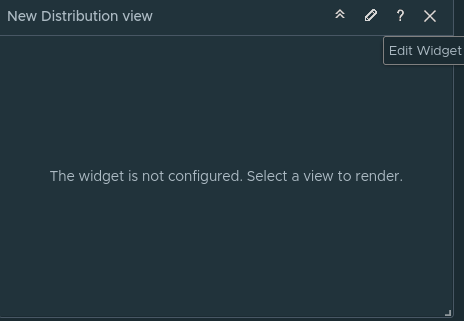
Give it a name, set Refresh Content to On and Self Provider to On and click Input Data
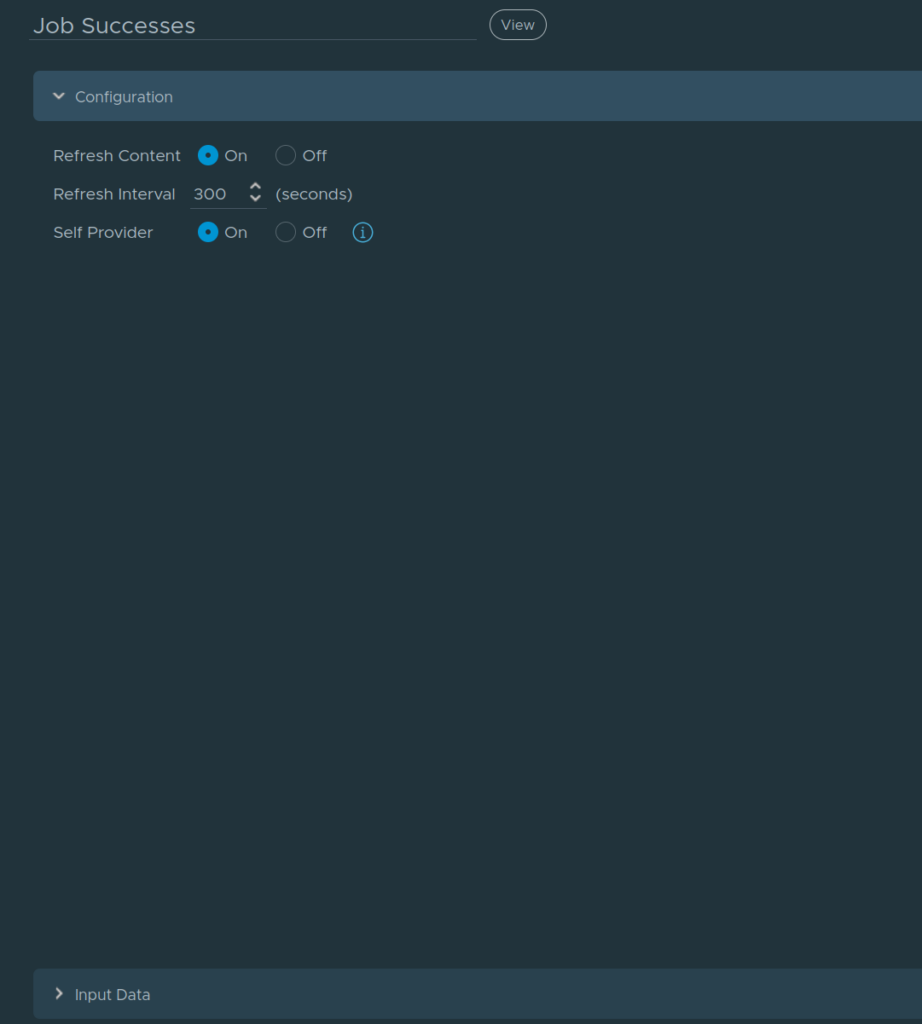
Click the +
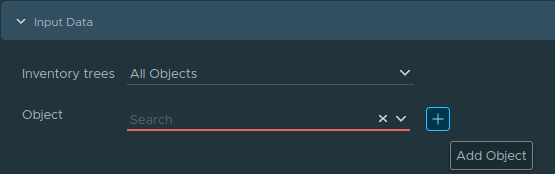
Click Veeam/Veeam World and click ok
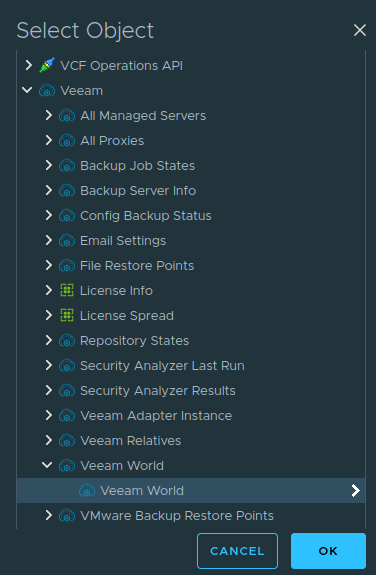
Then click Output Data
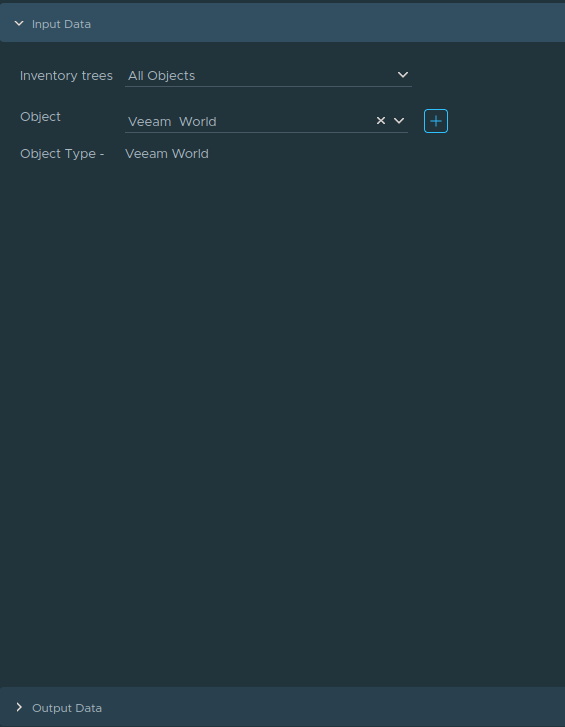
Click the +
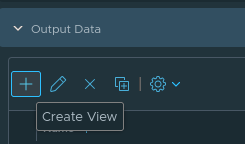
Click Distribution
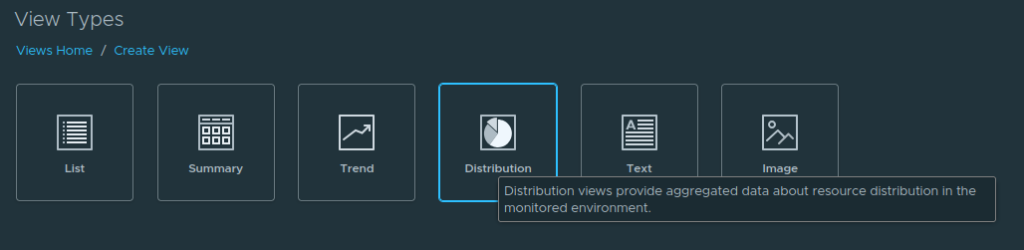
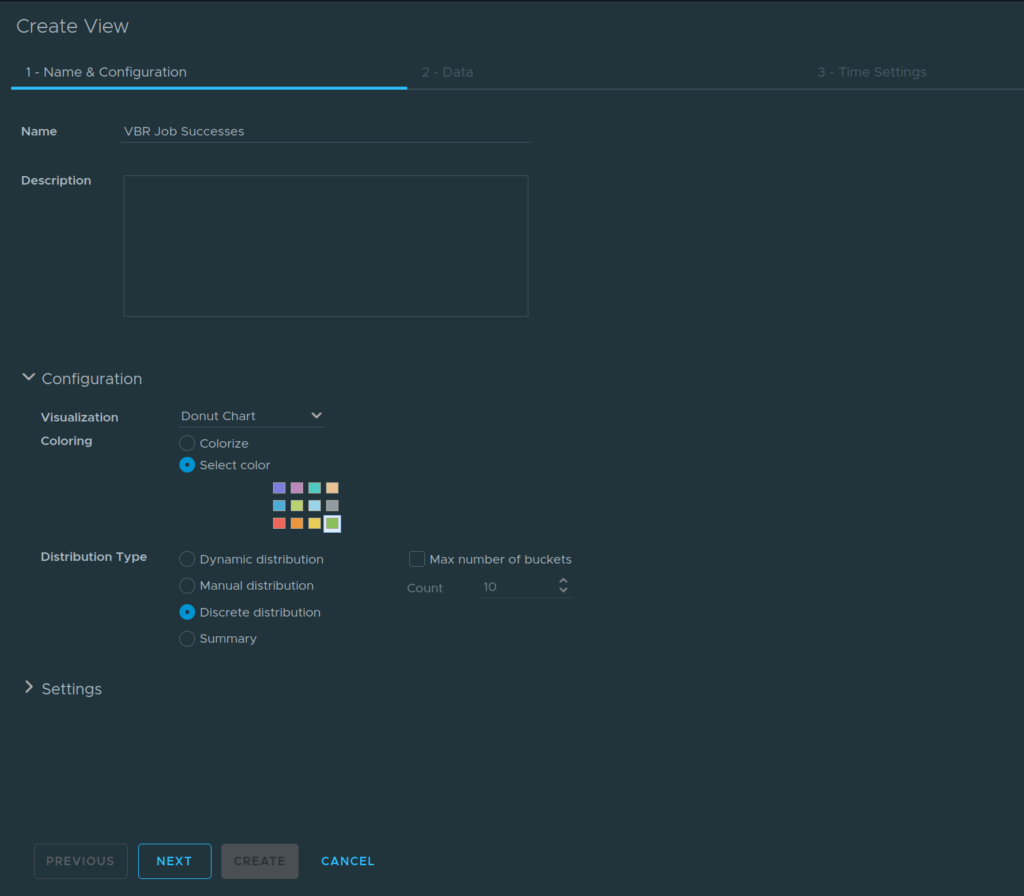
Give it a name, set the visualization to Donut Chart, set the colour to green, set the Distribution type to Discrete Distribution and click Next
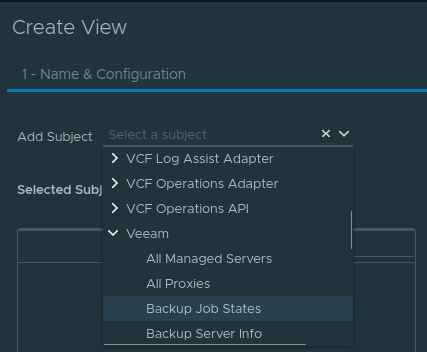
For the subject, use the drop down to select Veeam/Backup Job States
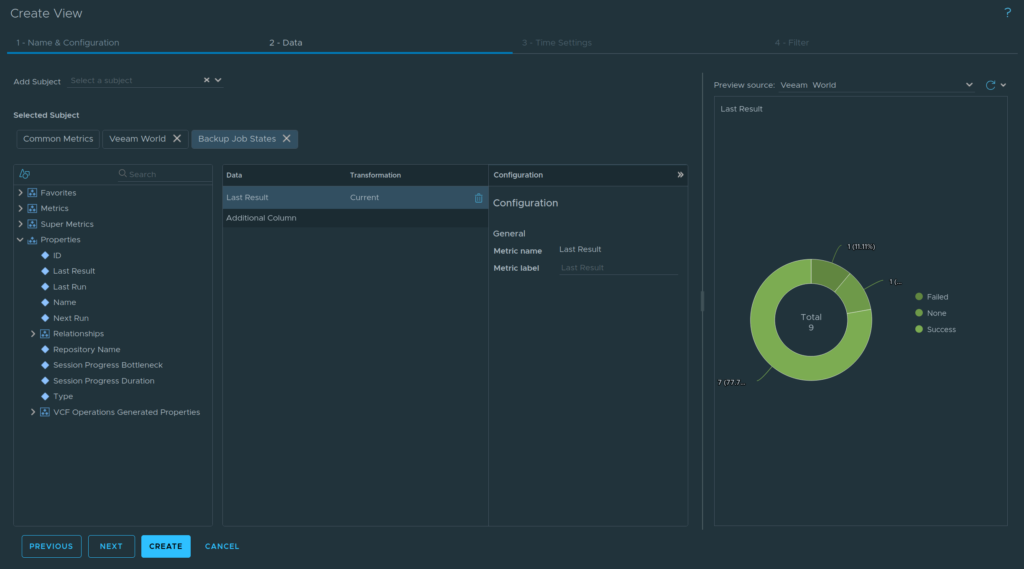
Click Backup Job States, drag Properties/Last Result over to the middle box, if we wait or refresh the data we can see this is shown, and you can see the colour issue as failed jobs are populated, ensure the Preview Source int he top right is Veeam World, I have an entry for none, this is caused by a job in progress and will clear
Click Next
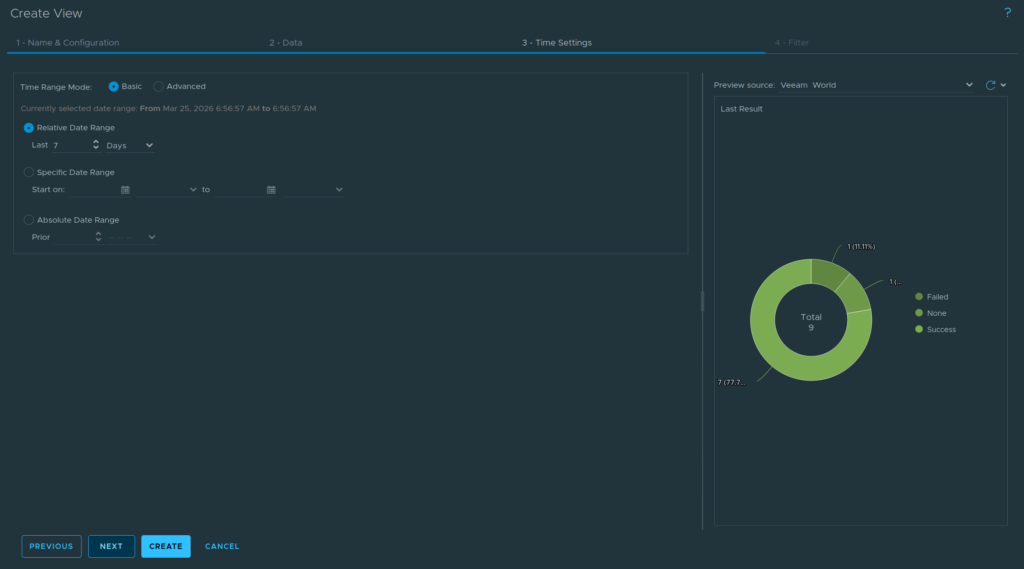
Click Next again
For the filter, on the Backup Job State Filter, use Property, Last Result, Current, Is and Success, this only includes succeeded jobs, then click Create
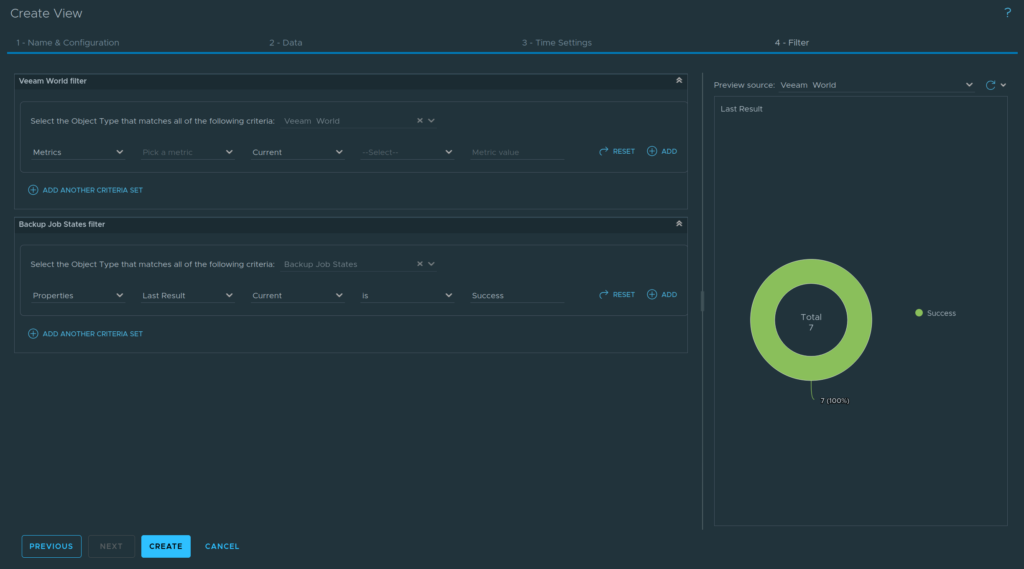
Then click Save
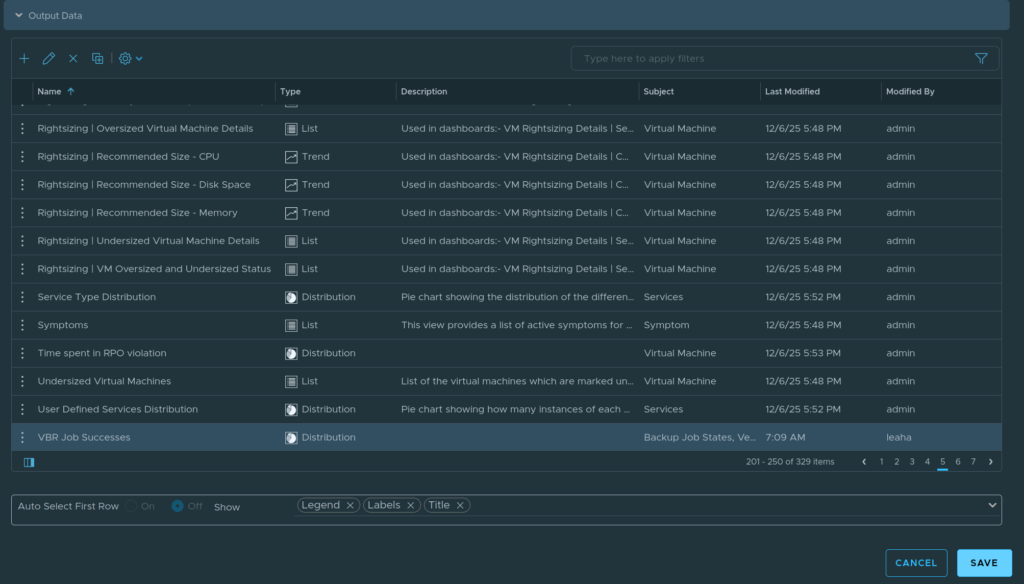
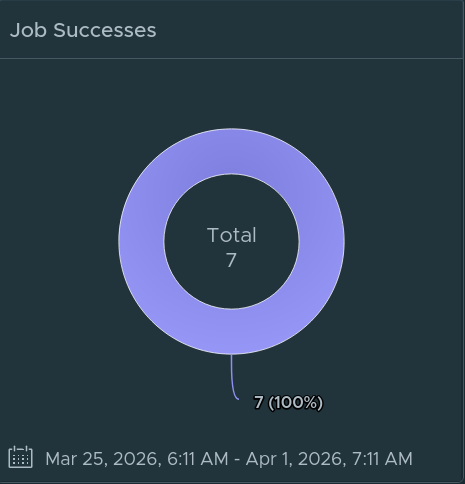
The widget will look like this, the only odd thing is the colour on the preview is correct, but on the actual widget, it uses the default, which is a pain
We can repeat again with another Distribution View, when you are back on Output Data, click the + again
Give it a name, set the Visualization to Donut Chart, and select the red colour, hopefully the bug with the colour not showing will be fixed in a later release, set the Distribution type to Discrete Distribution and click Next
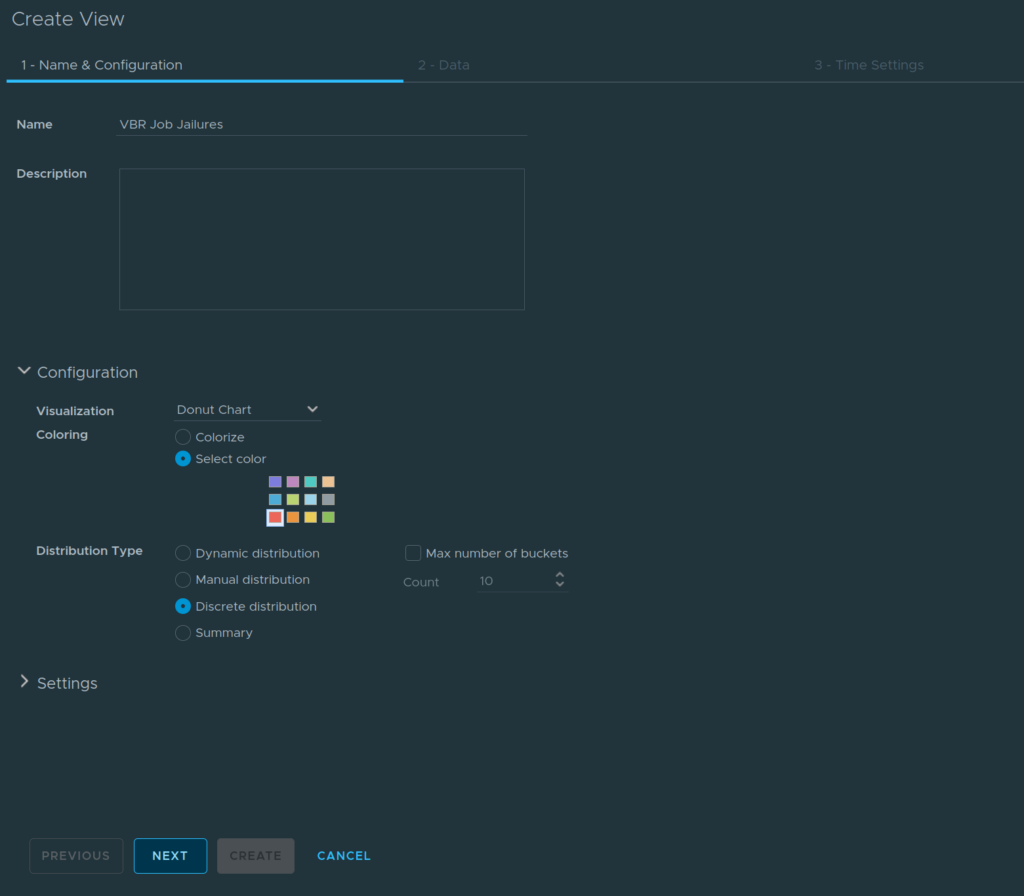
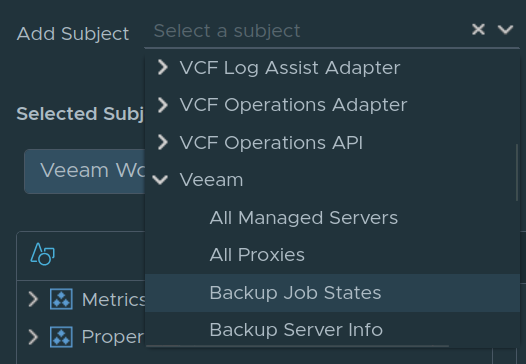
Add a subject and from the drop down select Veeam/Backup Job States
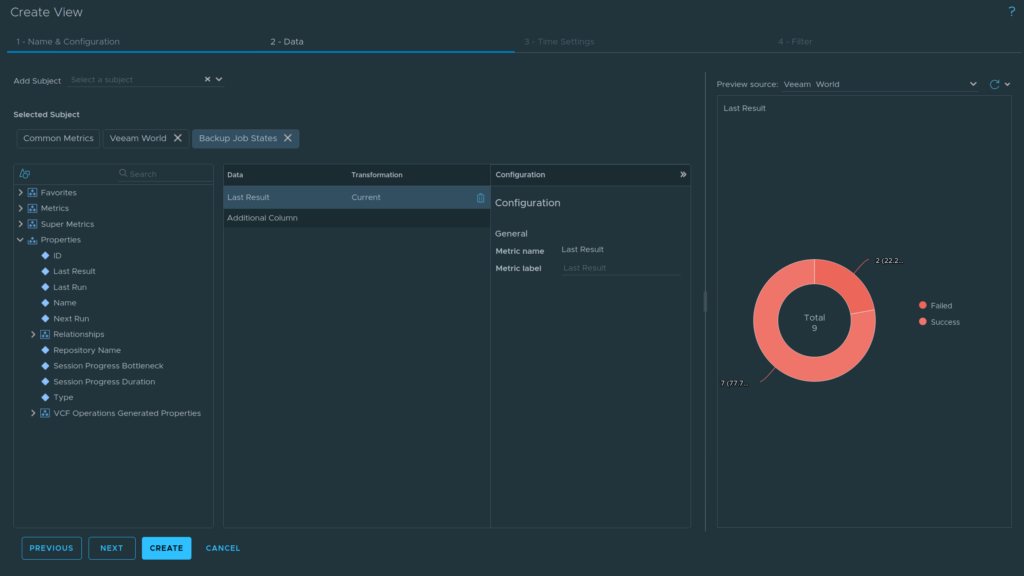
Click Backup Job States as the selected subject, then drag Properties/Last Result to the middle section and set the Preview Source as Veeam World and the preview should look like this, then click Next
Click Next again
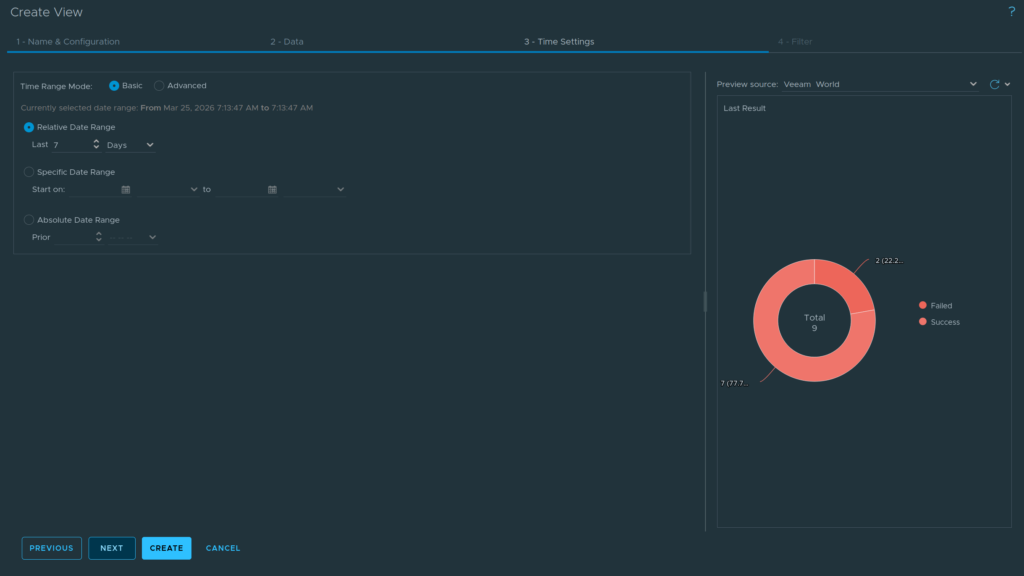
On the Backup Job State Filter, enter Properties, Last Result, Current, Is and Failed then click Create
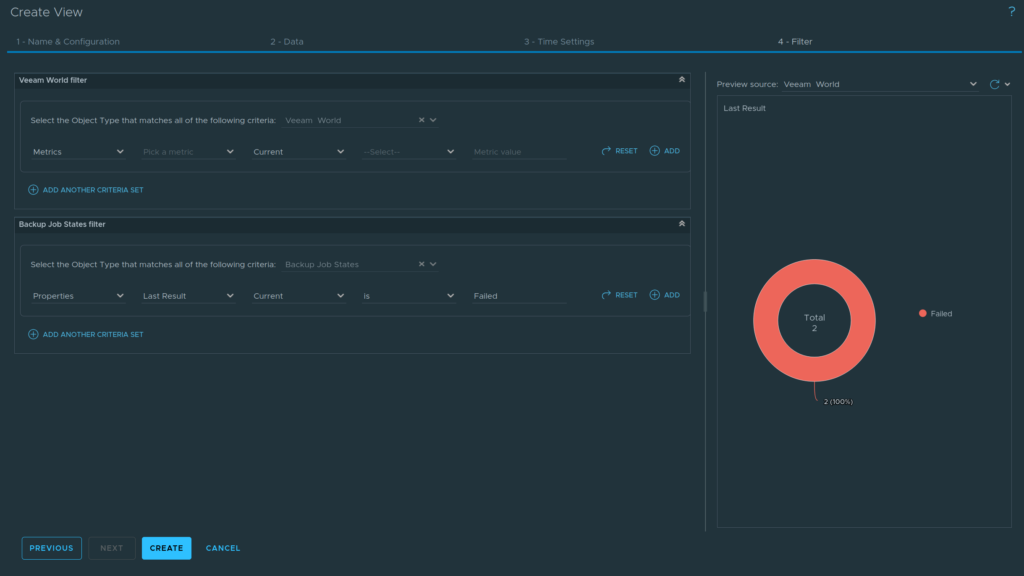
Then click Save
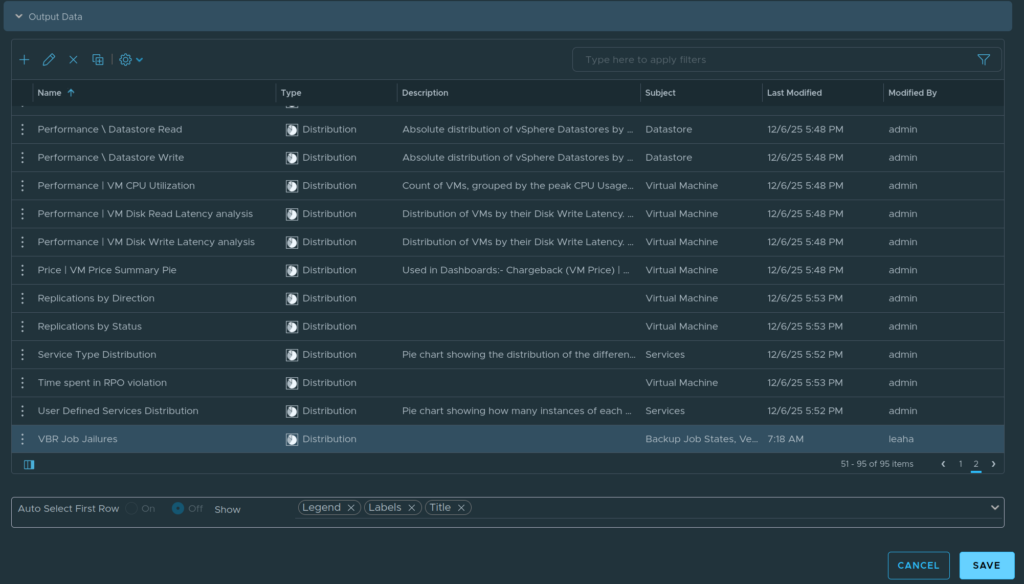
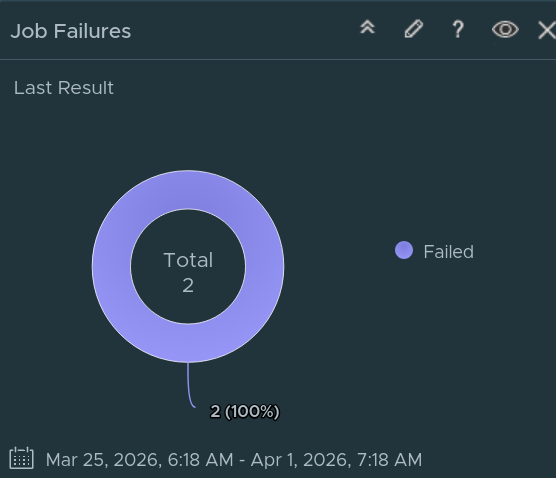
The widget will then look like this
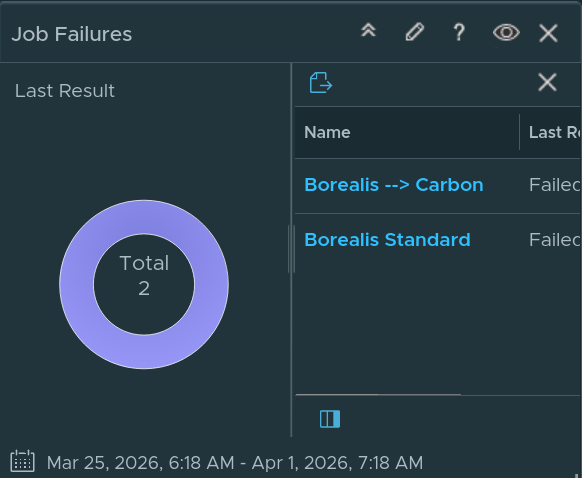
You can also click on the donut for more info, you get info on that
So if I click the failed donut, I can see what job failed
2.1.6 – Backup Job Stats
2.1.6.1 – Super Metrics
Before we start we will need a few super metrics as Veeam reports the data values in B, when I want GB, you can also add an extra /1024 to all super metric definitions for TB, but as my data values arent that large I didnt
To add a super metric, click Configurations/Super Metrics
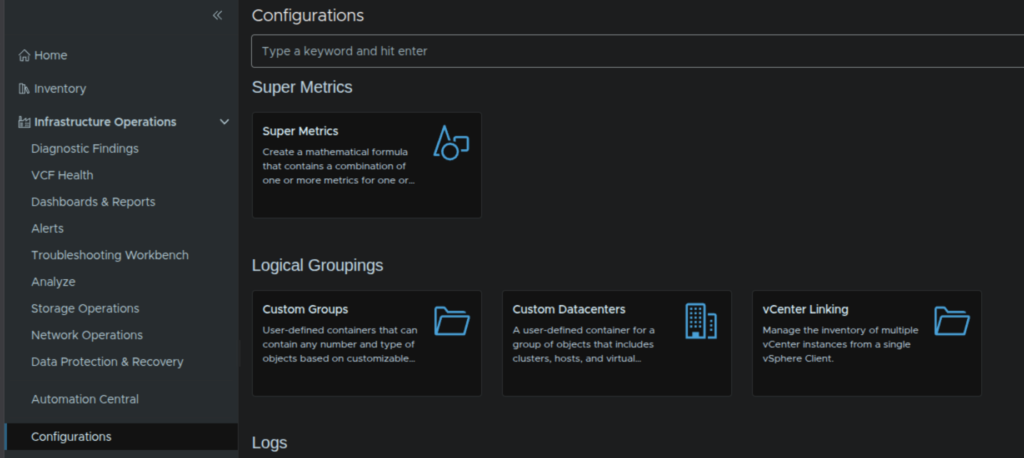
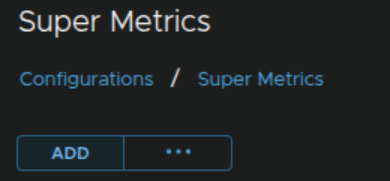
Then click Add
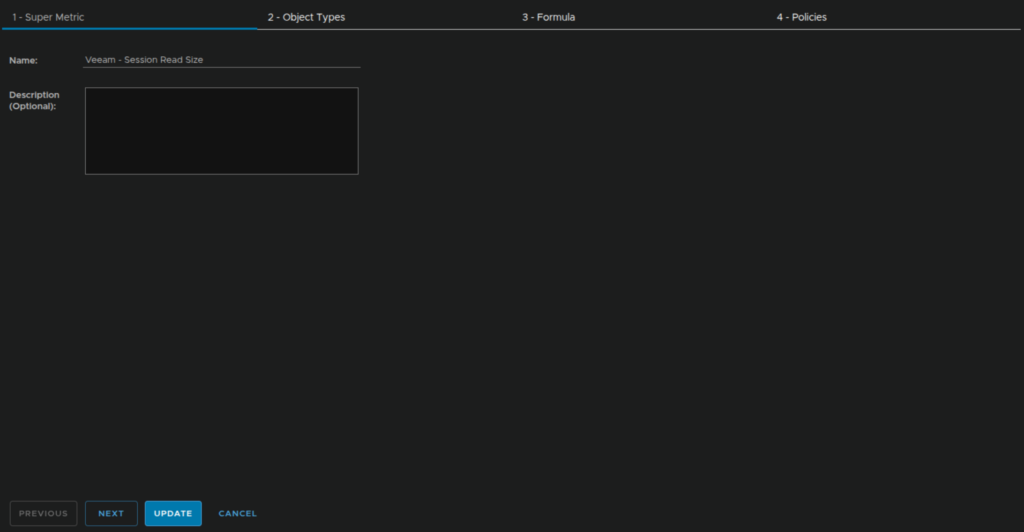
We first need one for the read data, called Veeam – Session Read Size, add that title and click Next
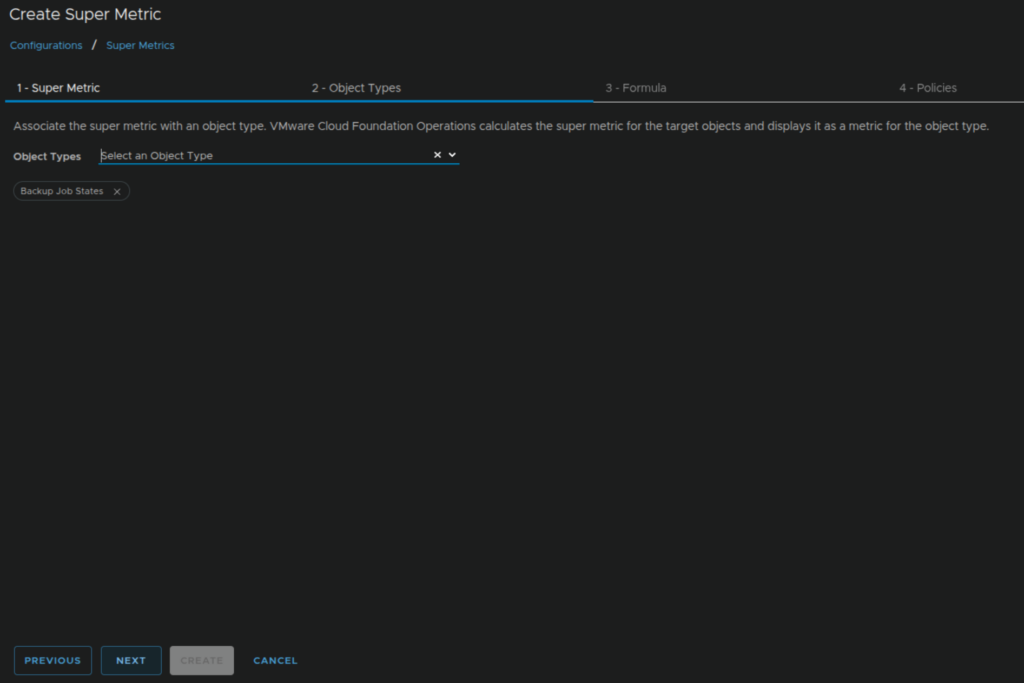
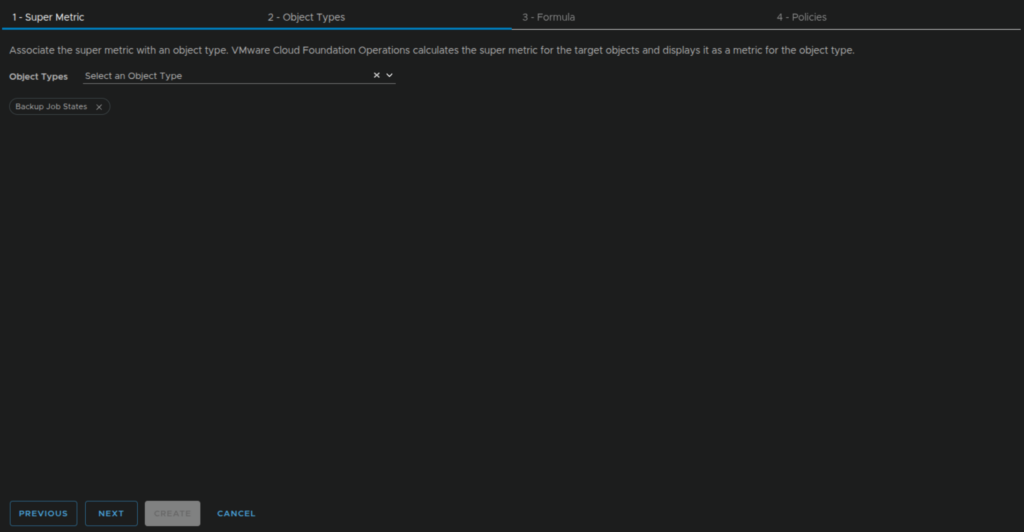
We then need an Object Type, for this click Veeam/Backup Job States
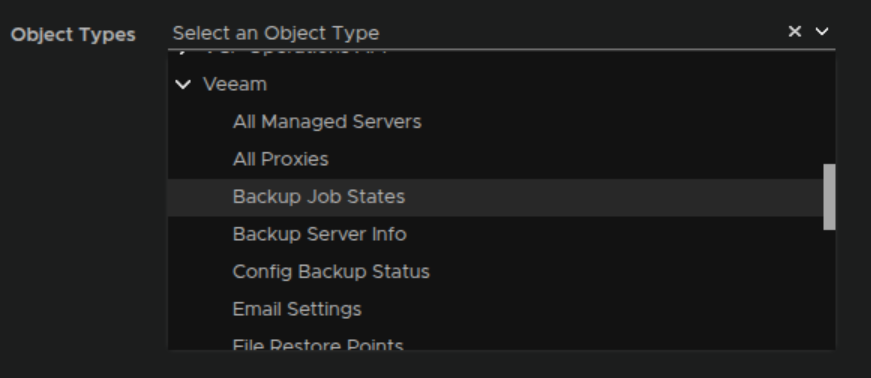
Then click Next
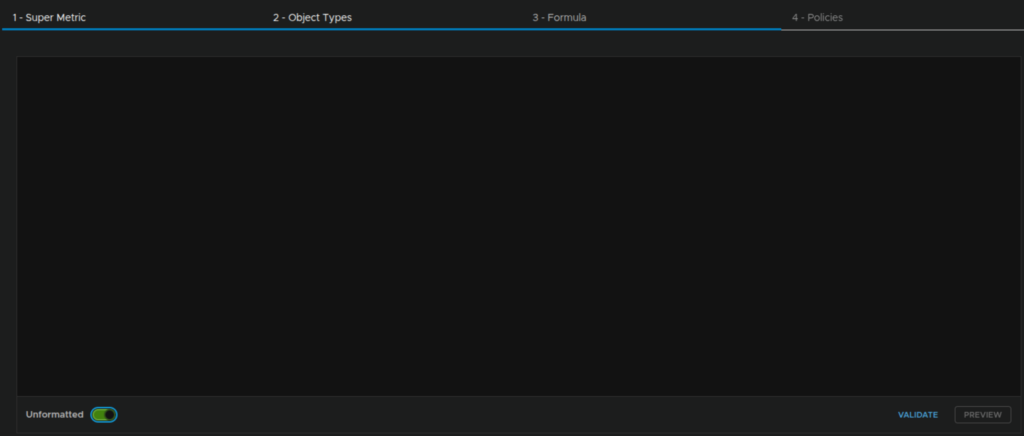
Enable the toggle to change the data to unformatted
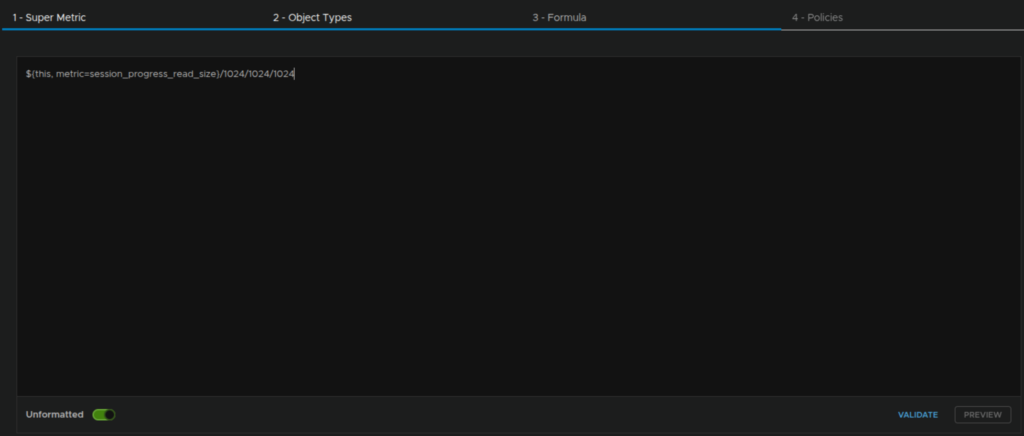
Then enter this value
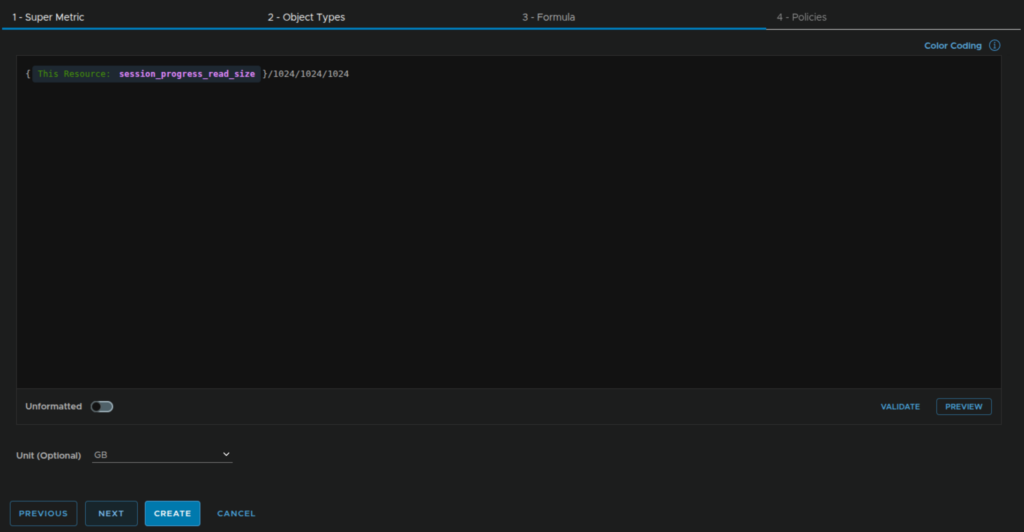
${this, metric=session_progress_read_size}/1024/1024/1024Then click the toggle again to format it
Select the unit to be GB, or TB if you opted for that, and click Next
Select the default policy and click Create
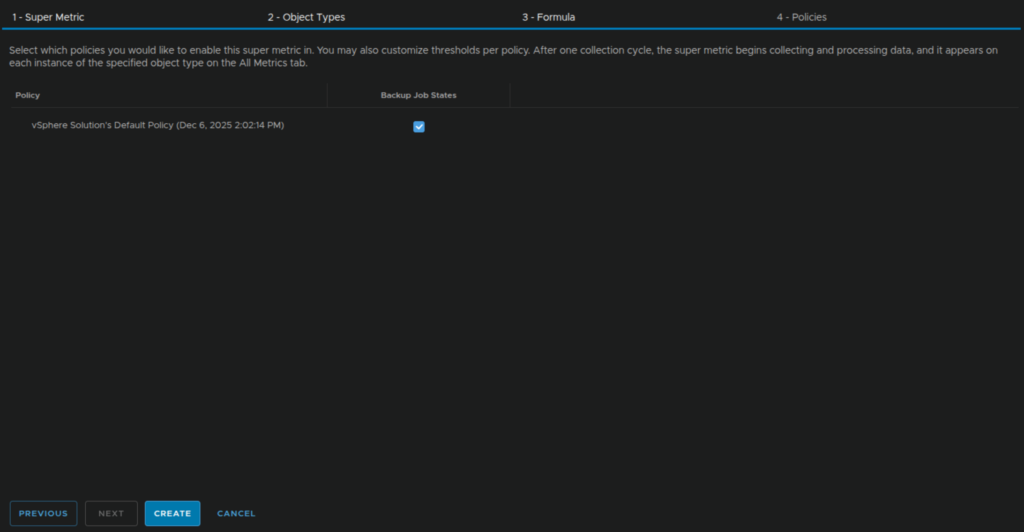
We then need to add another called Veeam – Transferred Size
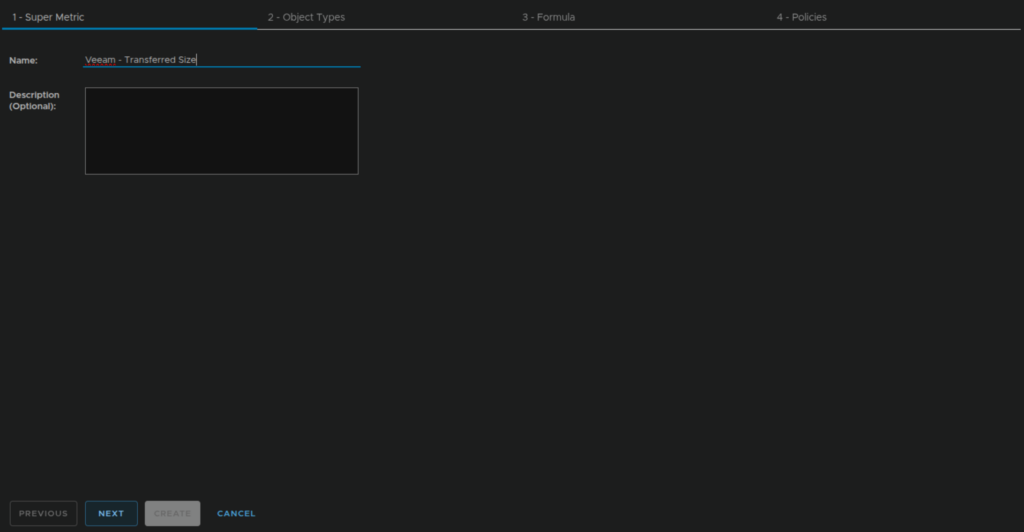
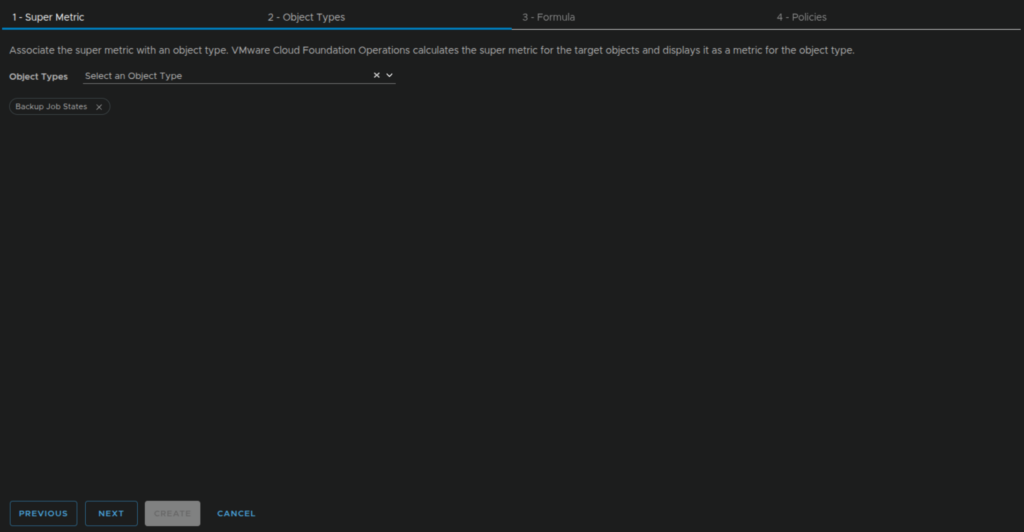
With the same Object Type
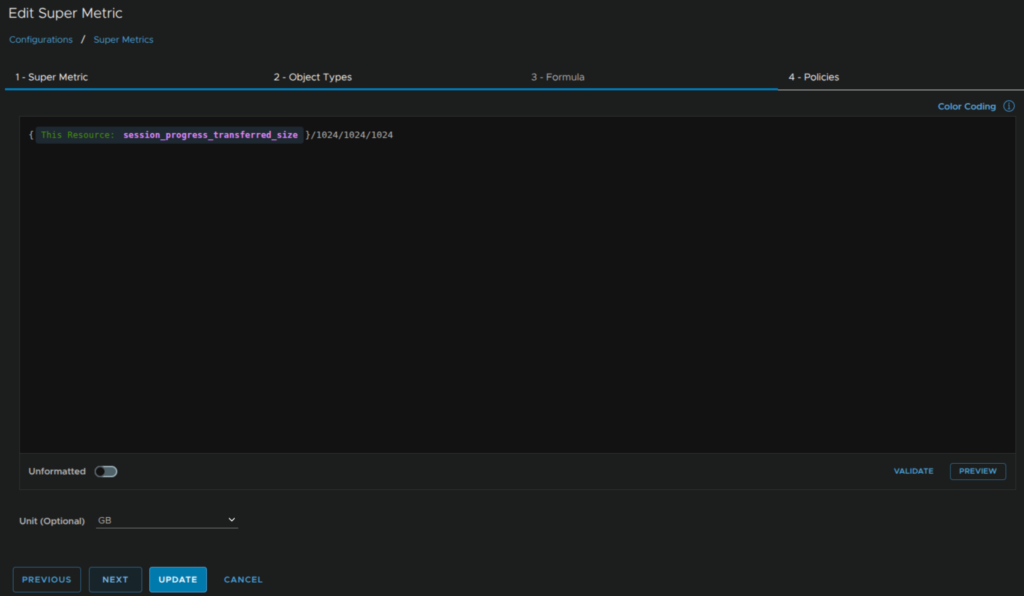
Using this unformatted code for
${this, metric=session_progress_transferred_size}/1024/1024/1024Like this, when re formatted, dont forget to add the Unit at the bottom of GB and click Next
And defining it in our default policy and clicking Create
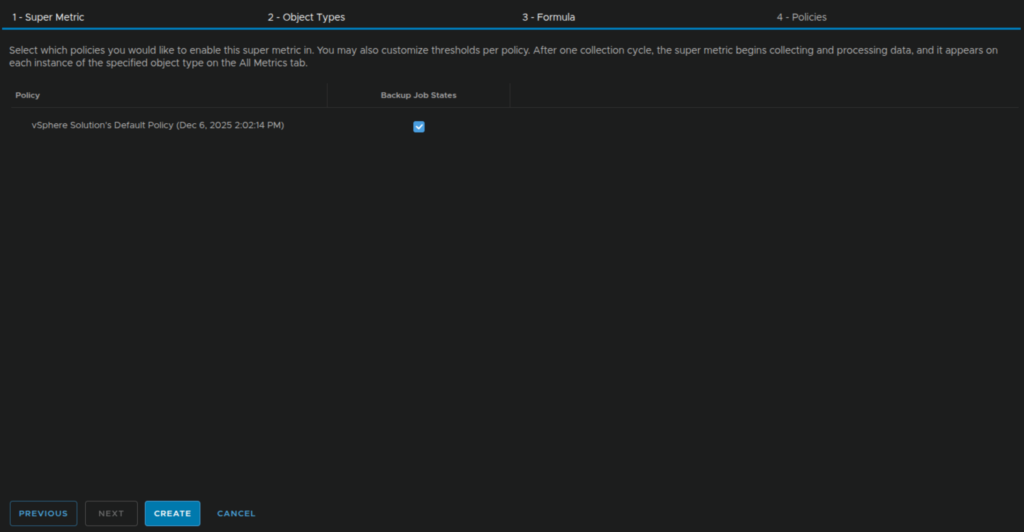
We then need one more called Veeam – Processed Size
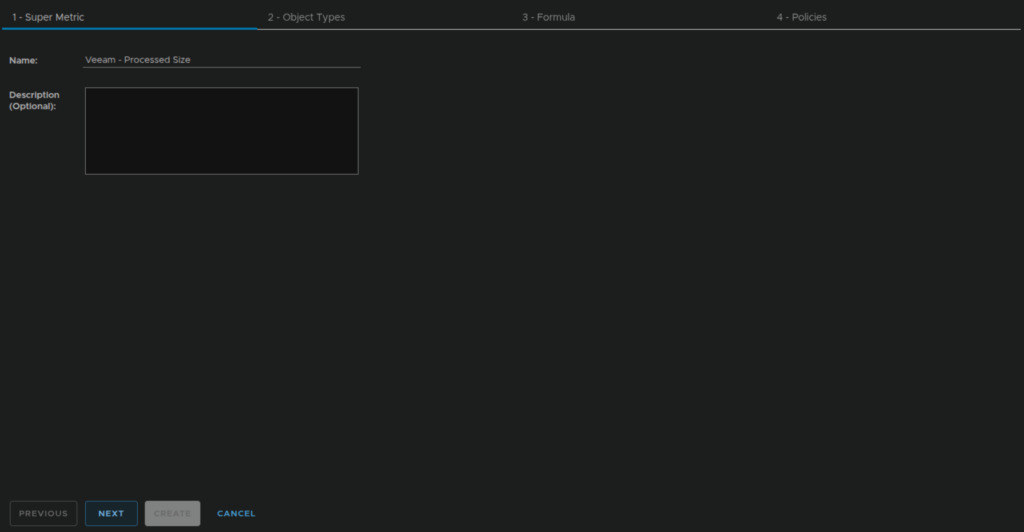
With the same Object Type
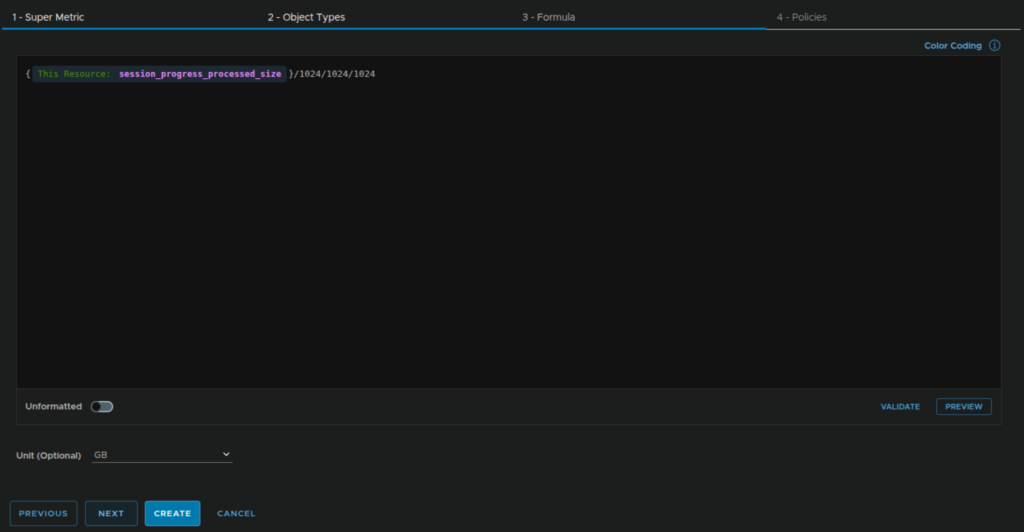
Using the following unformatted code
${this, metric=session_progress_processed_size}/1024/1024/1024When formatted will look like this
2.1.6.2 – Object List
Drag an Object List onto the canvas
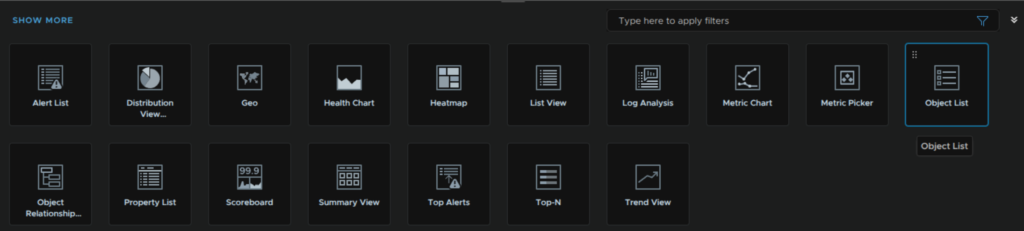
Then click the pencil icon to edit it
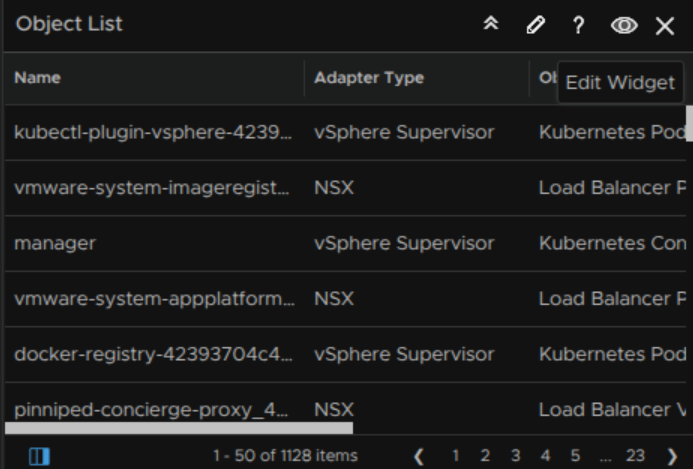
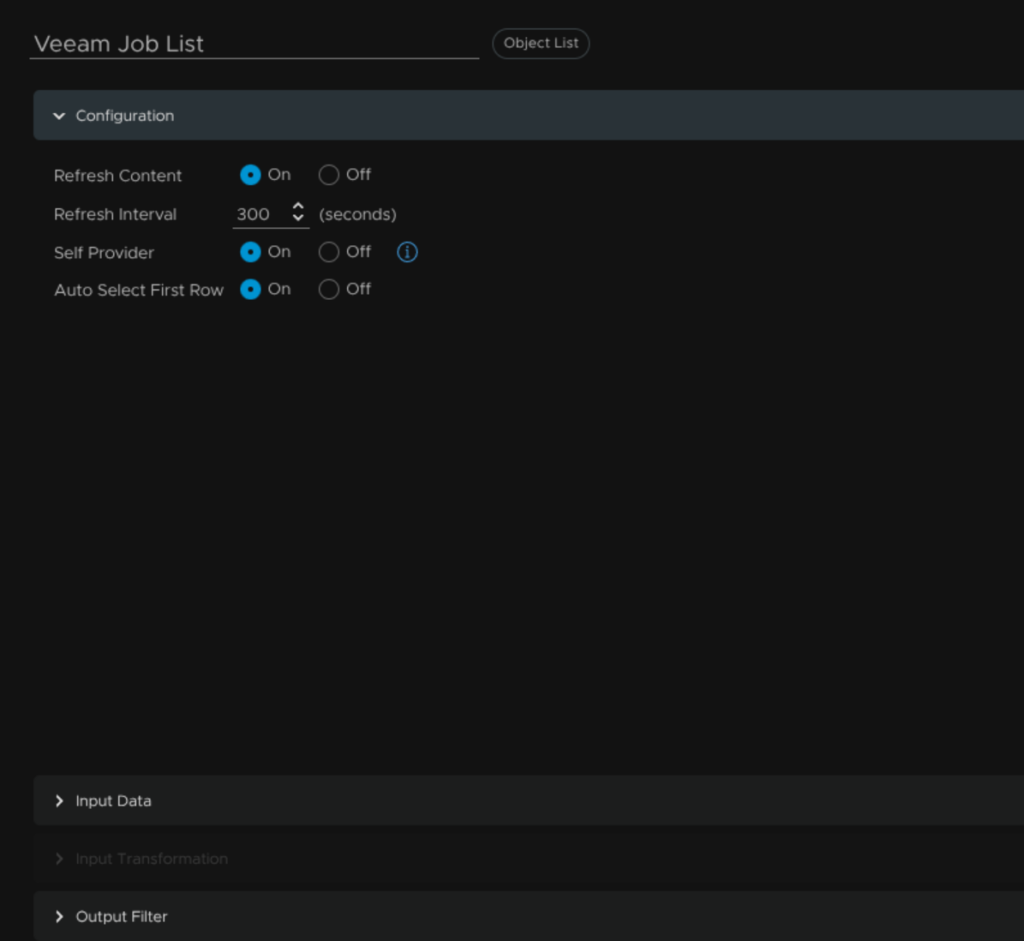
Give it a name and click Output Filter
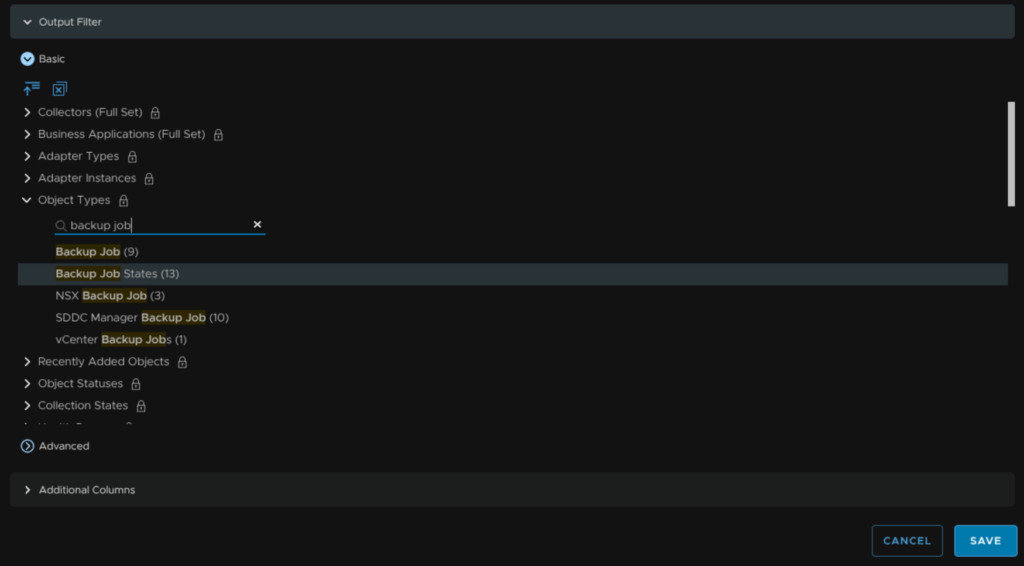
Expand Object Types, search for and click Backup Job States then Additional Columns
Click the +
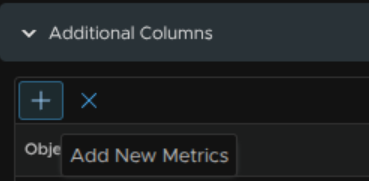
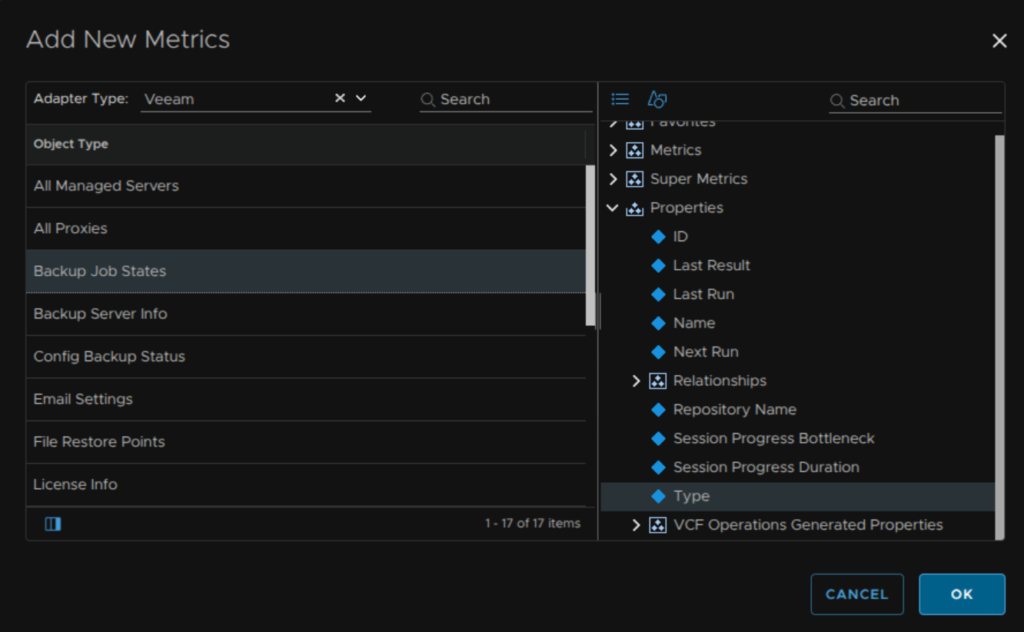
Change the Adapter Type to Veeam, select Backup Job States and click Properties/Type, then click ok
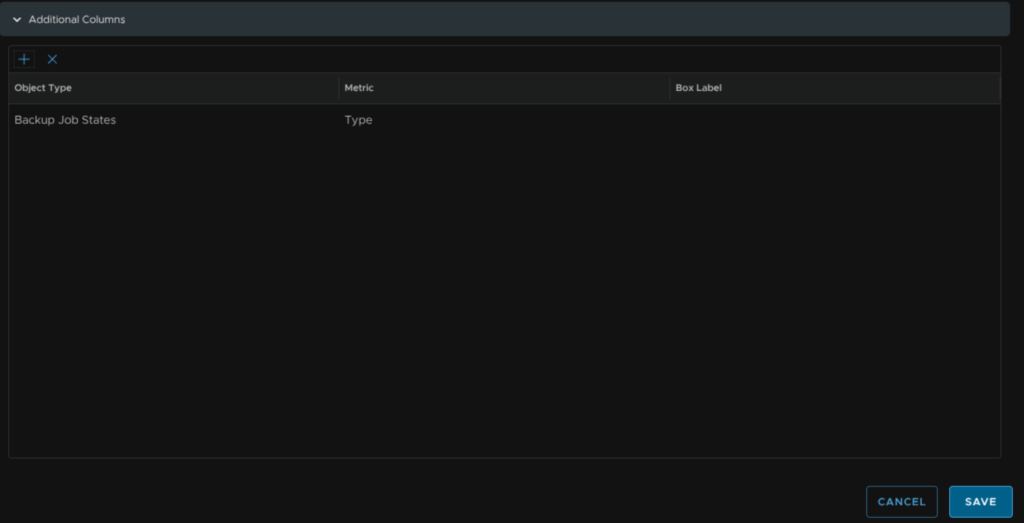
Now click Save
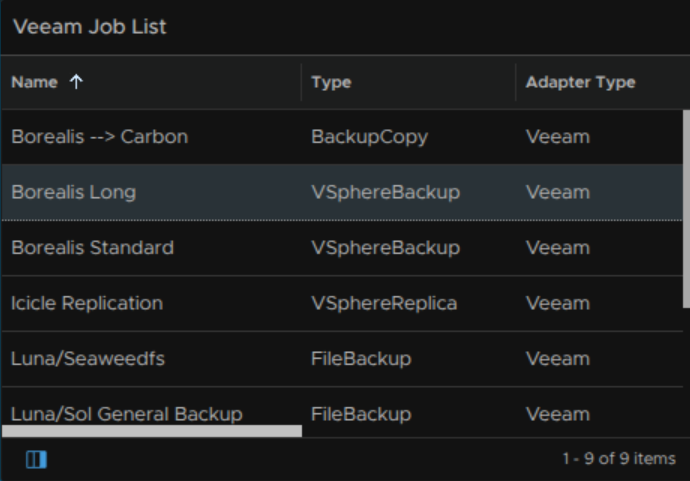
We should then end up with a list of all our jobs gathered by the adapter
2.1.6.3 – Job Data Metrics
Now we have the object list we can create some widgets that use it as input giving us a job selector and info on the dashboard, drag a Metric Chart onto the canvas
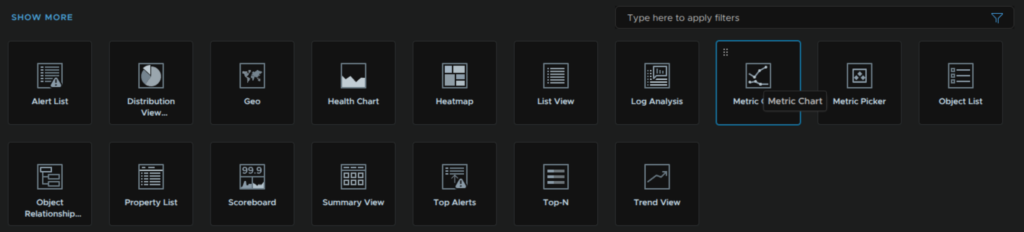
Click the pencil to edit it
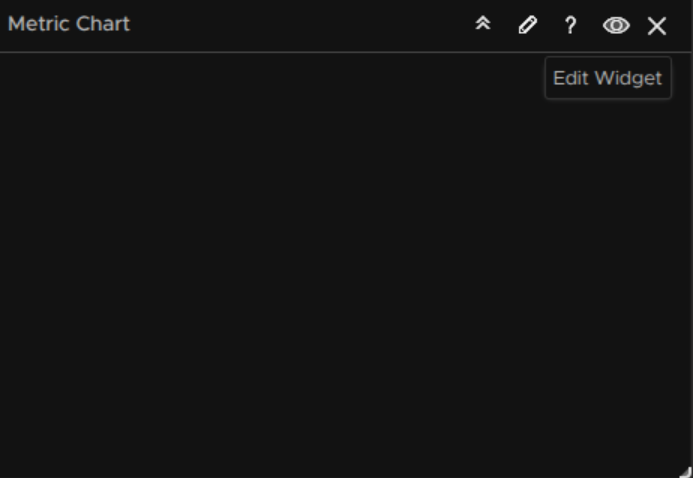
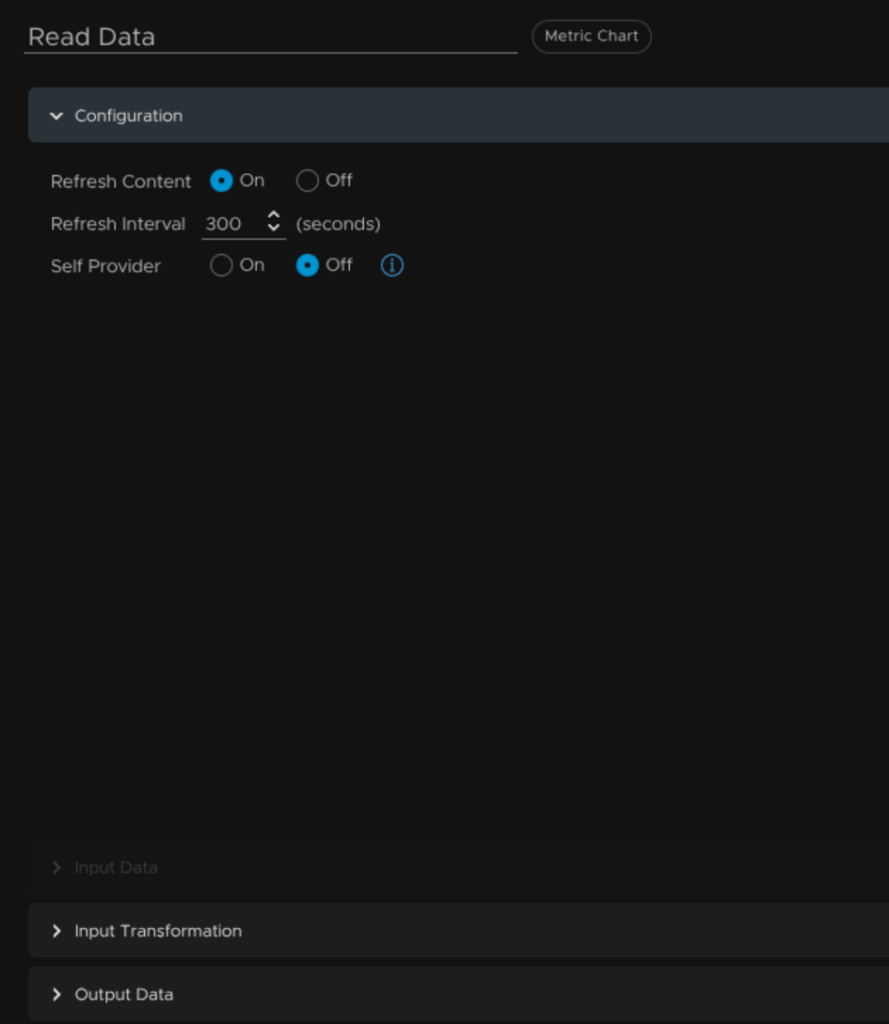
We’ll create a pair of widgets like this, so lets start with data read from the backup job, give it a name, like Read Data, set Refresh Content to On, leave Self Provider as Off and click Output Data
Click the +
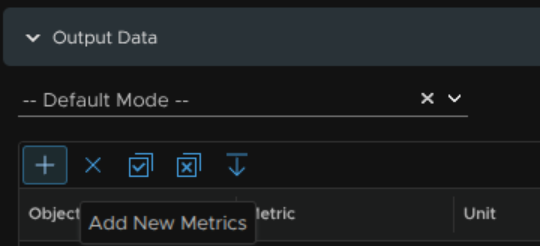
Set the Adapter Type to Veeam, then click Backup Job States/Super Metrics and click on the one we create for the Veeam Session Read GB, then click ok
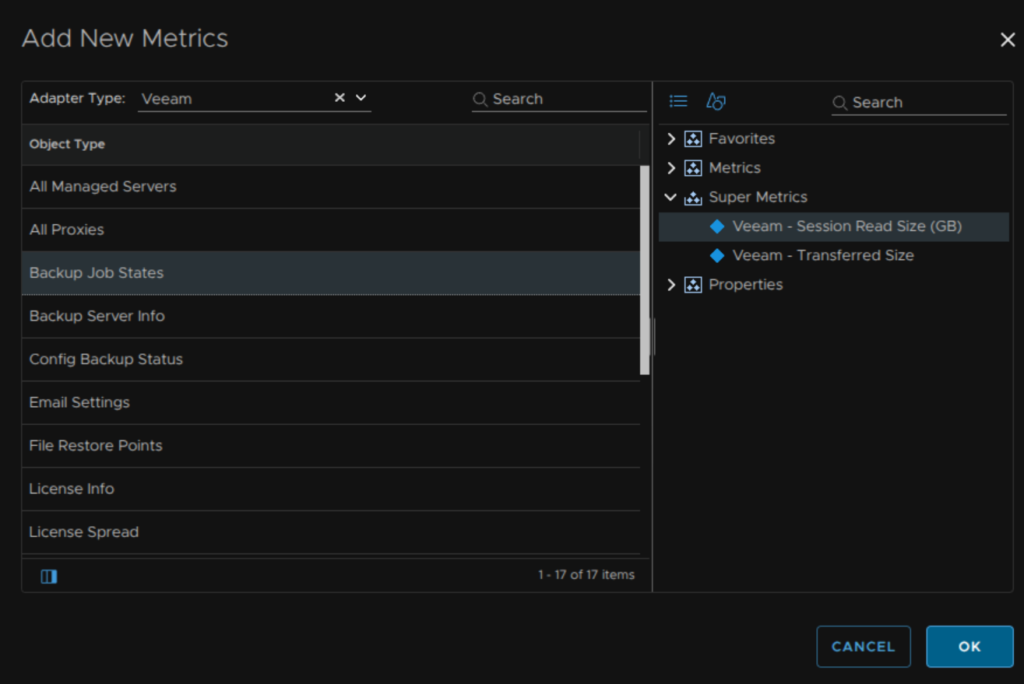
Now hit Save
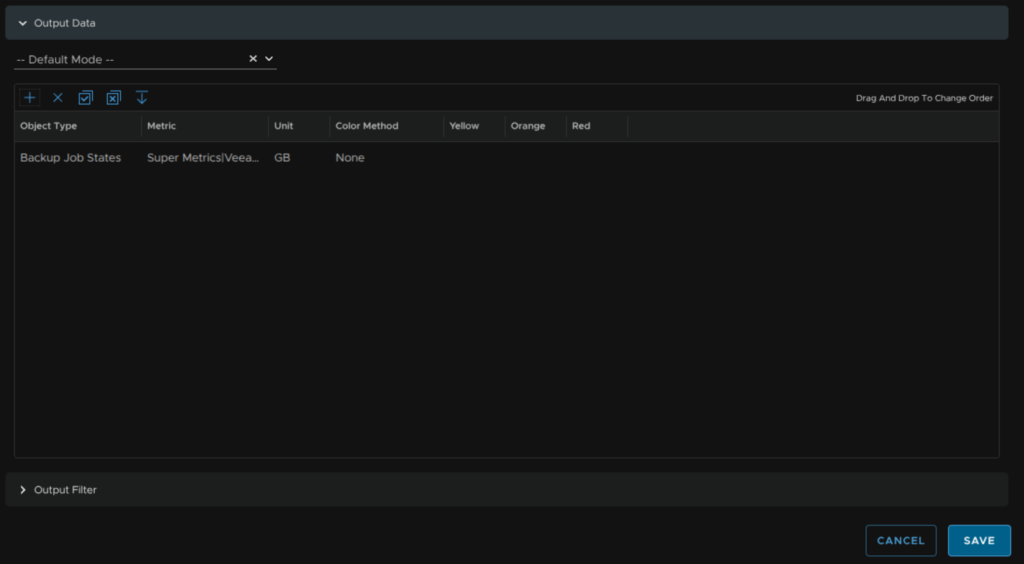
Now to use the selected job from our job list as the input for this widget, click Show Interactions at the top of the dashboard configuration page

Drag the output from the job list into the new widget’s input like so
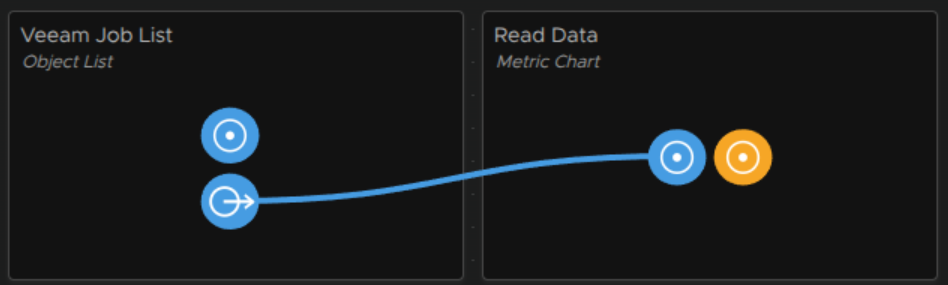
Then click Hide Interactions

Now whenever you click on a job for this dashboard, the Read Data is pulled for that job
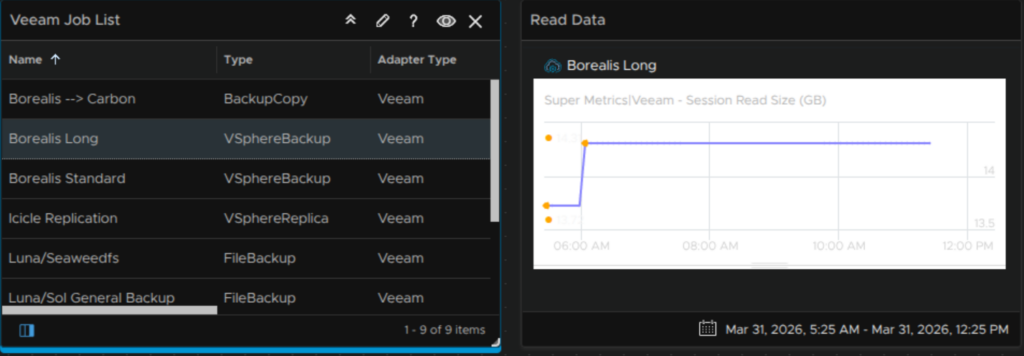
We can do another for transferred data, drag another Metric Chart onto the canvas
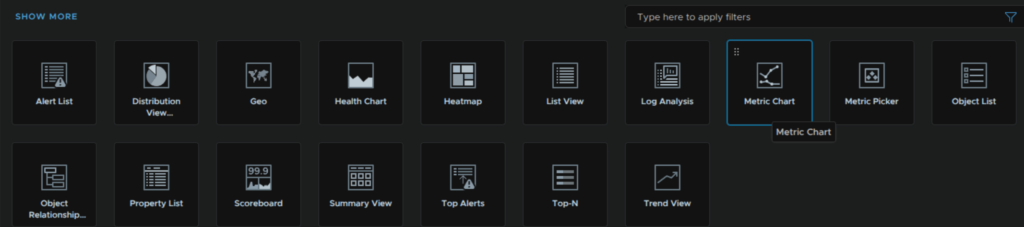
Click the pencil to edit it
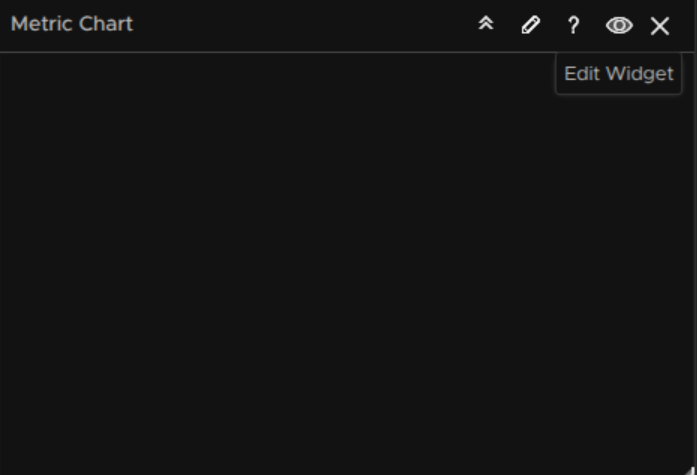
Use the same settings on the configuration giving it a useful name, then click Output Data
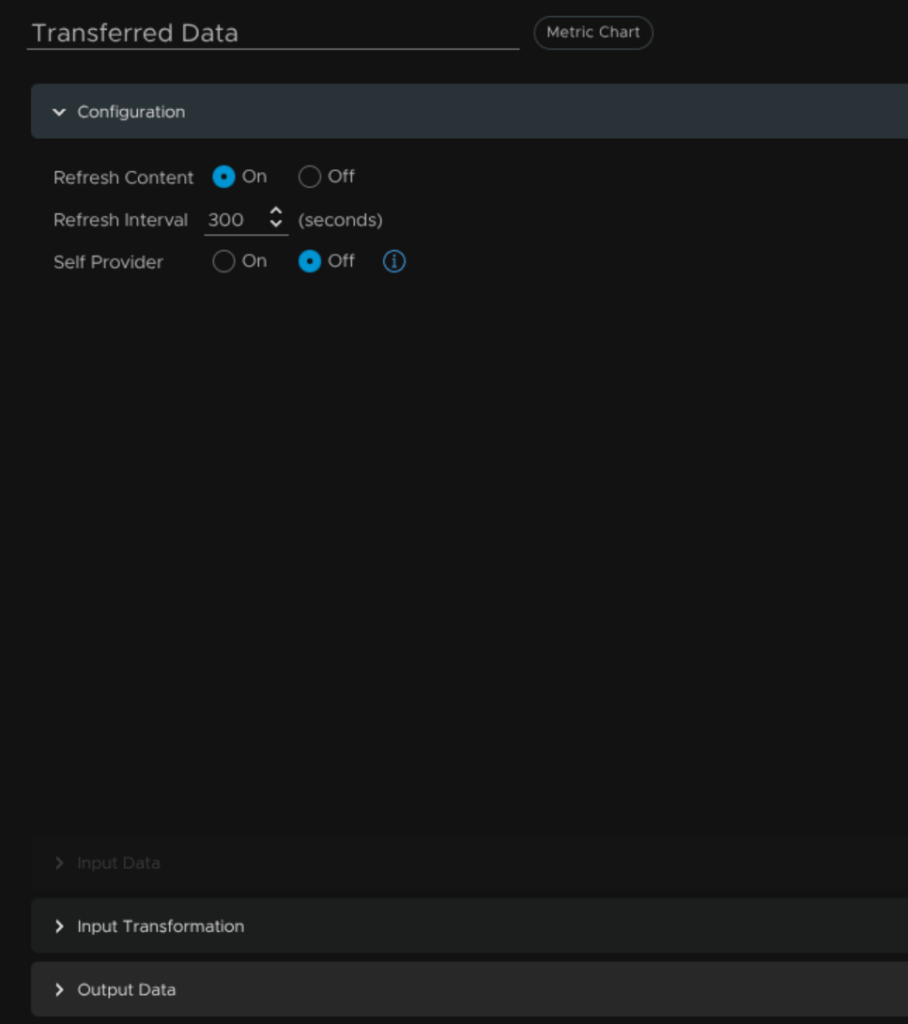
Click the +
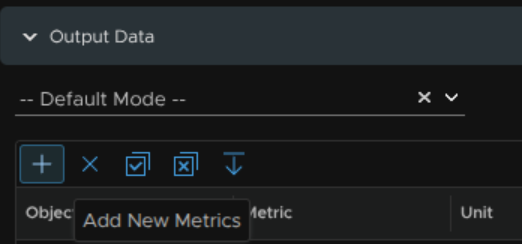
We are then going to do the same and change the Adapter Type to Veeam, click Backup Job States/Super Metrics and our other super metric we created, then click ok
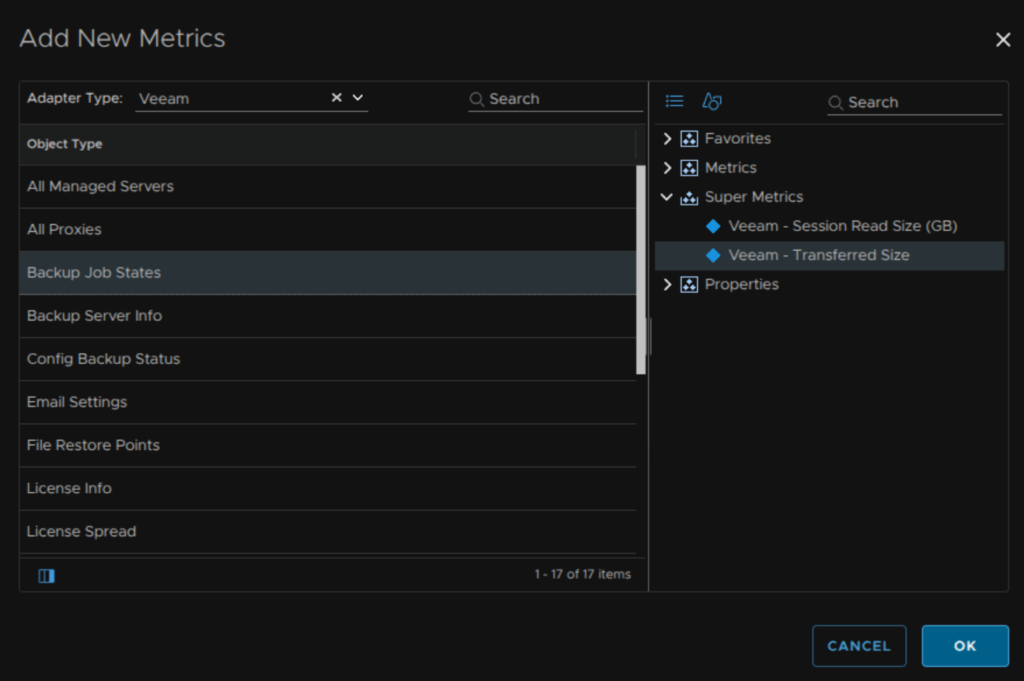
And click Save
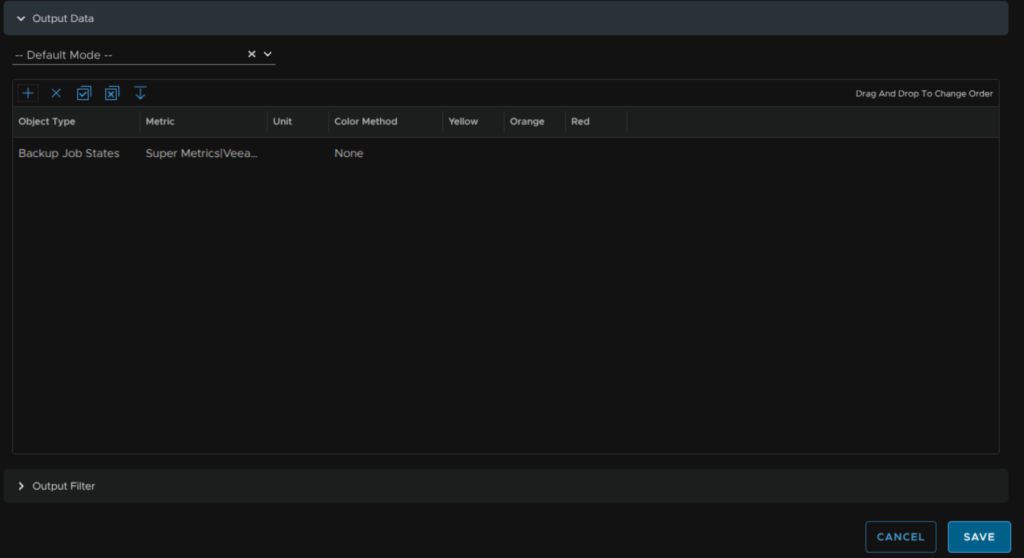
At the top click Show Interactions

And drag the output from the Veeam Job List onto the new widget, mine is called Transferred Data
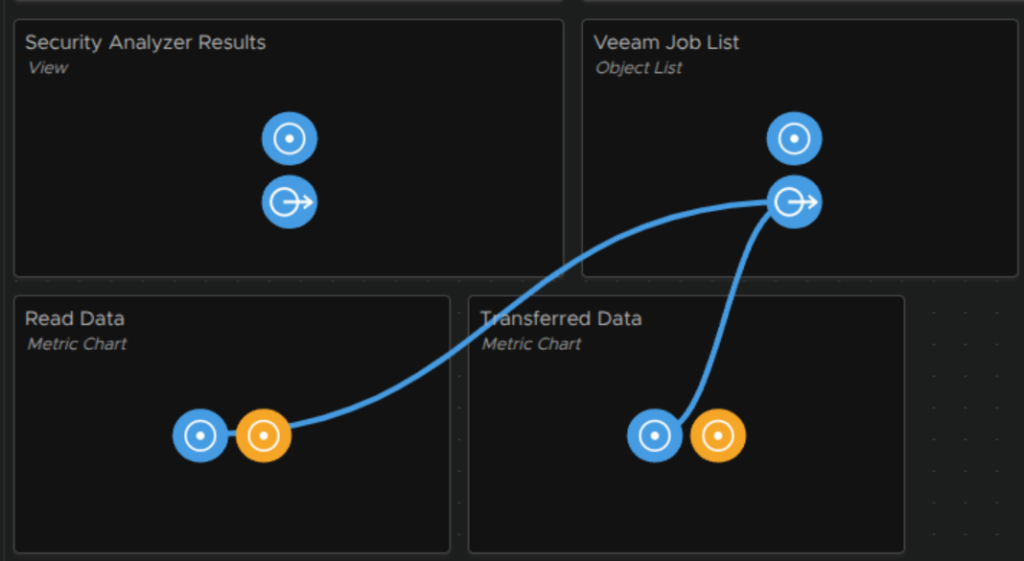
Then click Hide Interactions

It should look like this
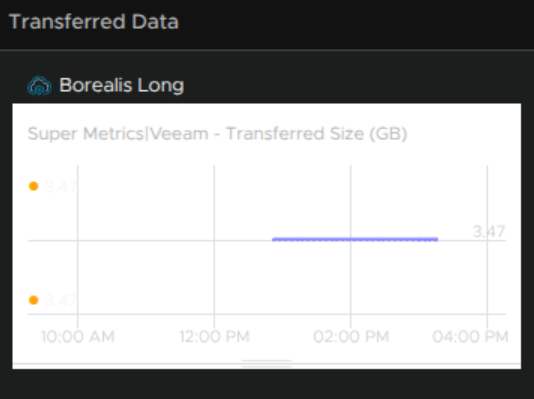
2.1.6.4 – Job Stats
Lastly we need a widget for the jobs info for some of the remaining metrics, drag a Scoreboard onto the canvas
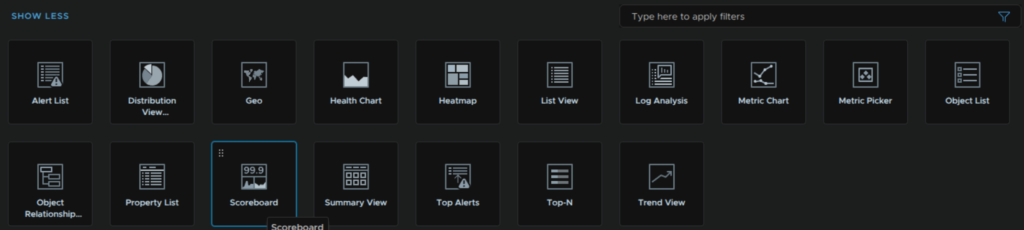
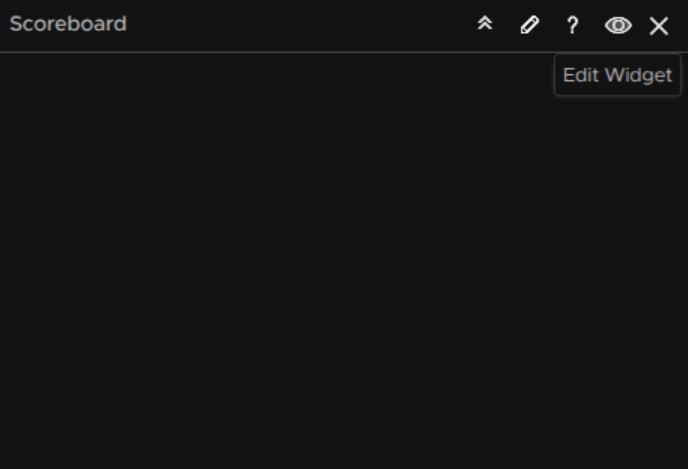
Click the pencil to edit it
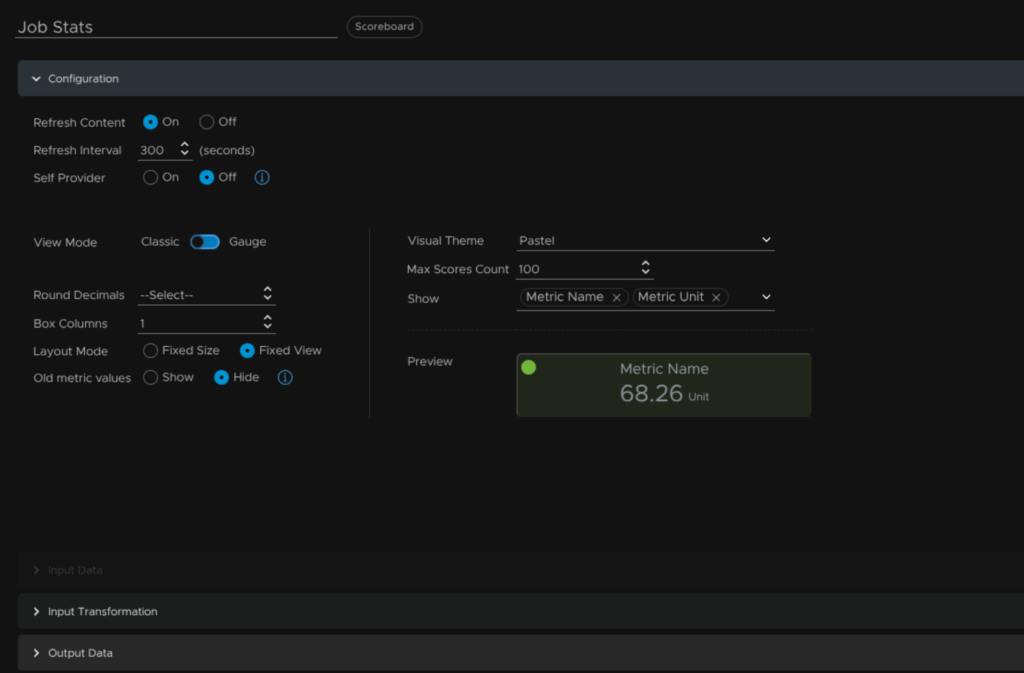
We then need to configure a few bits
- Add a widget name
- Set Refresh Content to On
- Box Columns should be set to 1
- Visual Theme should be set to Pastel
Then click Output Data
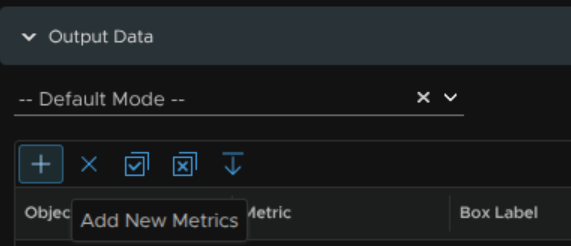
Click the +
Search for and click Backup Job States, then expand Properties, from there click Next Run, Repository Name, Session progress Bottleneck and Session Progress Duration and click ok
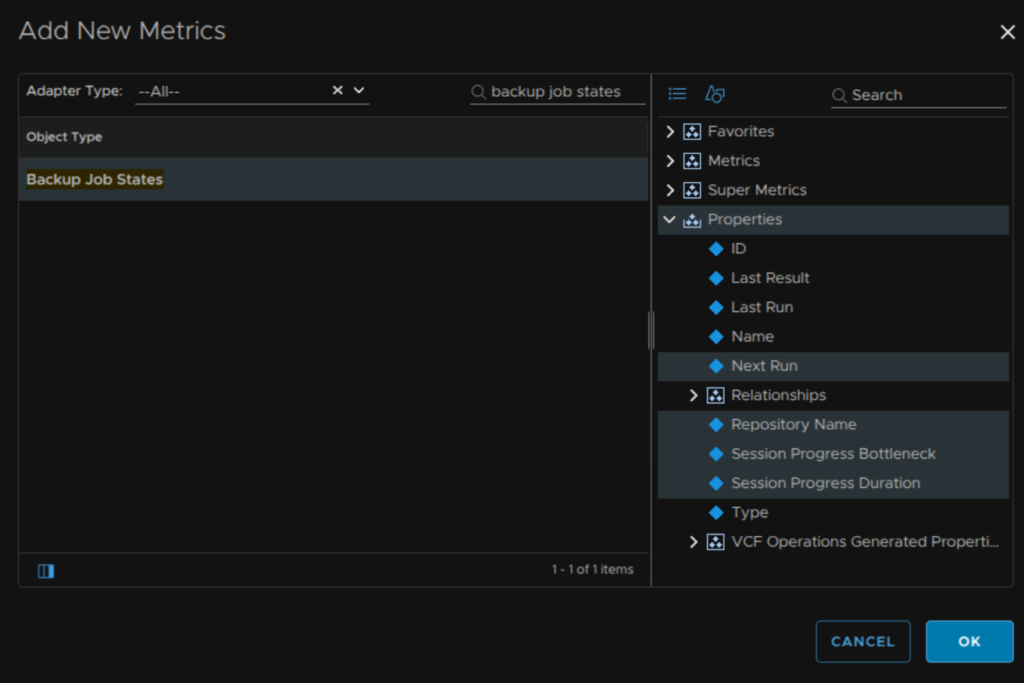
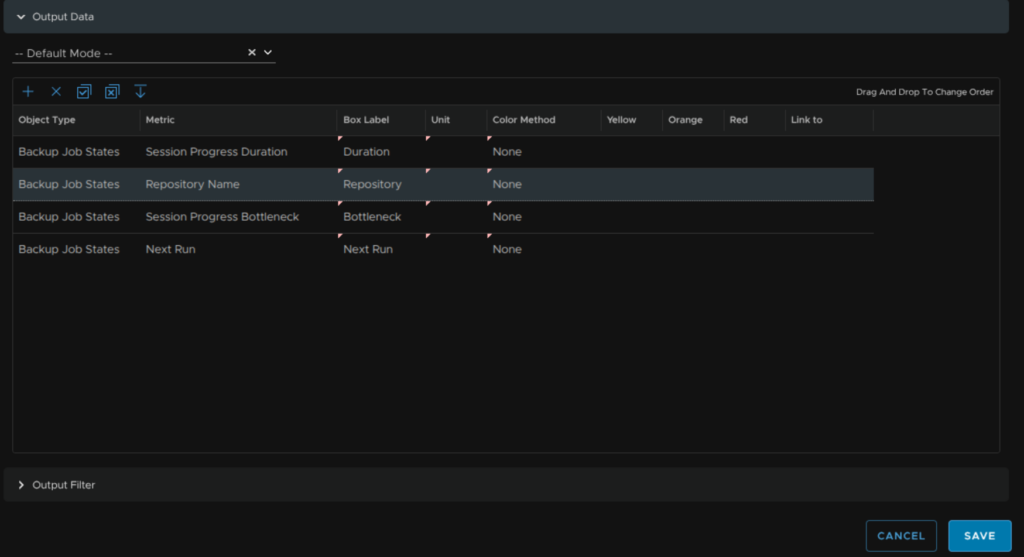
Double click the Box Label and set a label, change Color Method to None and click Update, then repeat on the rest

I ended up with something like this, then click Save
Now at the top, click Show Integrations

And connect the output from the Veeam Job List to the input on the Job Stats widget
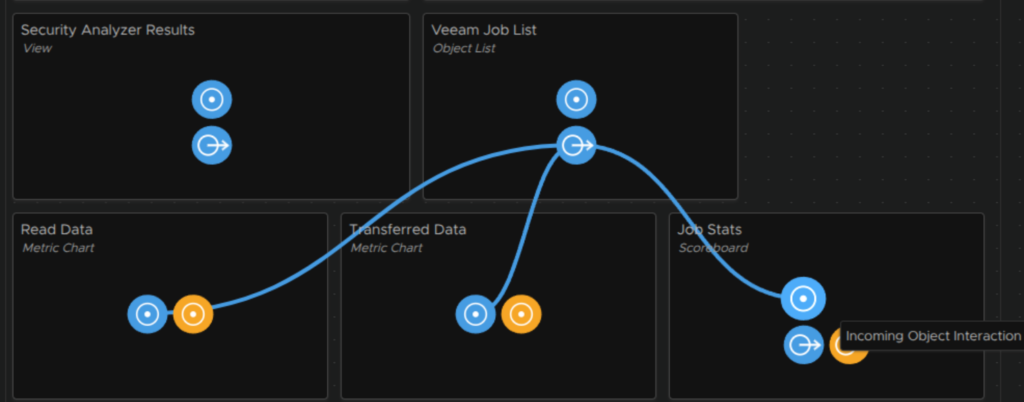
Then click Hide Integrations

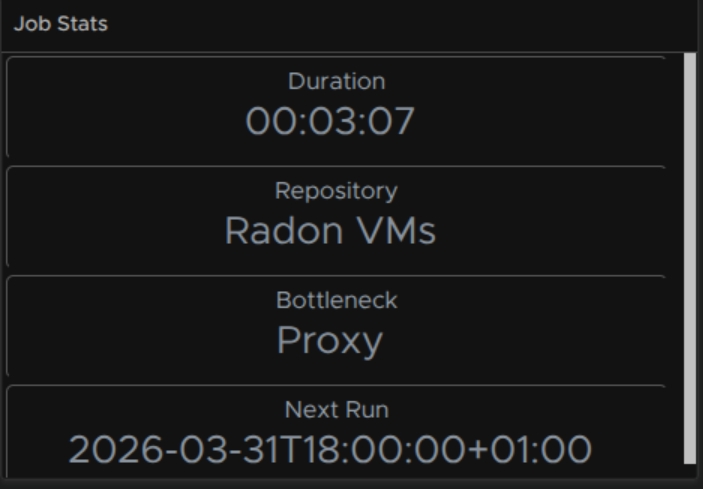
Now when we select a job we can see additional information about it
The only thing of note, is the next run doesnt get a value if the job runs only after another
2.1.7 – Managed Server Status
We can define a new view to show what the status of our managed server is, available or not, drag a new Distribution View onto the canvas

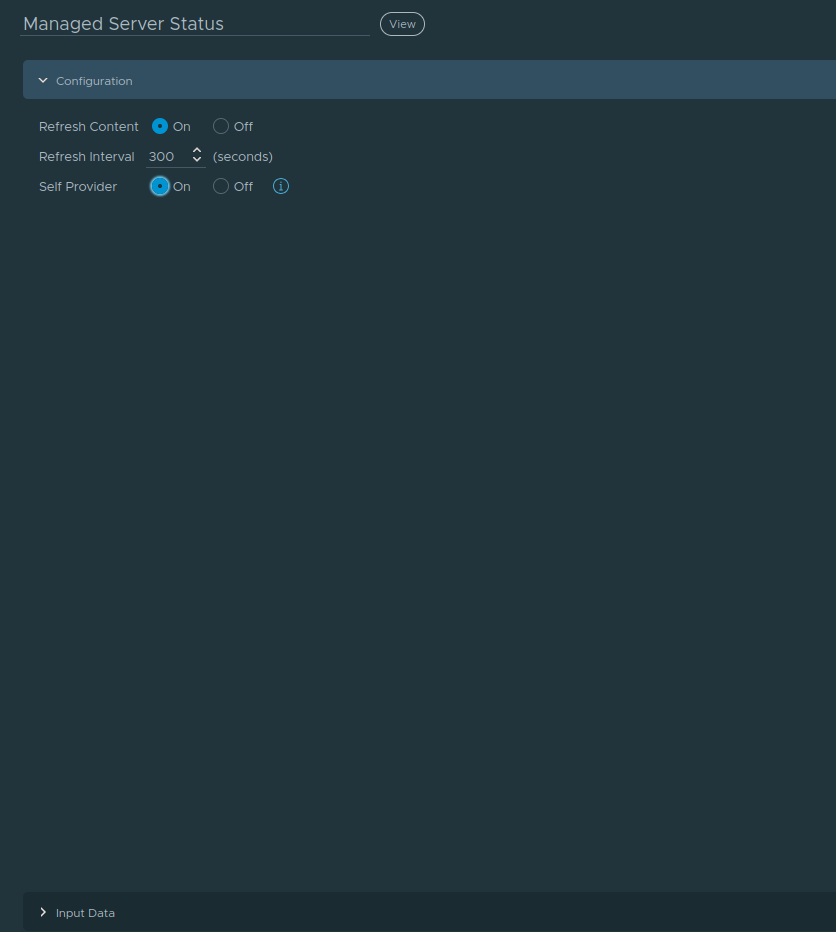
Give it a name and set both Refresh Content and Self Provider to On, then click Input Data
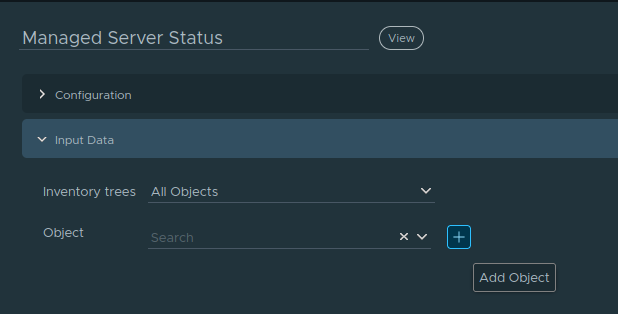
Click the +
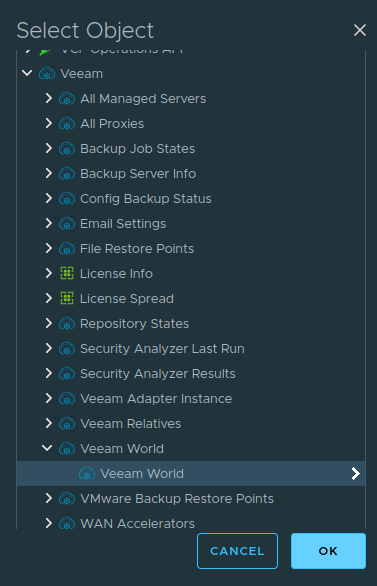
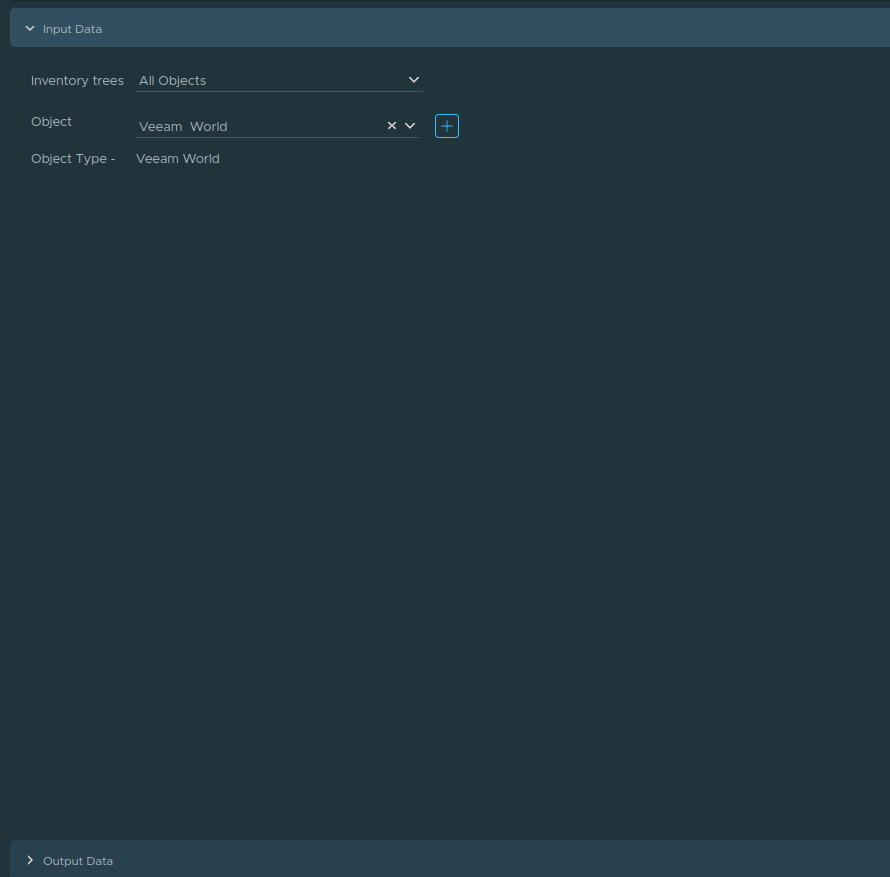
Then click Veeam/Veeam World/Veeam World and click ok
Then click Output Data
Click the +
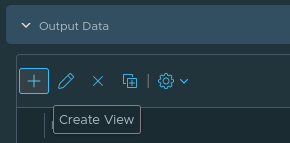
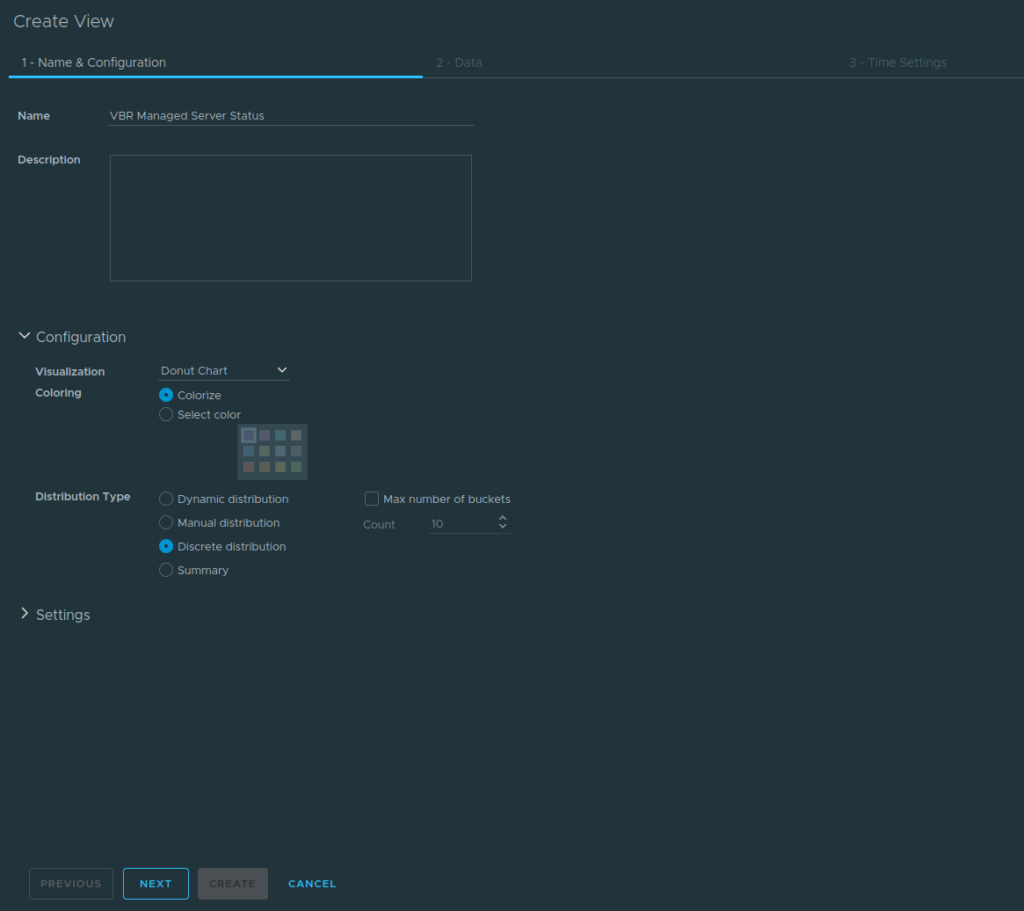
Give the view a name, set the Visualization as Donut Chart, set the Distribution Type to Discrete Distribution and click Next
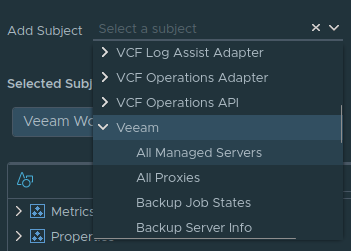
Use the Add Subject drop down to click Veeam/All Managed Servers
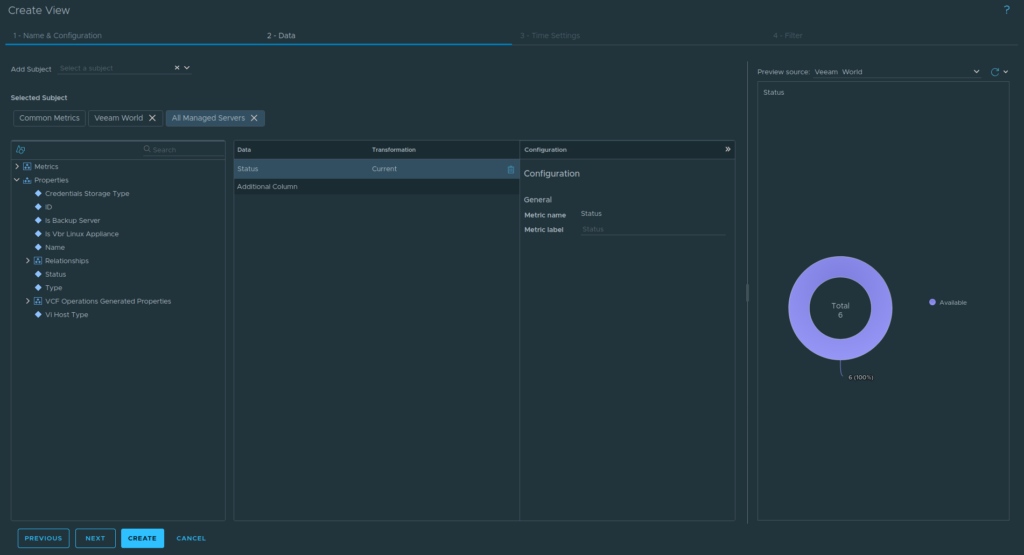
On the Selected Subject, click All Managed Servers, then drag Properties/Status over to the middle column and change the Preview Source on the right to Veeam World, we will then see a visual representation of our server status, click Create
Then click Save
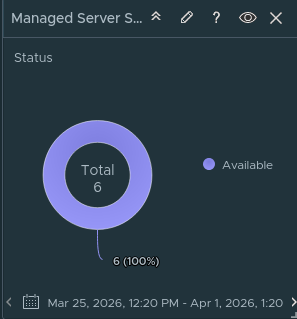
The widget should look like this
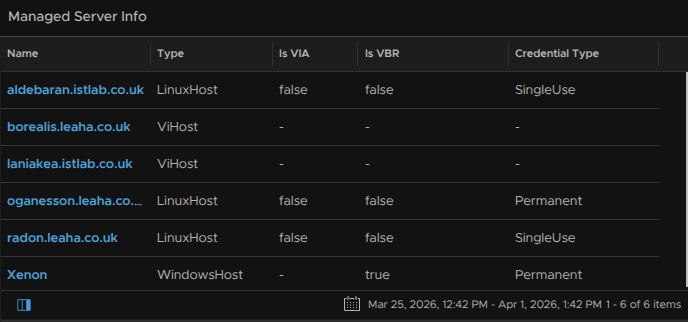
2.1.8 – Managed Server Info
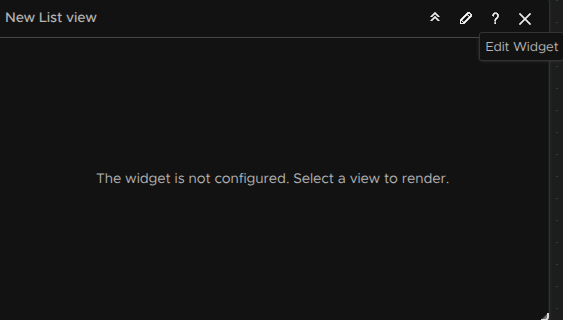
For some information on our managed servers, drag a List View onto the canvas

Click the pencil to edit it
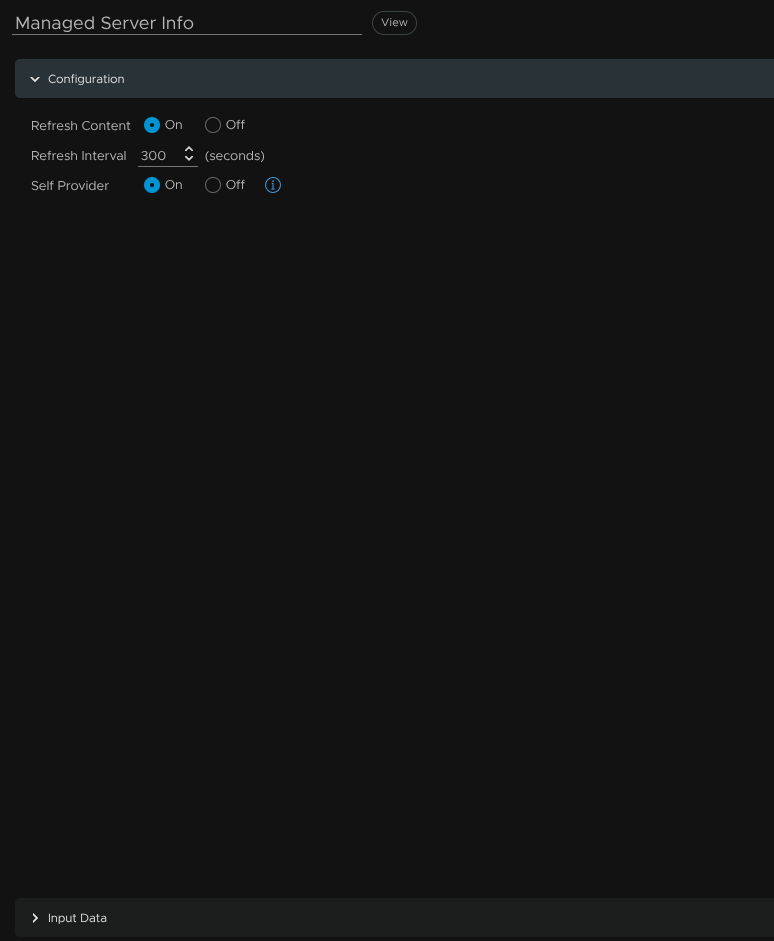
Give it a name, set Refresh Content and Self Provider to On and click Input Data
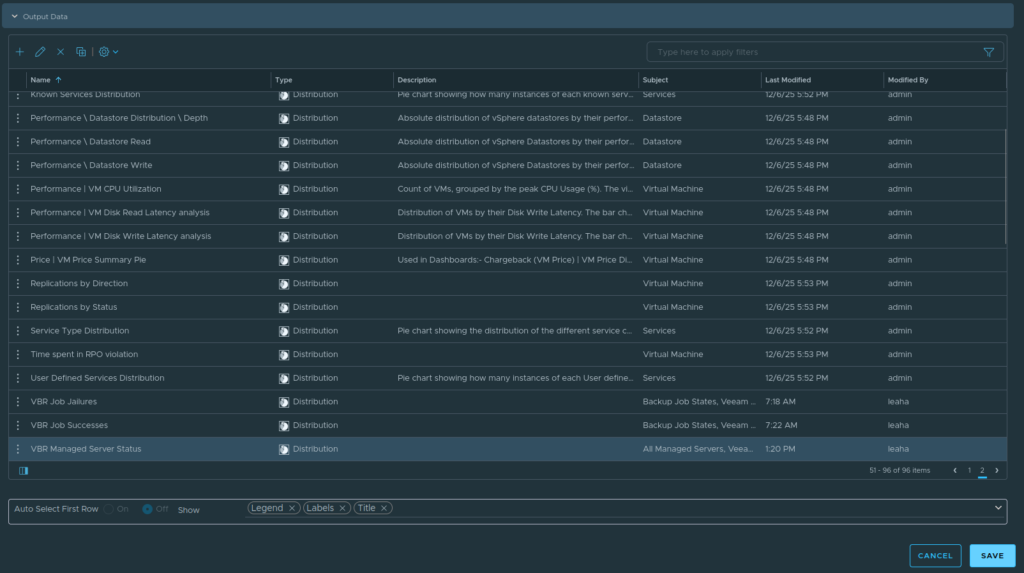
Click the +
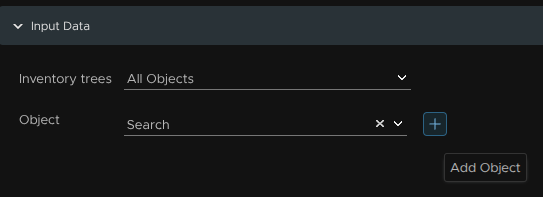
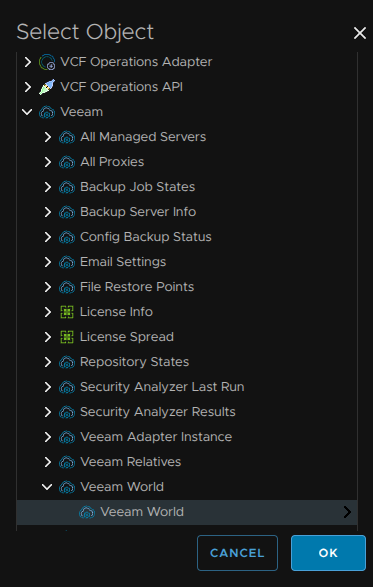
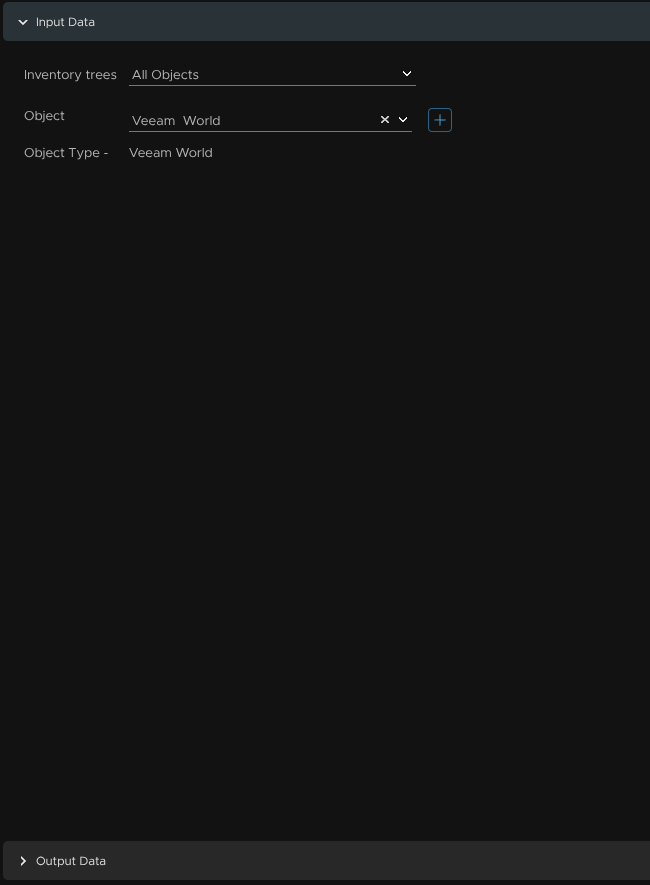
Click Veeam/Veeam World/Veeam World and click ok
Then click Output Data
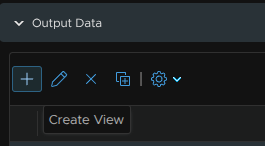
Now click the + to create a new view
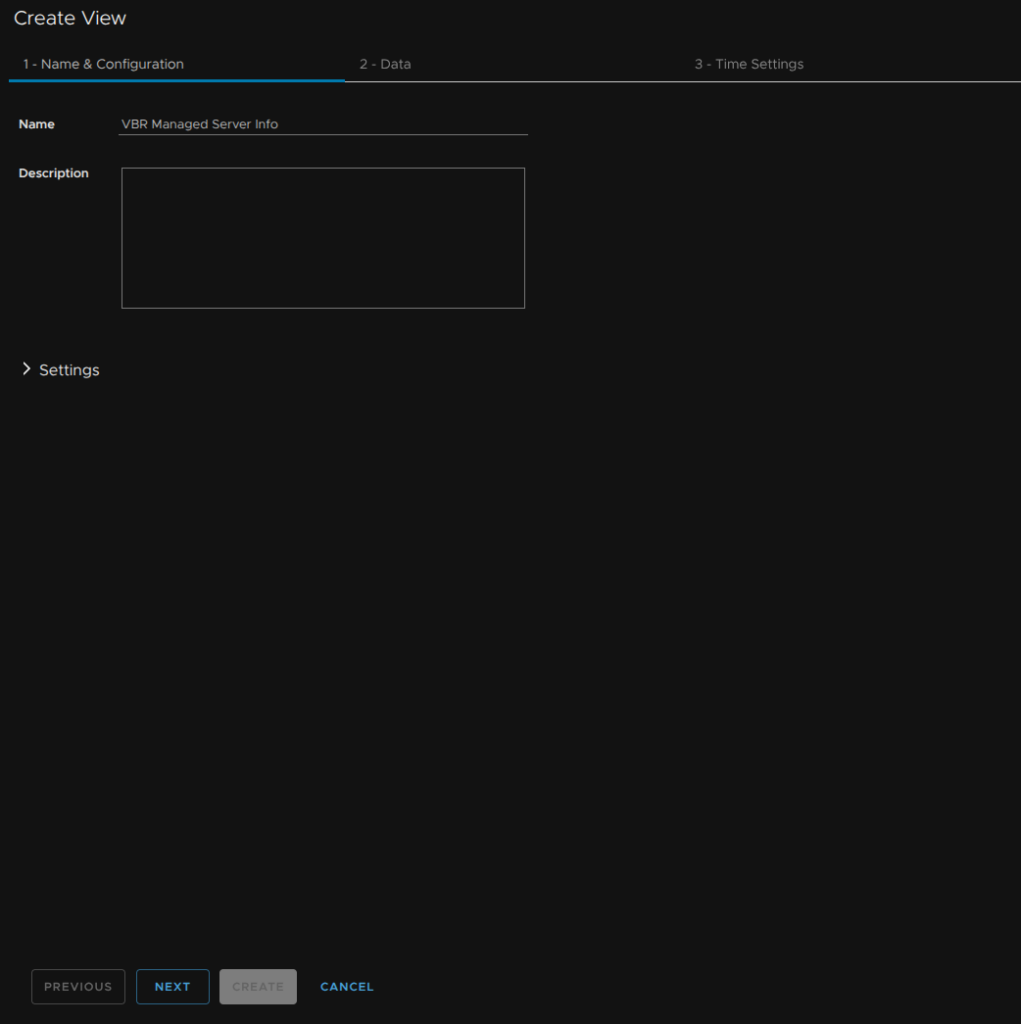
Give it a name and click Next
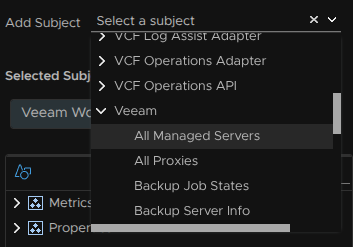
On the Add Subject drop down, select Veeam/All Managed Servers
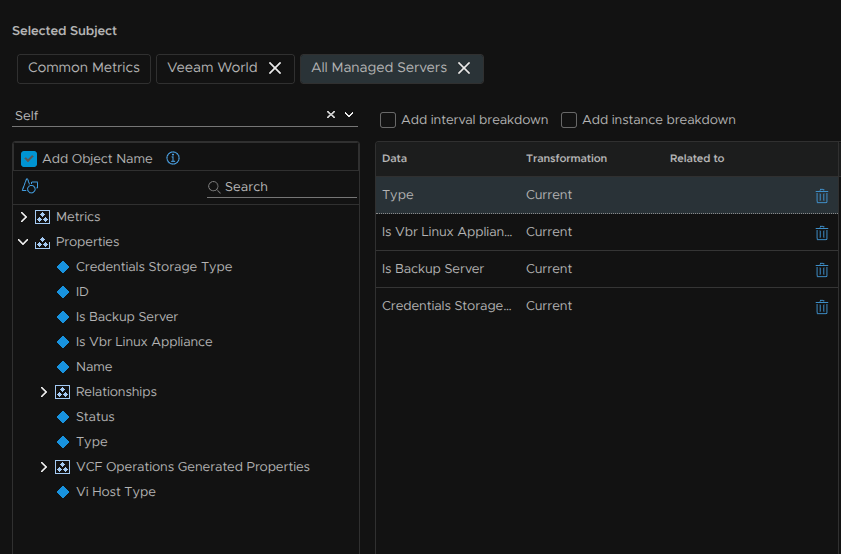
Then click All managed Servers for the Selected Subject, and from the left, drag Type, Is VBR Linux Appliance, Is Backup Server and Credential Storage into the middle box, you can re arrange them in the order you want
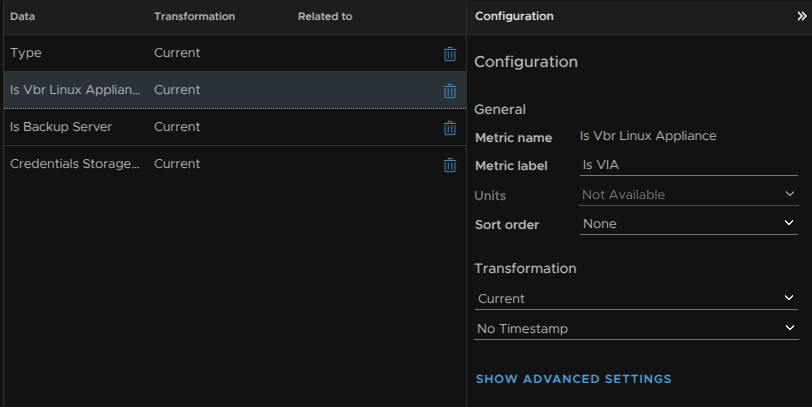
When you select a data point in the middle you can change the label on the right, eg I changed Is VBR Linux Appliance to Is VIA, Veeam Infrastructure Appliance
On the far right, if you change the Review Source to Veeam World, we can see the data, there is however, an entry for Veeam World, which we can leave for now, click Next at the bottom
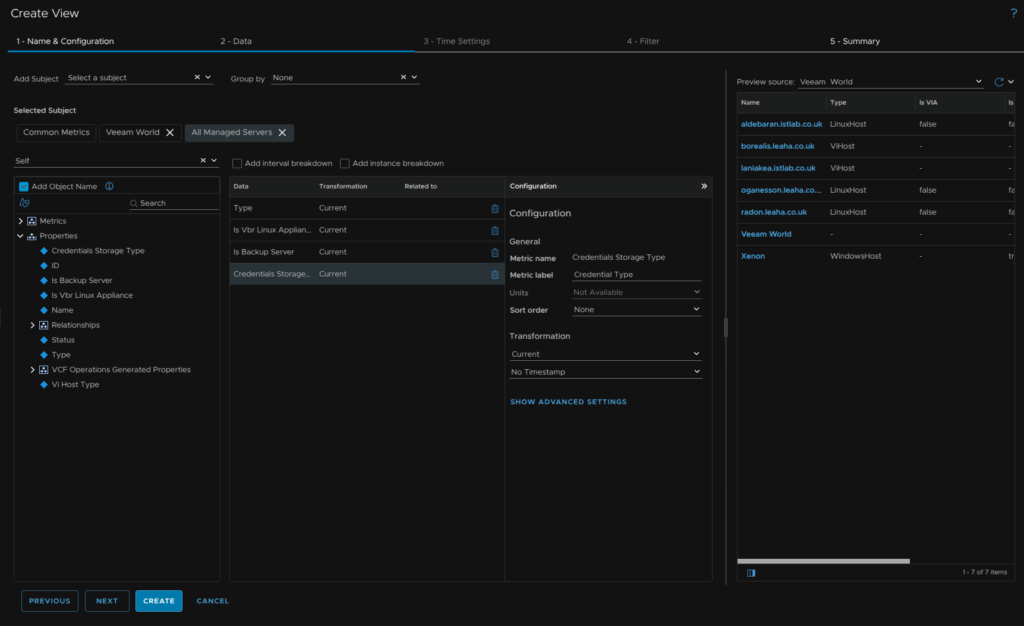
Click Next here
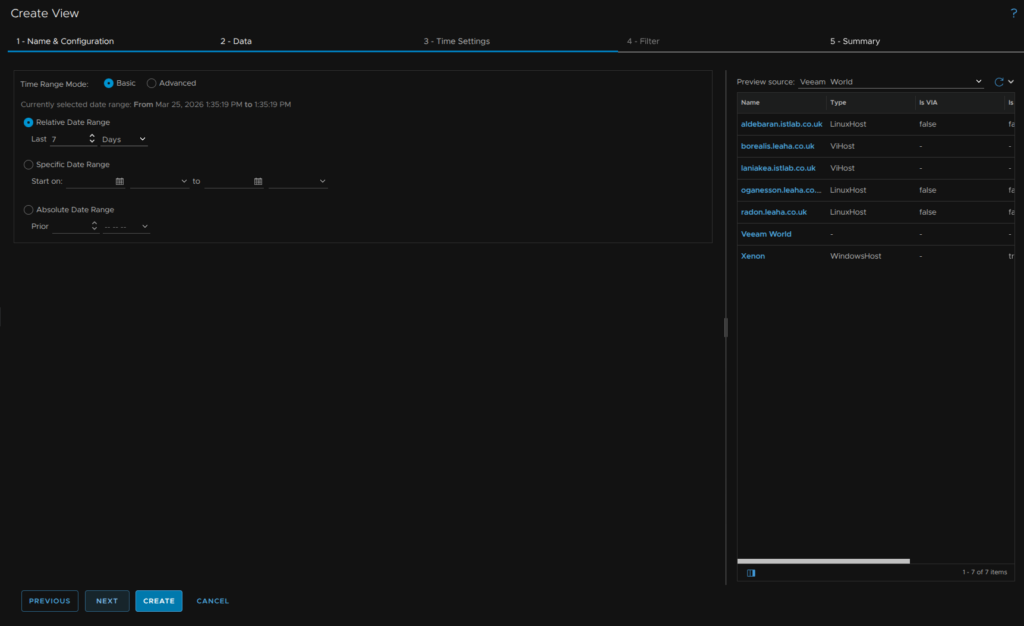
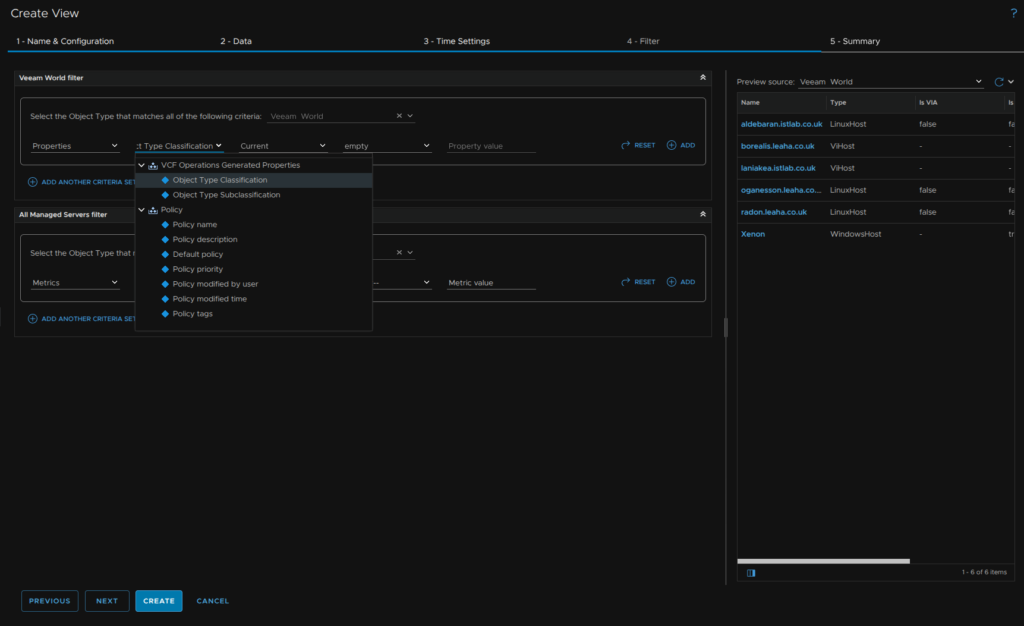
If we look at the Veeam World Filter, and use Properties, VCF Operations Generated Properties/Object Type Classification, Current and Empty, and we refresh the preview, the Veeam World entry is now removed, click Create at the bottom
Then click Save
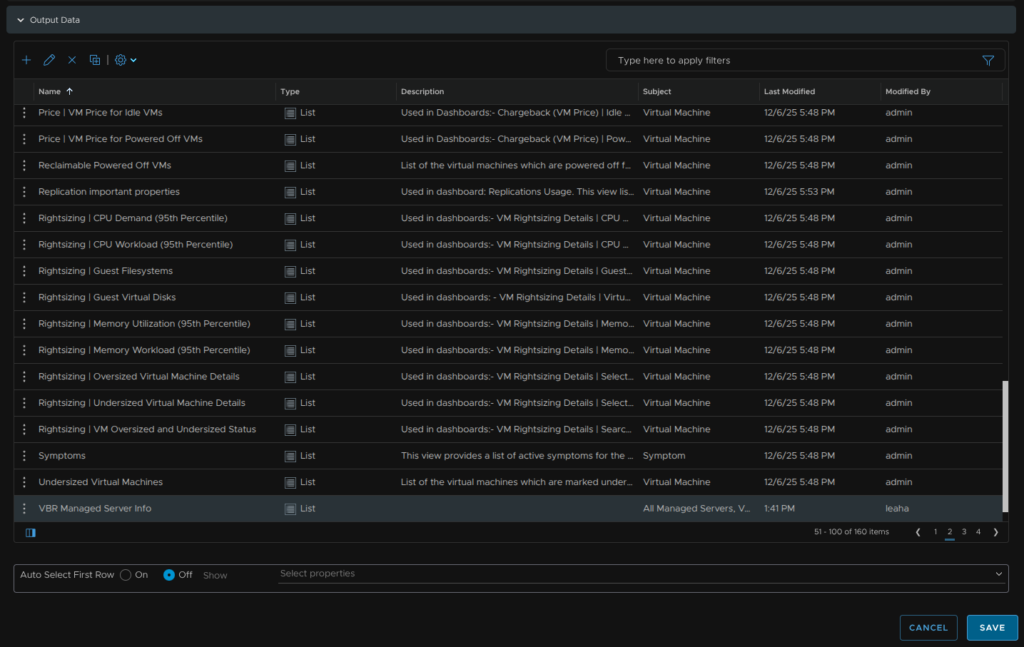
And we should get a widget that looks like this
2.1.9 – Proxy Info
Drag a List View onto the canvas

Click the pencil to edit it
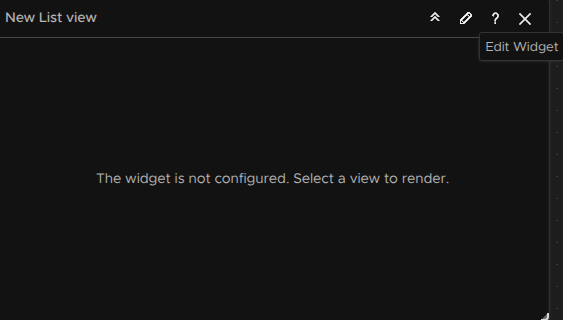
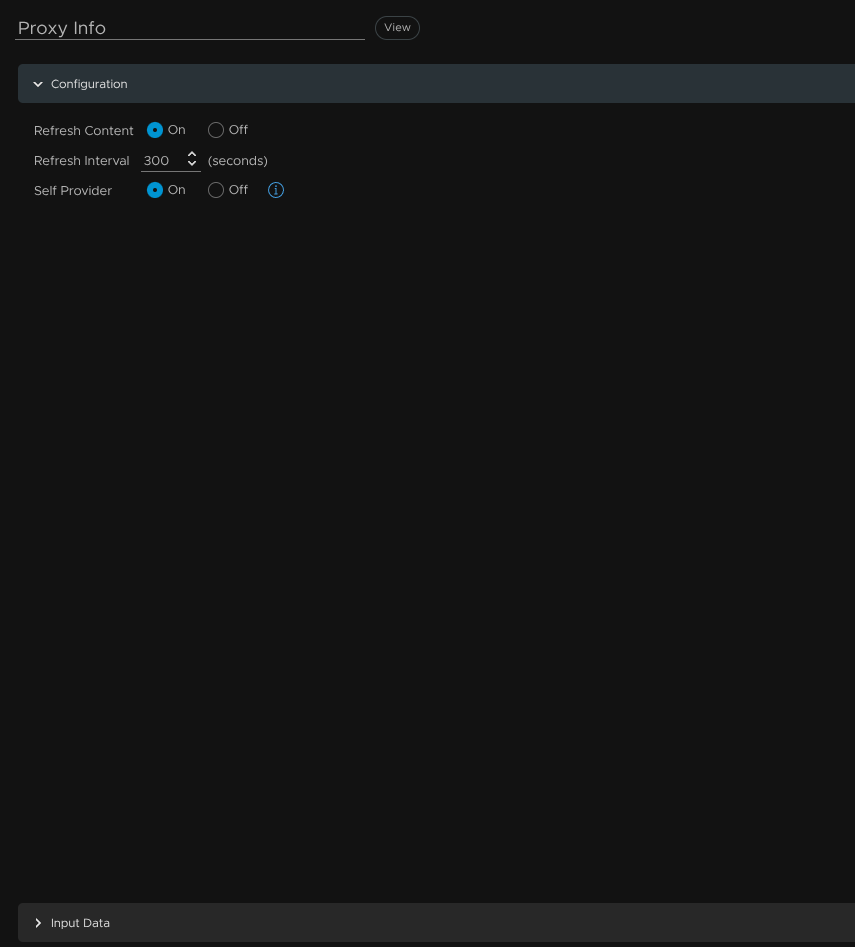
Give it a name, set Refresh Content and Self Provider to On and click Input Data
Click the +
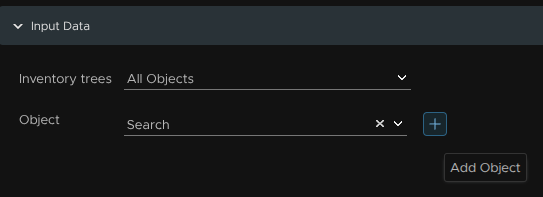
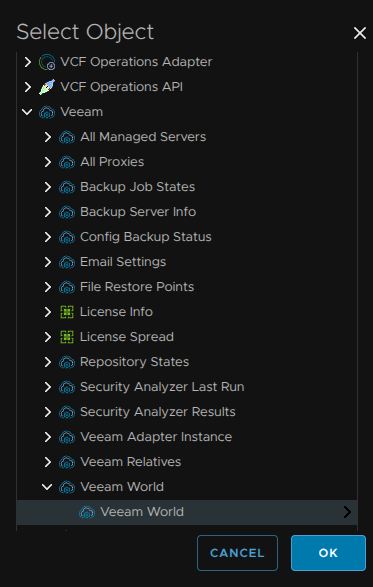
Click Veeam/Veeam World/Veeam World and click ok
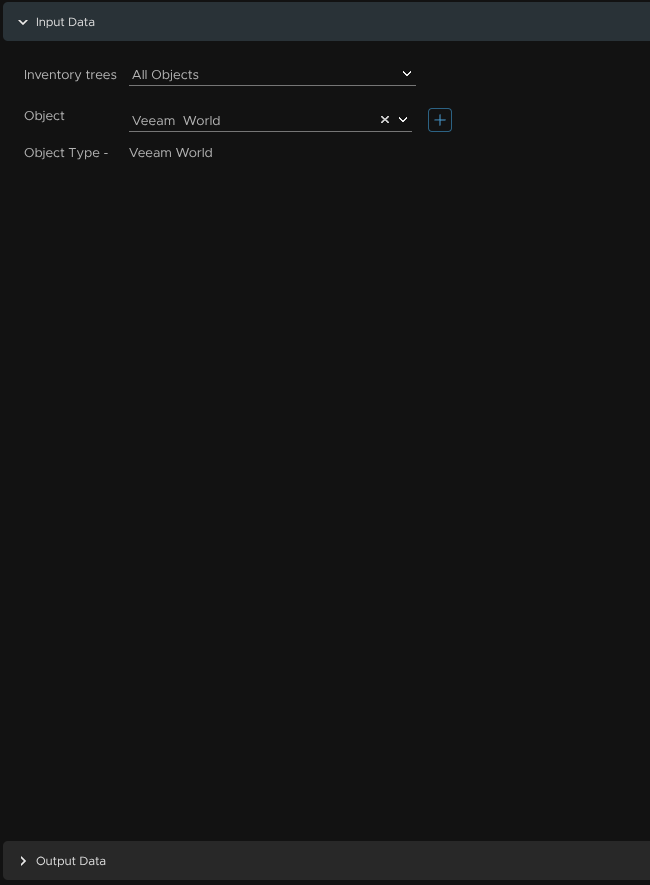
Then click Output Data
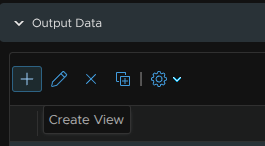
Now click the + to create a new view
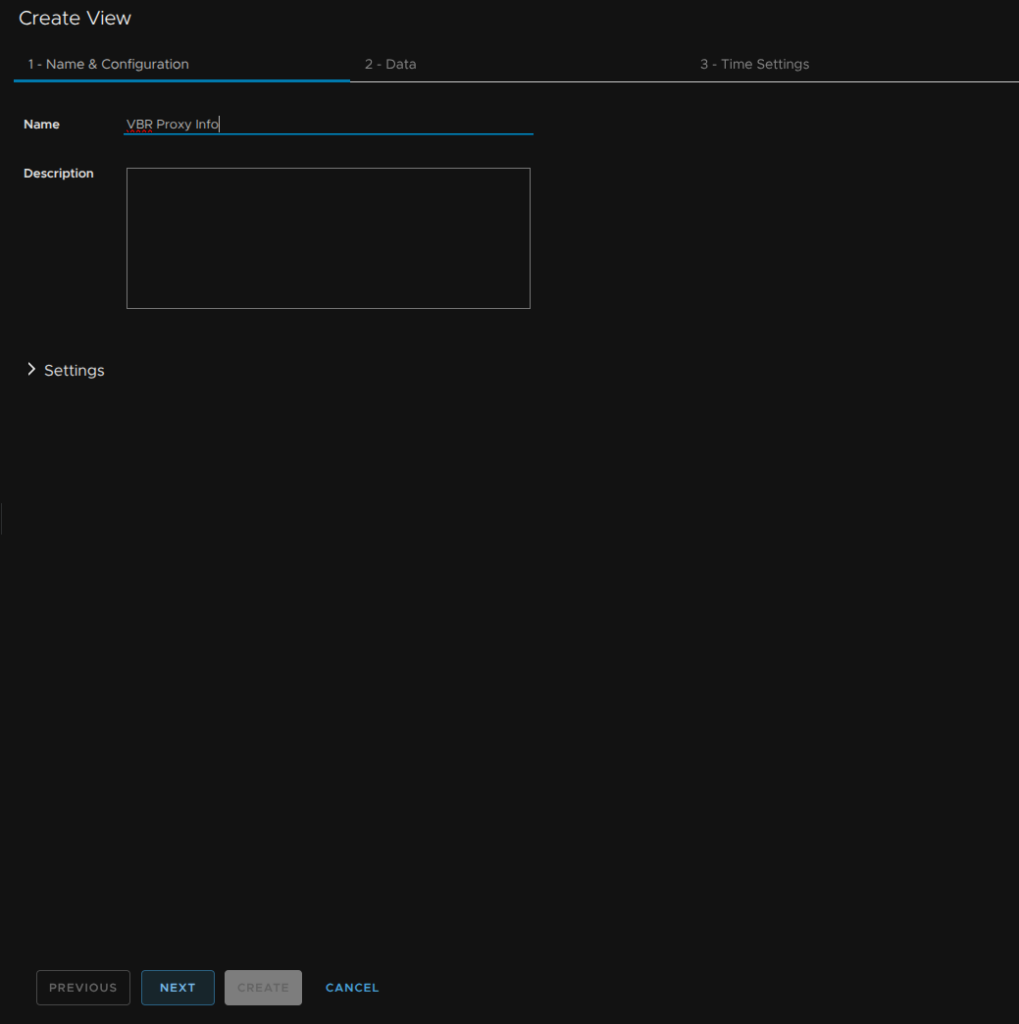
Give it a name and click Next
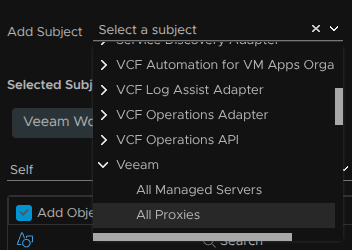
On the Add Subject drop down, select Veeam/All Proxies
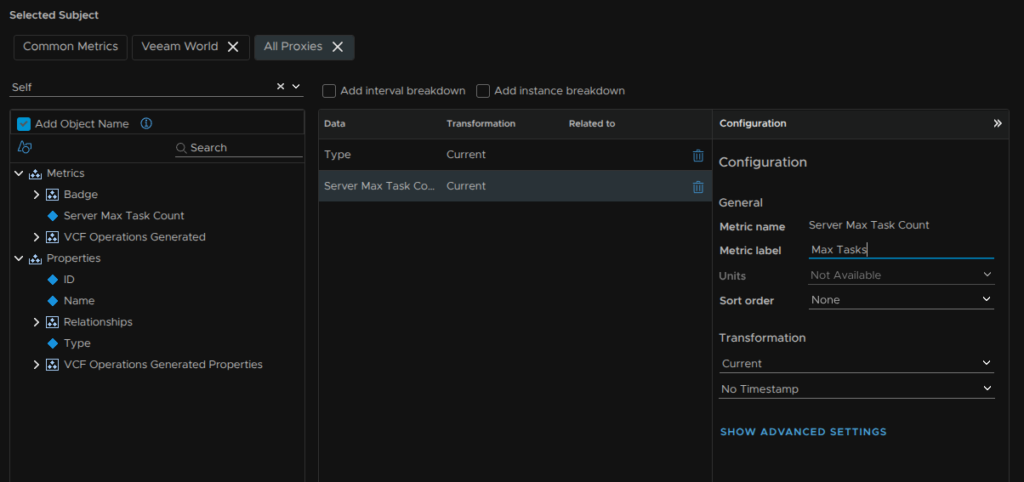
For the Selected Subject, click All Proxies, then drag Metrics/Server Max Tasks Count and Properties/Type onto the middle section, we can drag to re arrange their order, then if we select an object from the middle area, on the right we can edit the label if needed
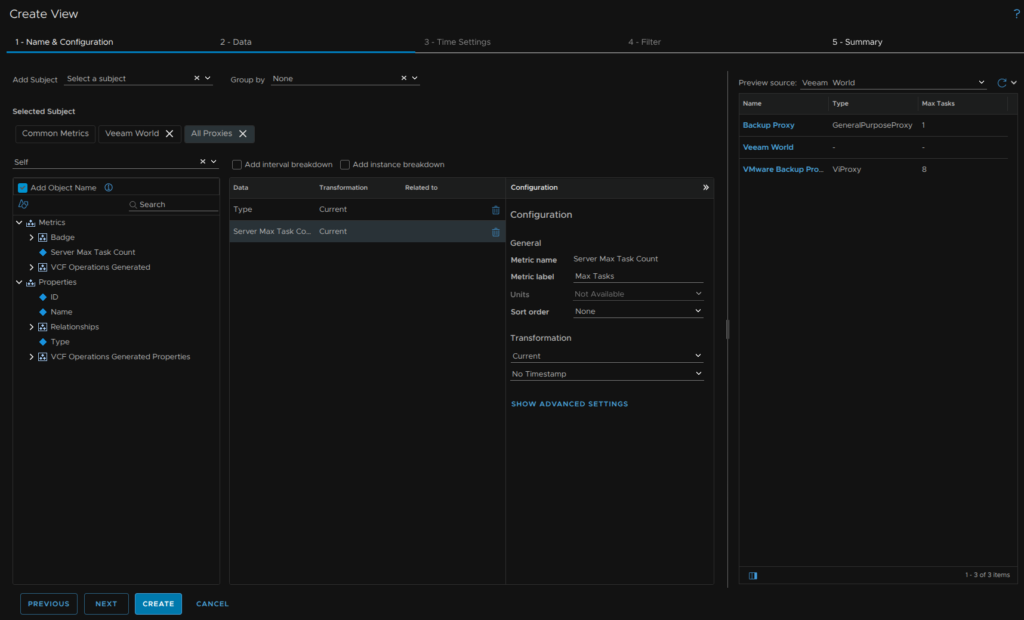
On the far right, change the Preview Source to Veeam World and we can see our populated values, we can ignore the Veeam World entry for now and click Next at the bottom
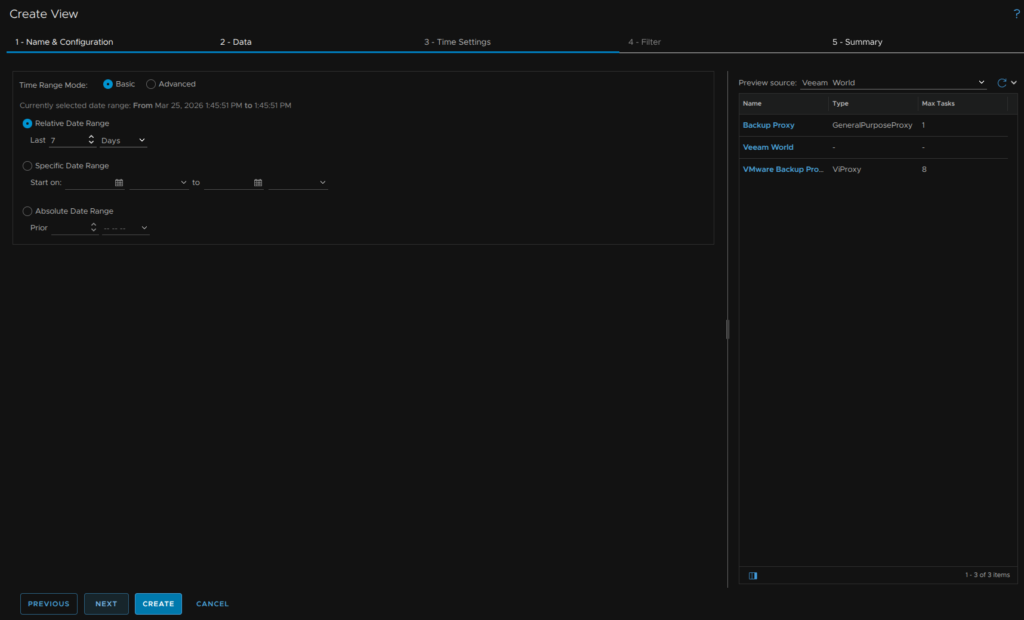
Click Next here
If we look at the Veeam World Filter, and use Properties, VCF Operations Generated Properties/Object Type Classification, Current and Empty, and we refresh the preview, the Veeam World entry is now removed, click Create at the bottom
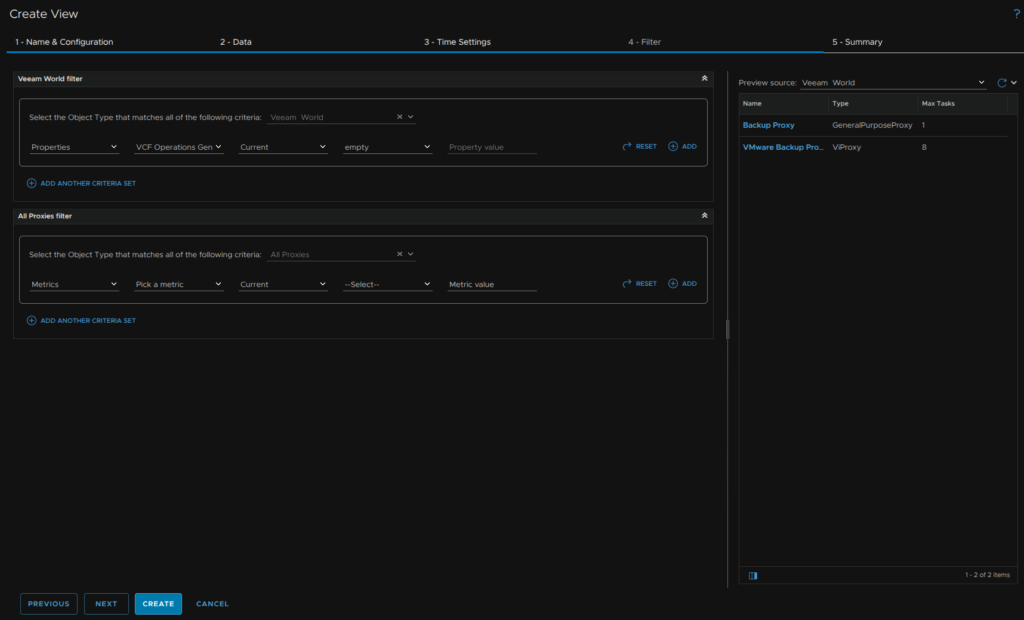
Then click Save
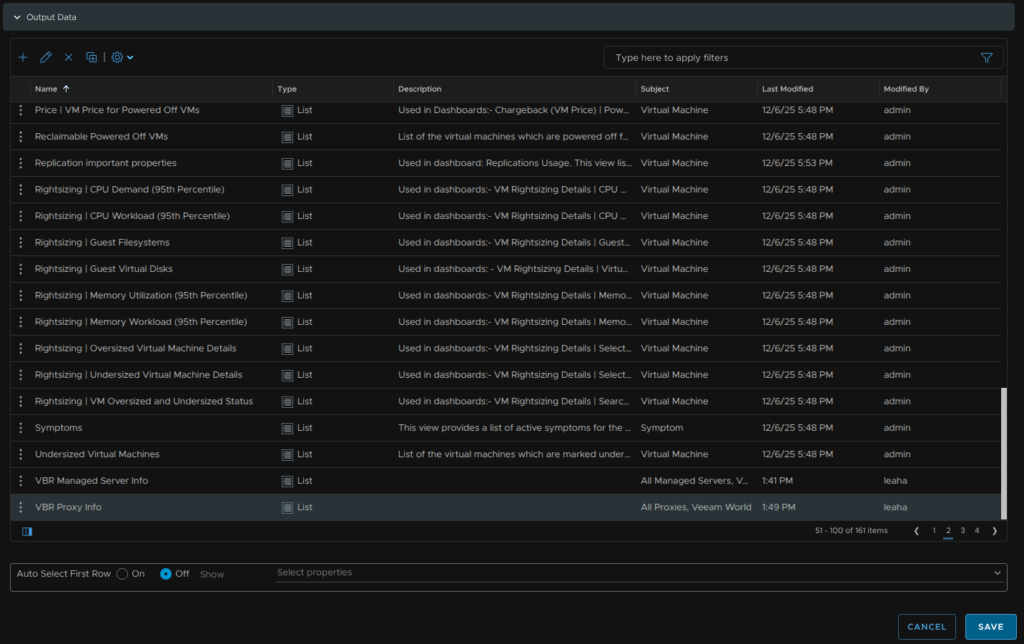
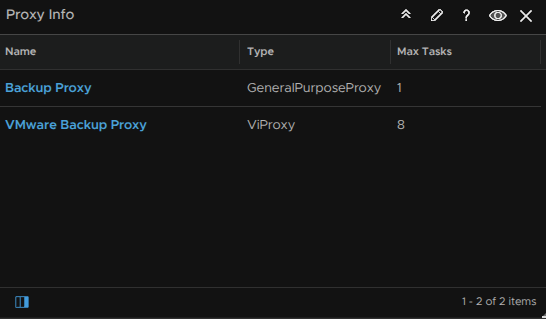
Our widget should then look like this
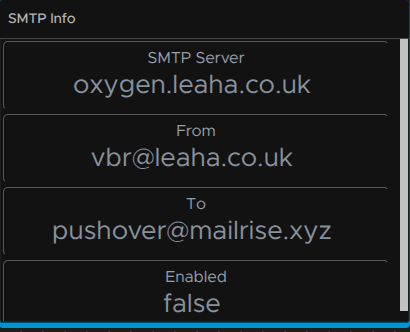
2.1.10 – SMTP Info
For a status widget to show the SMTP configuration drag a Scoreboard onto the canvas, click the pencil to edit the widget
Give it a name, then set Refresh Content and Self provider to On, Box Columns to 1 and Visual theme to Pastel then click Output Data
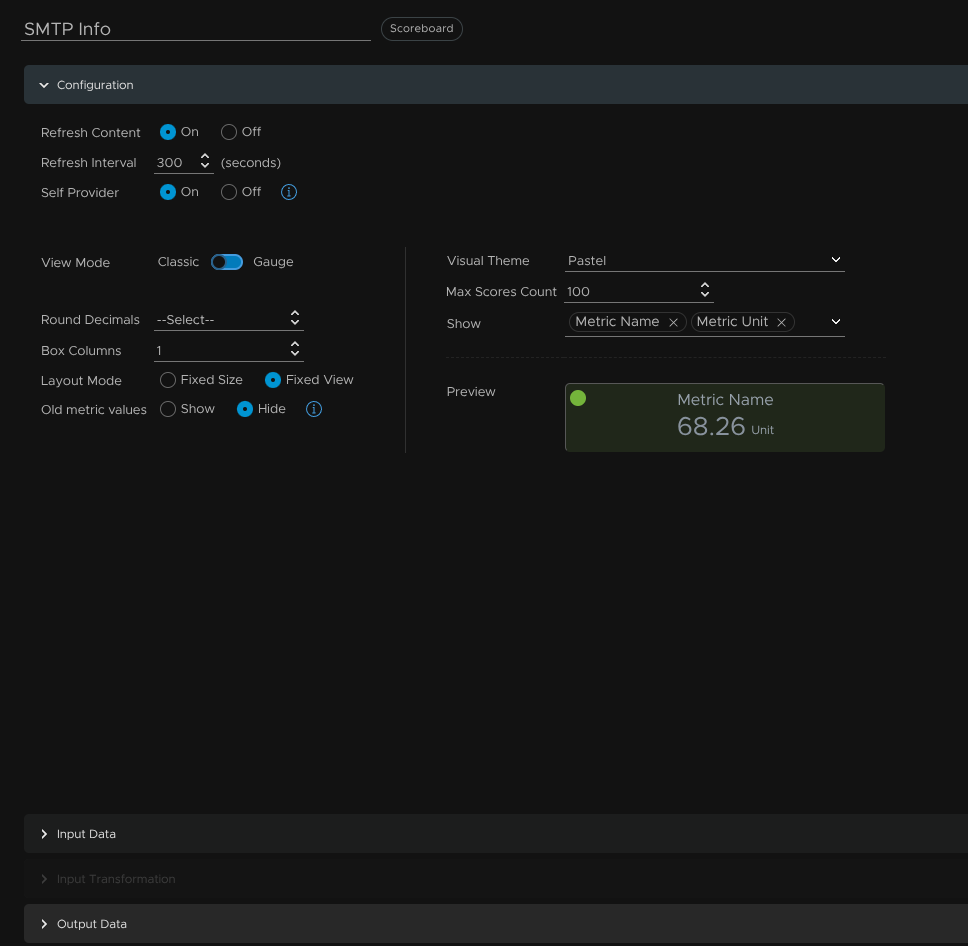
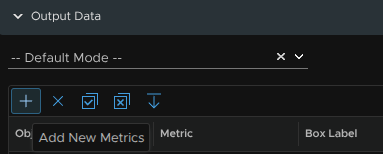
Click the +
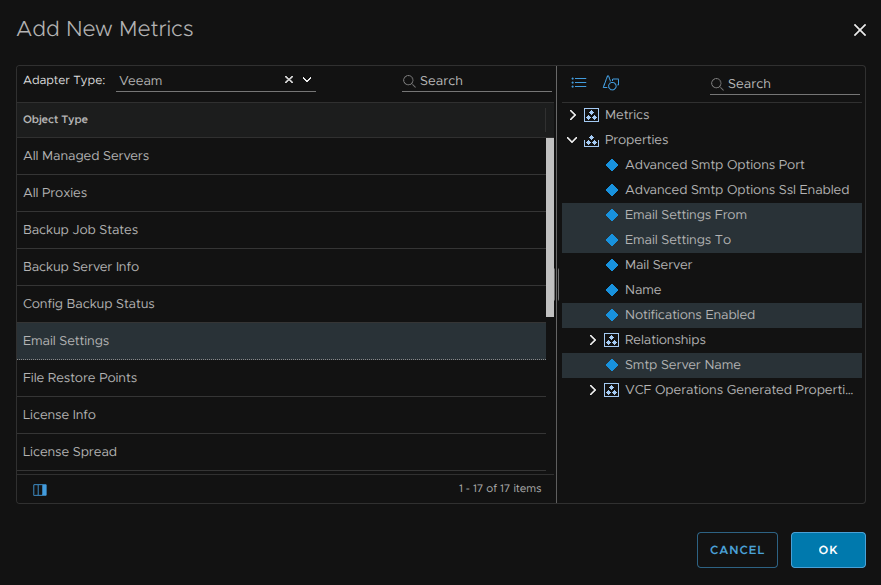
Change the Adapter Type drop down to Veeam, then click Email settings and under Properties click Email Settings From, Email Settings To, Notifications Enabled, SMTP Server Name and click ok
Double click the Box Label to change the name and set the Color Method to None and click Update

You can change the order by dragging them around, when you are happy click Save
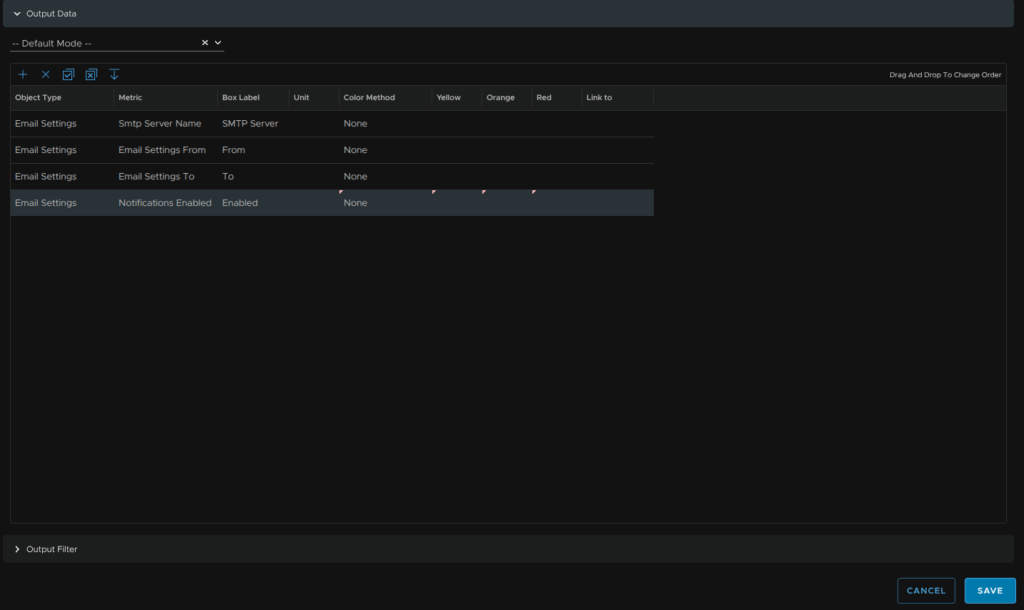
And you should get something like this
2.1.11 – Restore Points
I added this widget to my VM dashboard, which will have a configuration guide with the main VCF Operations 9 article, but thats not been fully finished as of April 2026
Much like the job list, we have a list of all VMs in vSphere, as we have the relationship in section 1, the below widget can show the Veeam restore points for a selected vSphere VM, if the VM isnt backed up by Veeam, no data is given
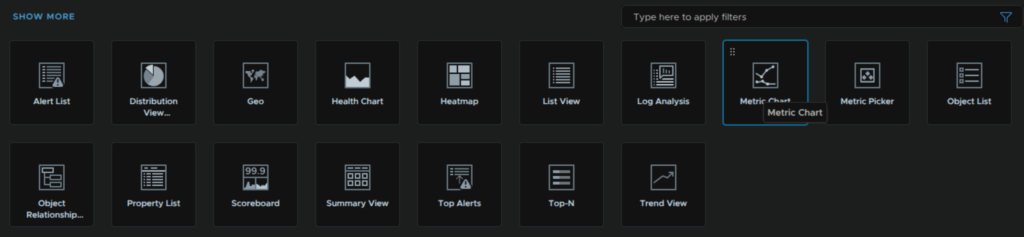
Drag a Metric Chart onto the canvas
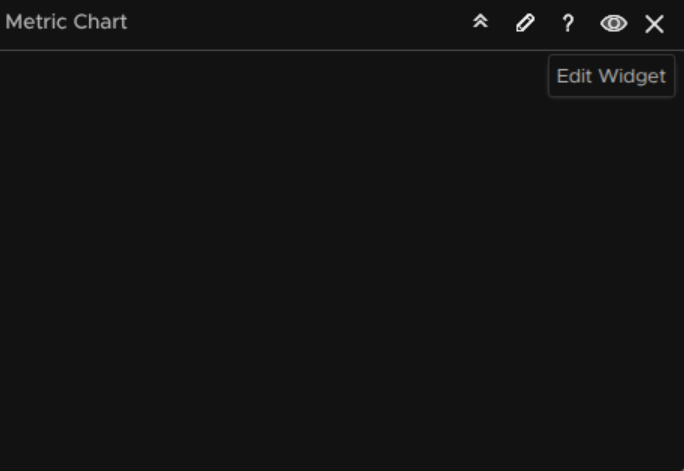
Click the pencil to edit it
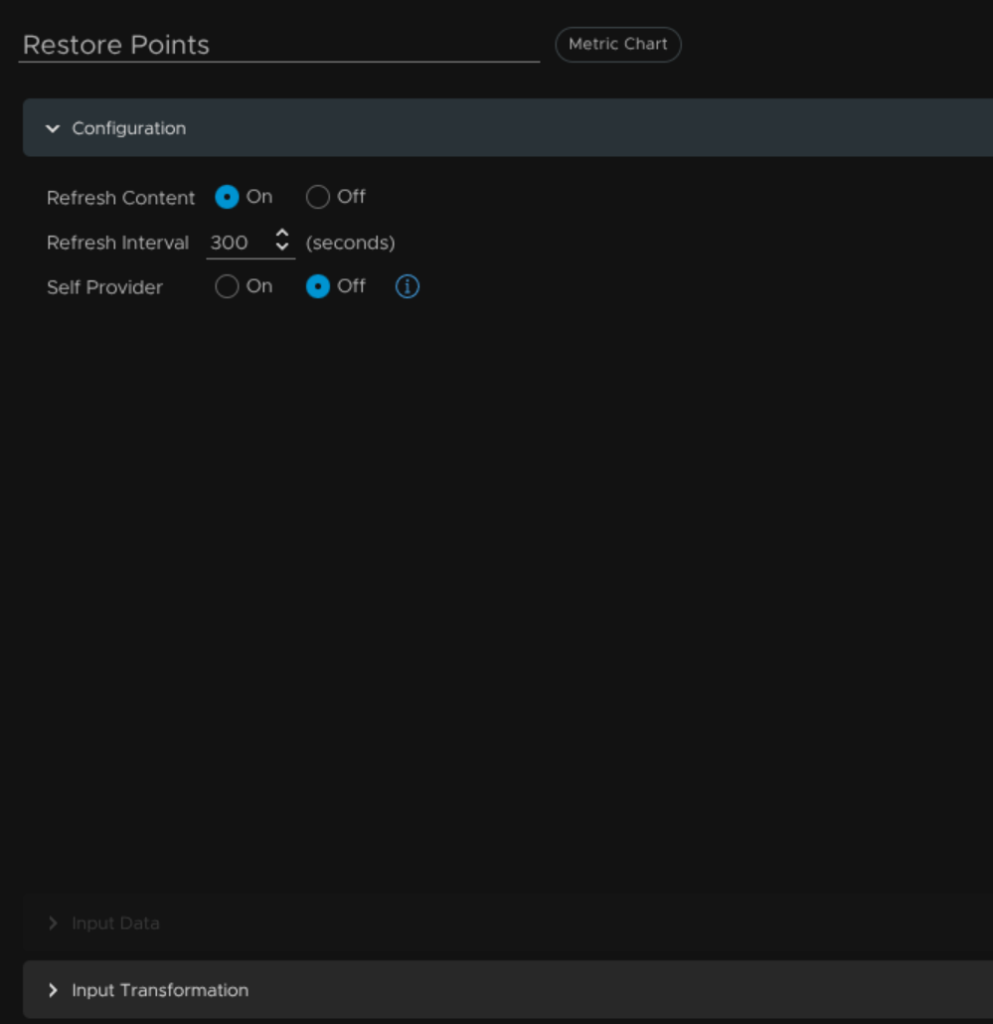
Give it a name and set the Refresh Content to On, Self Provider should be Off, then click Input Transformation
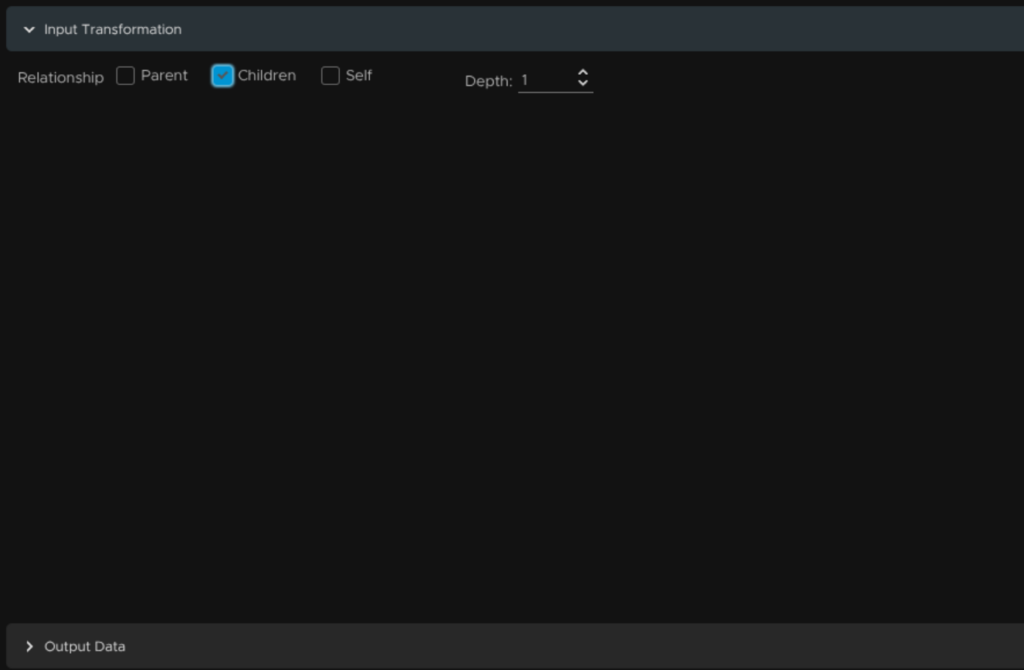
Click Children, the default Depth of 1 will be fine, then click Output Data
Click the +
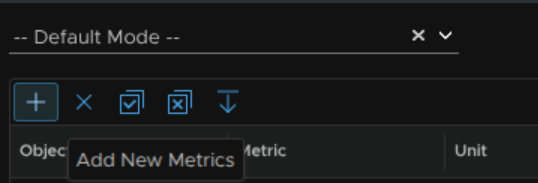
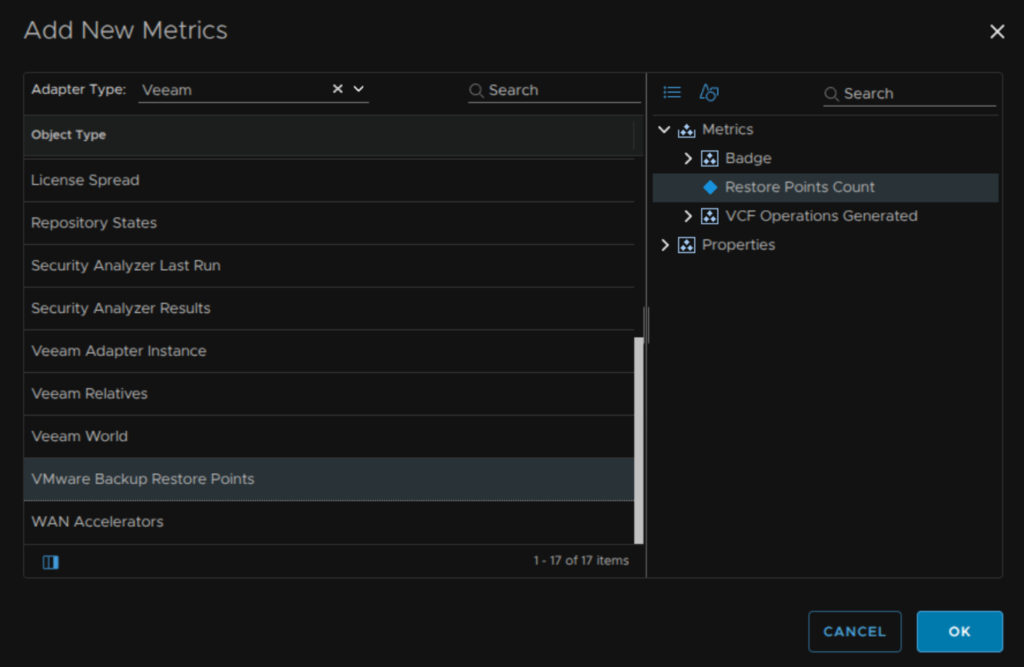
At the top, change the Adapter Type to Veeam, then click VMware Backup Restore Points and on the left click Metrics/Restore Points Count and click ok
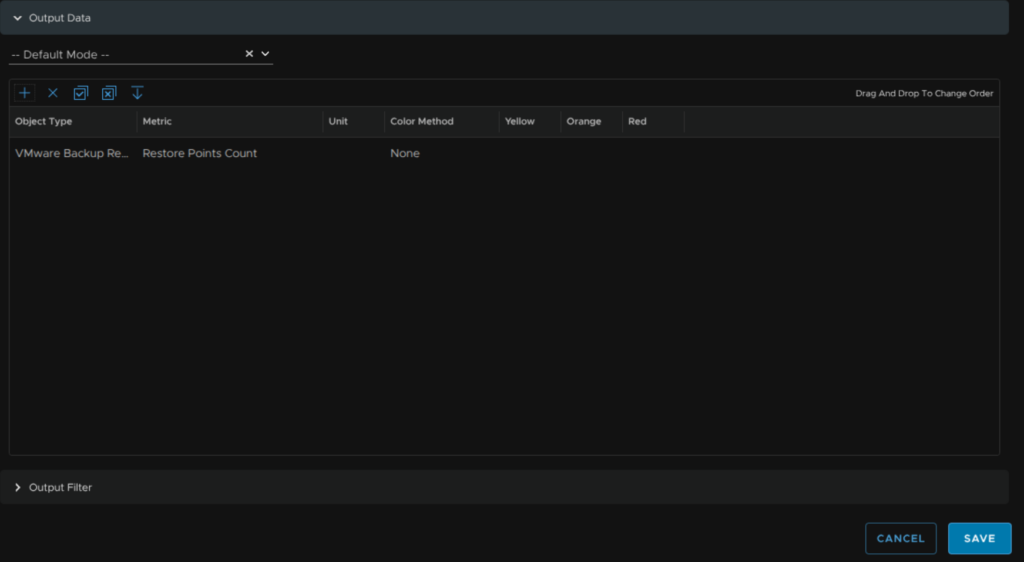
Then click Save
At the top click, Show Interactions

Connect the output from the Powered On VMs list over to the Restore Points widget
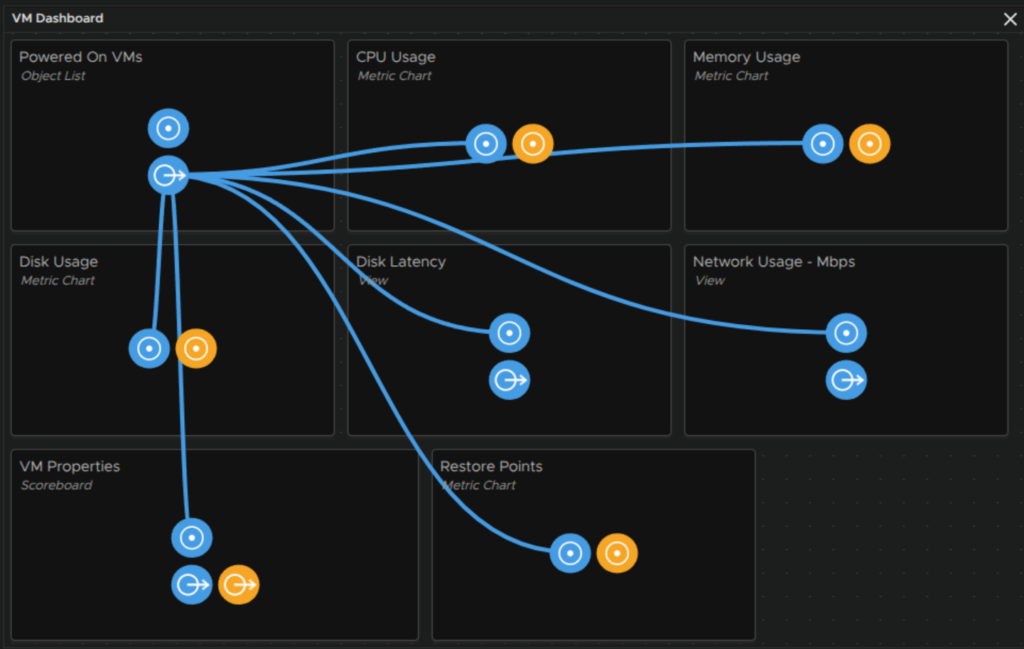
Then click Hide Interactions

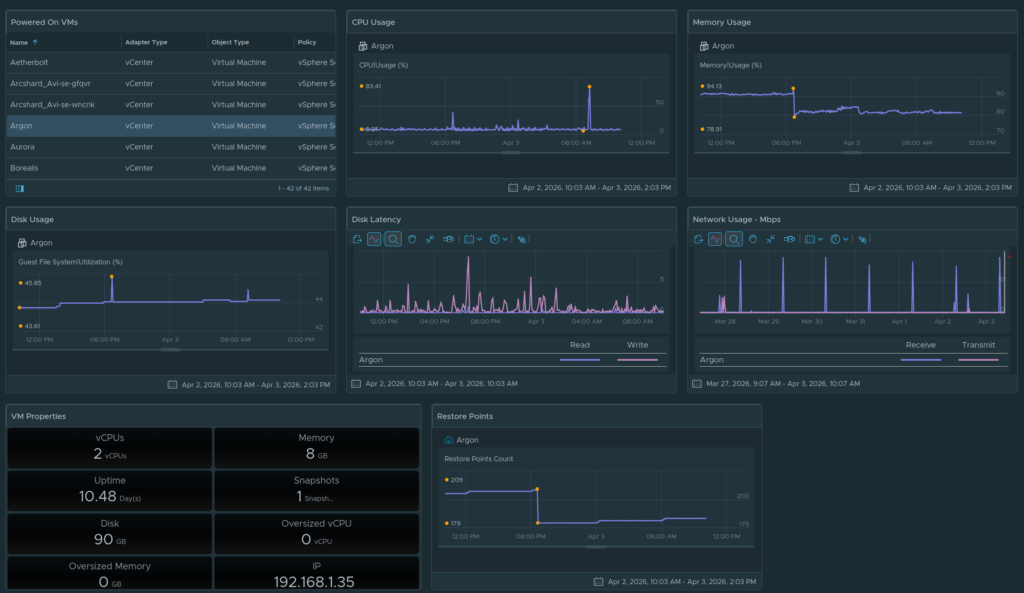
Now if we select a VM that Veeam is backing up, we can see the number of restore points, if the VM isnt being backed up by Veeam no data is displayed
The dashboard looks something like this
2.2 – Power
What widgets you have here will depend entirely on what you are bringing in metric wise
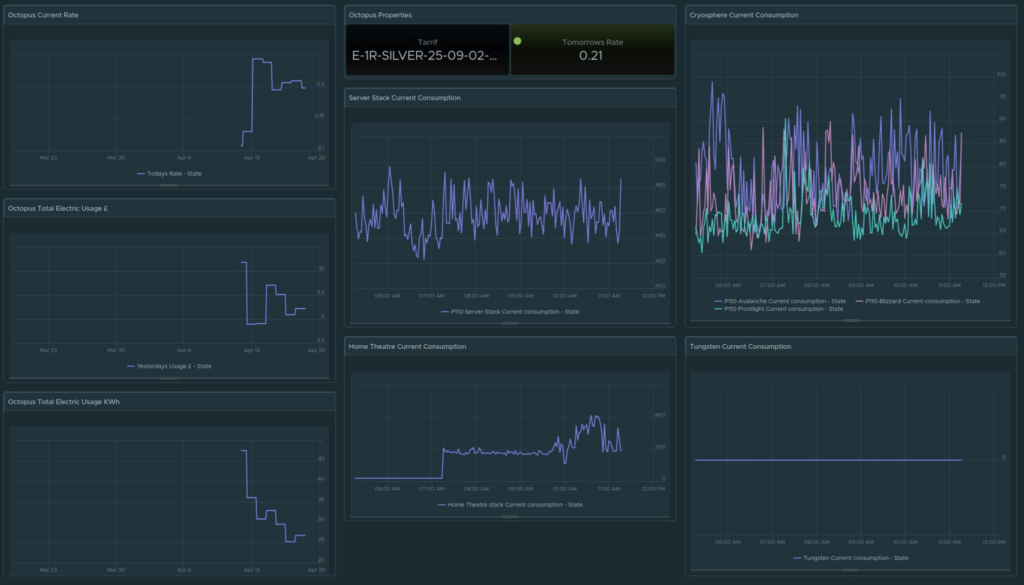
For me, this will be based on my Home Assistant management pack bringing data in as a general idea of a dashboard you could create
2.2.1 – Creating The Dashboard
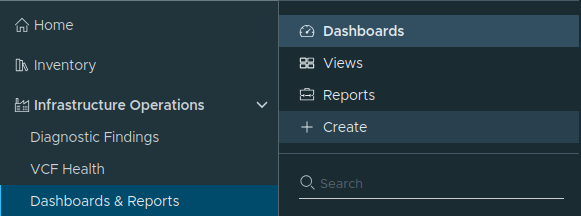
Before we can add any widgets, we need to create the dashboard, to do this, open VCF Operations and click Infrastructure Operations/Dashboard And Reports then click Create
Give it a name and click Save

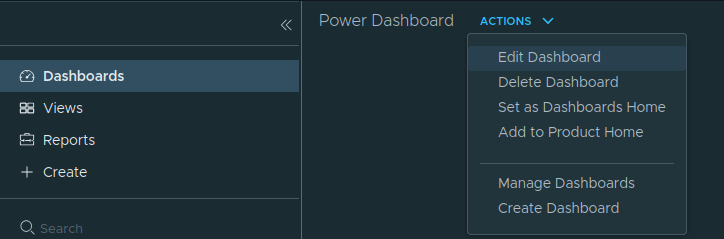
Now we have the dashboard, click Actions/Edit Dashboard and we can begin adding Widgets
2.2.2 – Smart Plug Power Monitoring
This section will walk you through creating a metric chart for power data being received from my smart plug, I have 5 of these, so we will go through the first and you can create this for any other devices like this you may have
Drag a Metric Chart onto the canvas

Click the pencil to edit the widget
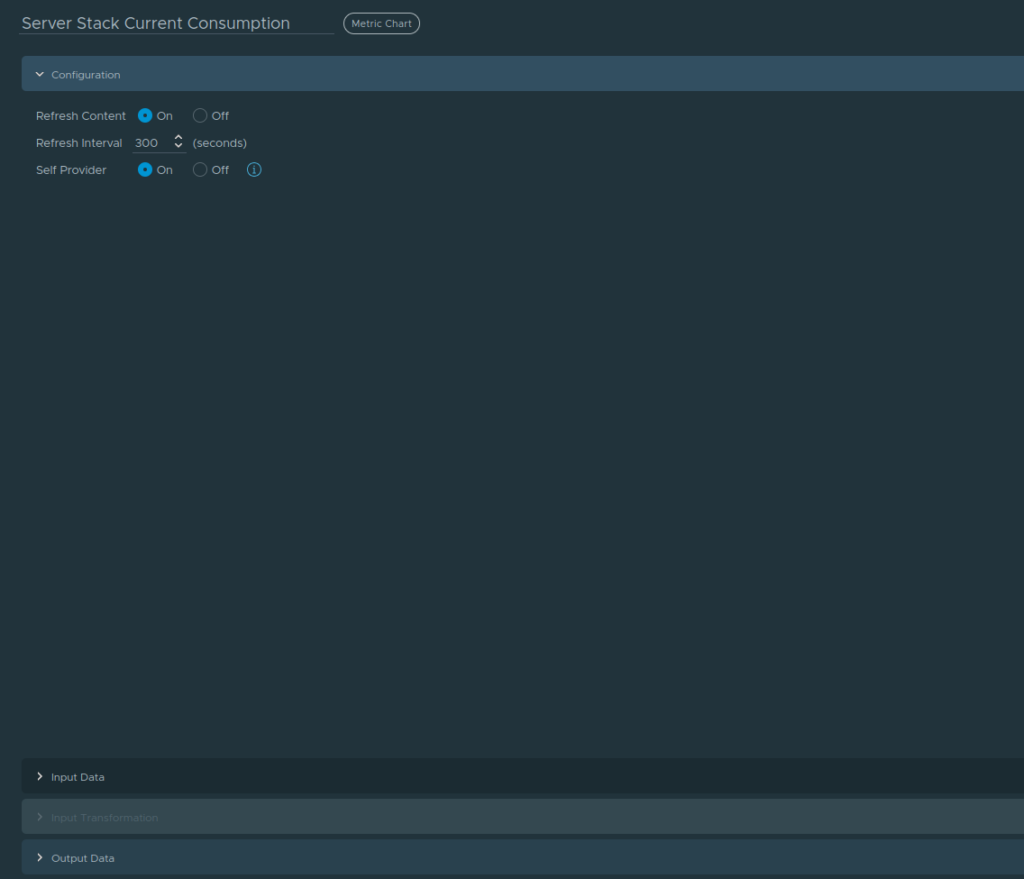
Give the widget a name, set Refresh Content and Self Provider to On and click Output Data
Click the +
Change the Adapter Type to Home Assistant, and find the entry for the endpoint you want to monitor, in my case, the Server Stack Current Consumption, and my power data is under Metrics/State, then click ok
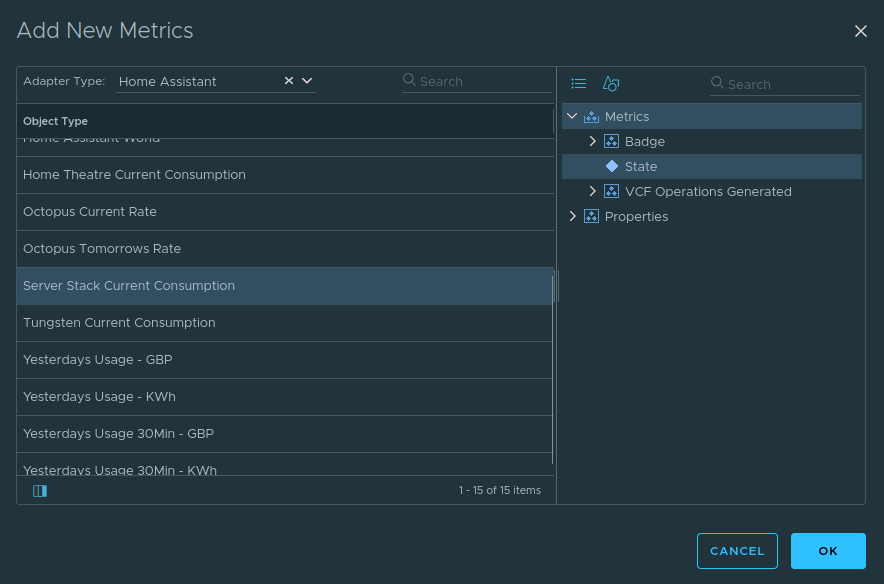
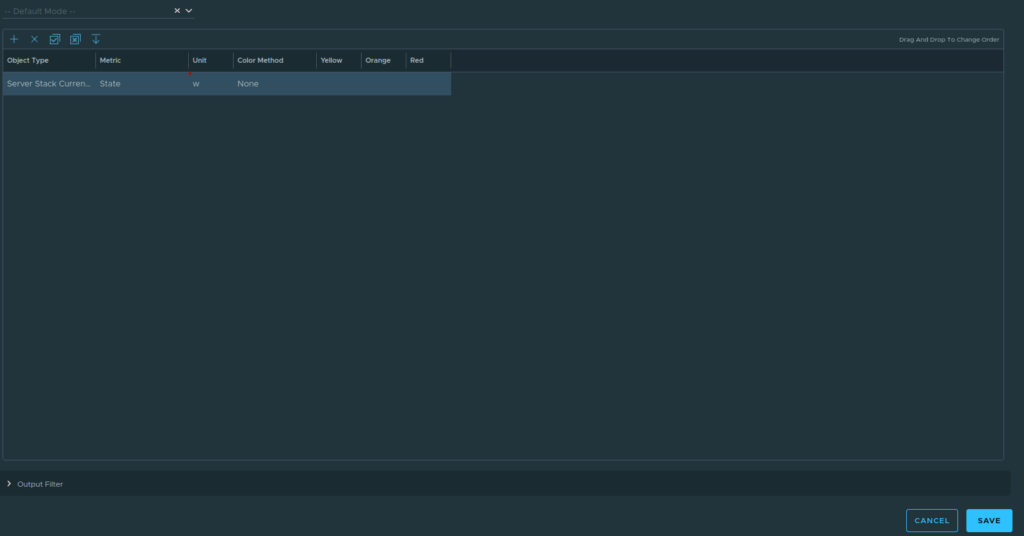
Double click the Unit and add w for watts, then click Update

Then click Save
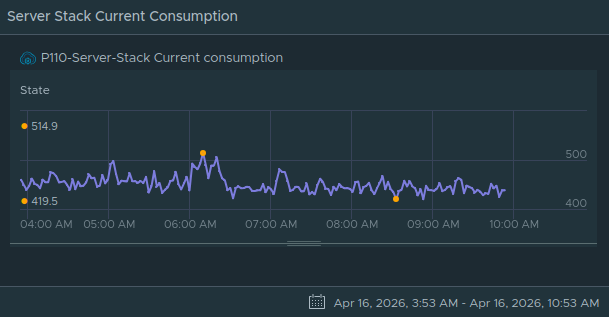
And you should see a widget like this
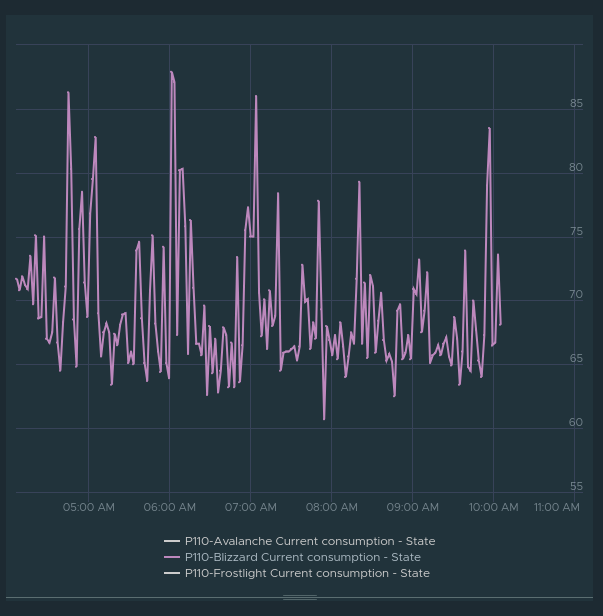
One thing I did, was take the three servers making up a cluster, and rather than adding just a single output, the state object, I added the ones for those servers, all into one metric chart
What you can then do is click the eye on the widget and click the first icon on the left, as shown, to combine them into a single chart

You can use the little tab at the bottom to extend it
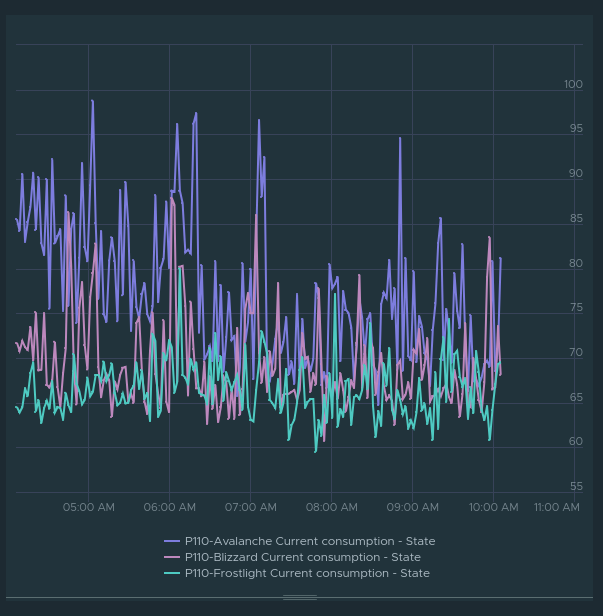
And if you click any of the entries, they are removed from the chart
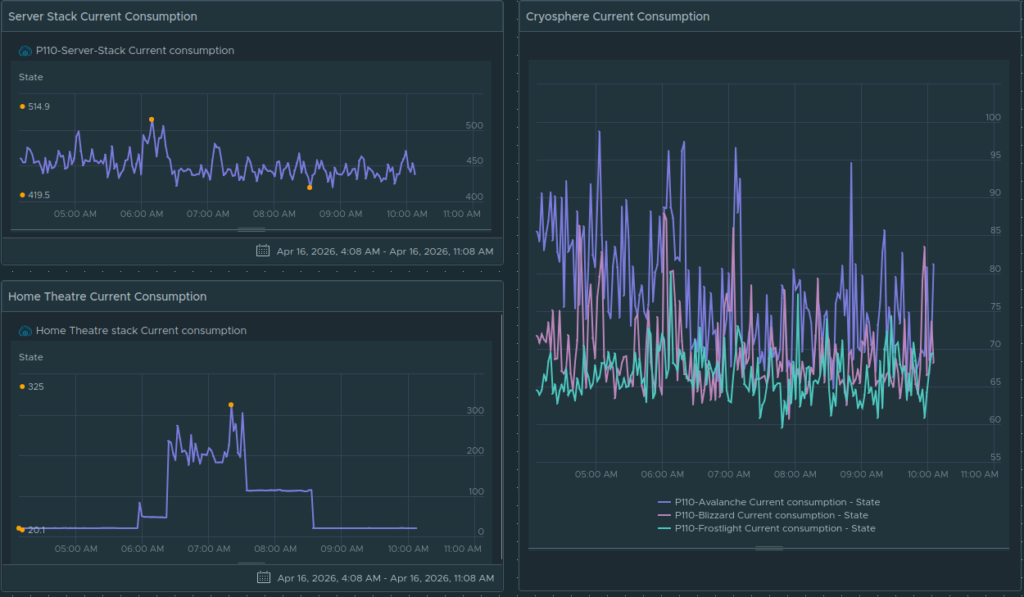
I created these widgets for my power stats
2.2.3 – Octopus Power Rates
In this section we will have a look through creating some metric charts for power rates in Octopus
How you put this into your setup will depend on what data you are pulling in
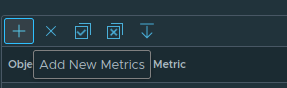
Drag a Metric Chart onto the canvas

Click the pencil to edit the widget
Give the widget a name, set Refresh Content and Self Provider to On and click Output Data
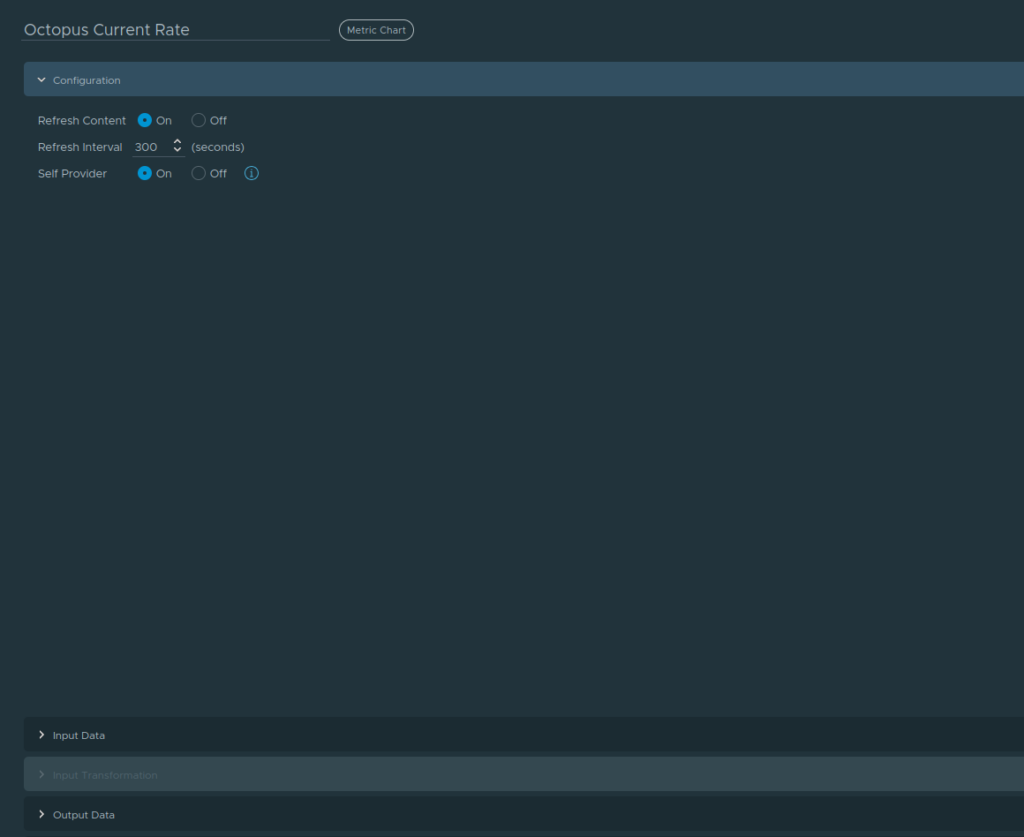
Click the +
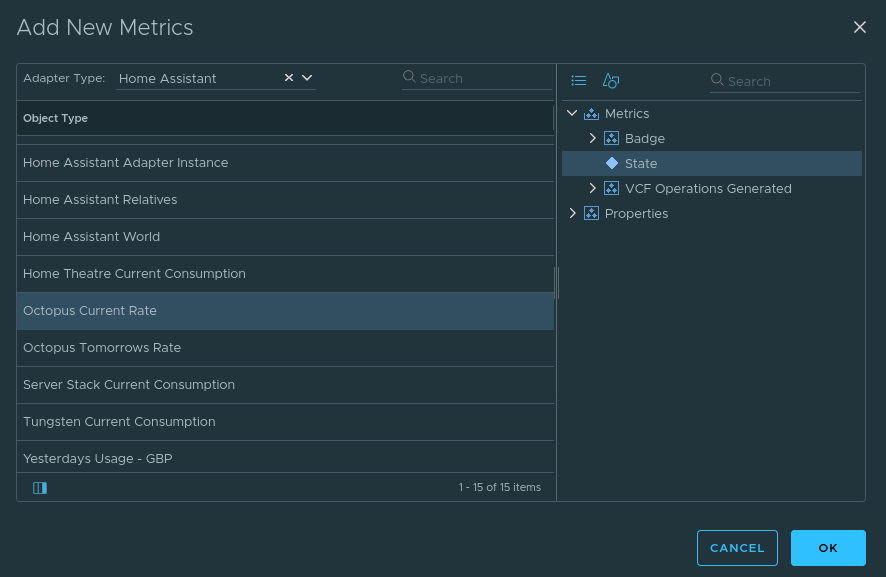
Change the Adapter Type to Home Assistant, find the entry for the current rate in Octopus, my rate data is in Metrics/State, click ok
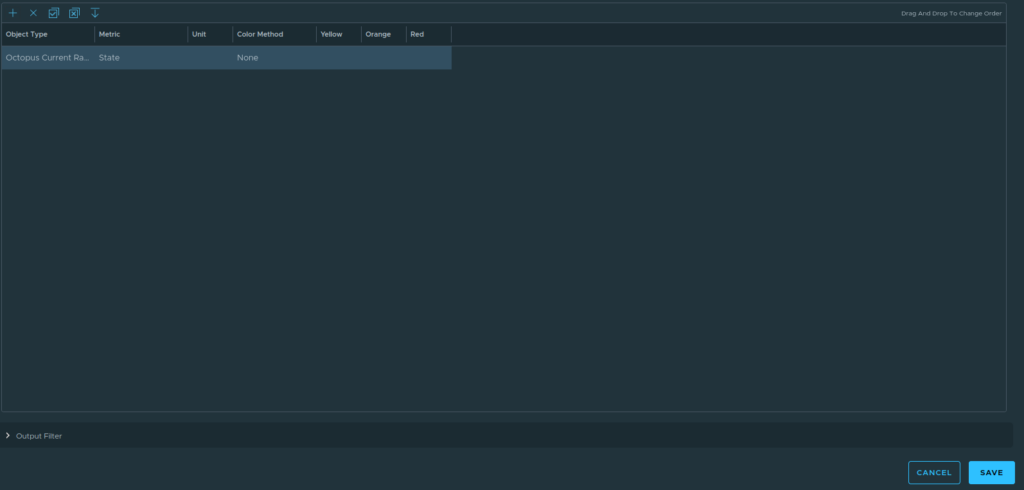
Click Save
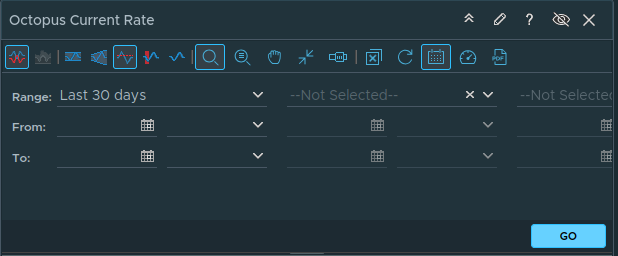
Now, this value only changes once per day, click the eye in the top right of the widget, then click the calendar icon, third in on the right, then set the range to Last 30 Days, then click Go
We can hide the bar with the Eye icon, and we can see a fixed 30 days of the rate
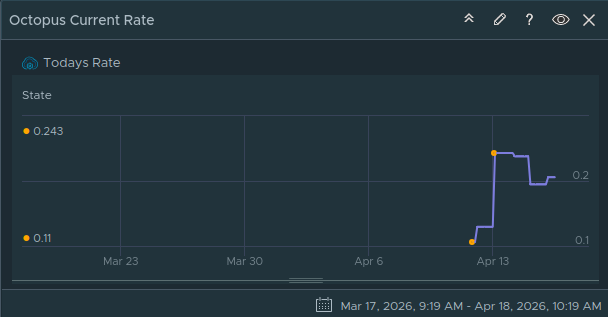
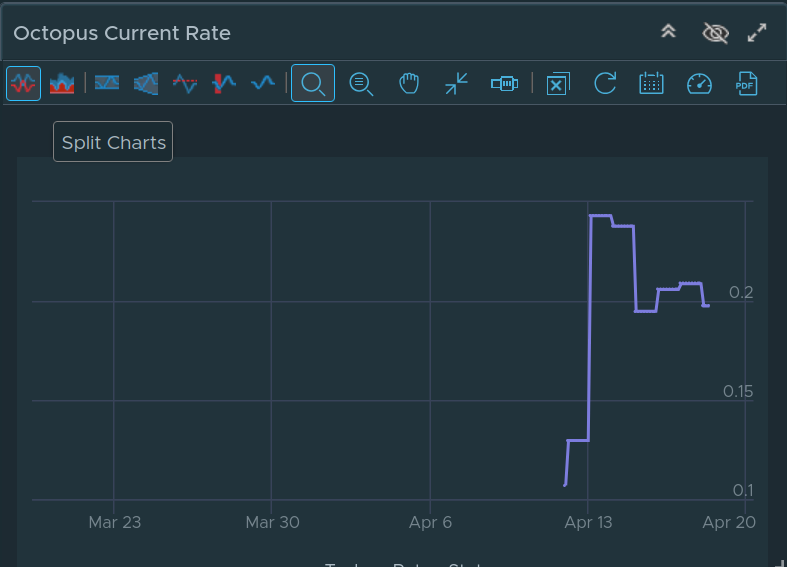
We can also use the far left icon to disable the Split Charts option to make it look like this
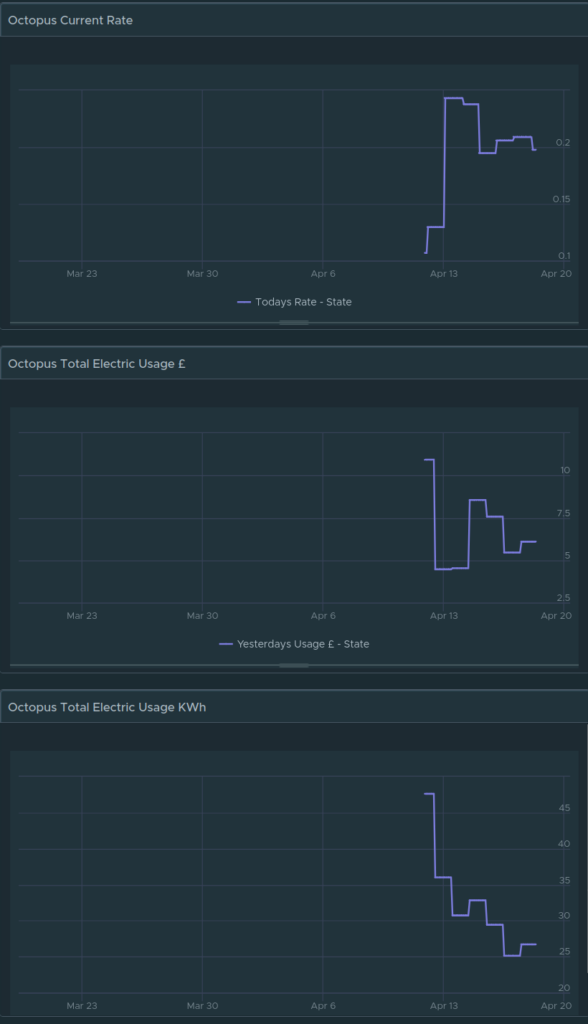
I then created this set of three widgets
2.2.4 – Octopus Electric Properties
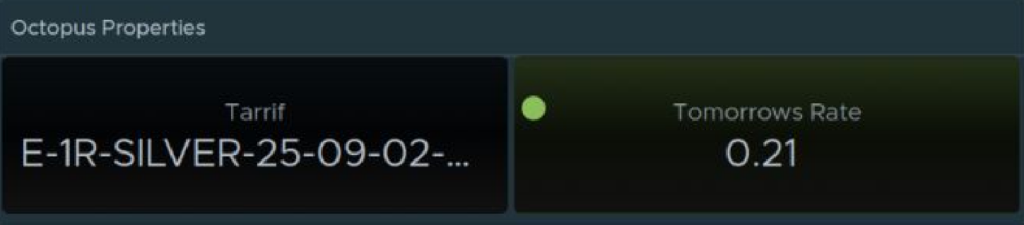
This widget will focus on giving us a properties box with data like my electric rate for tomorrow, tariff type
Add a Scoreboard onto the canvas

Click the pencil to edit the widget
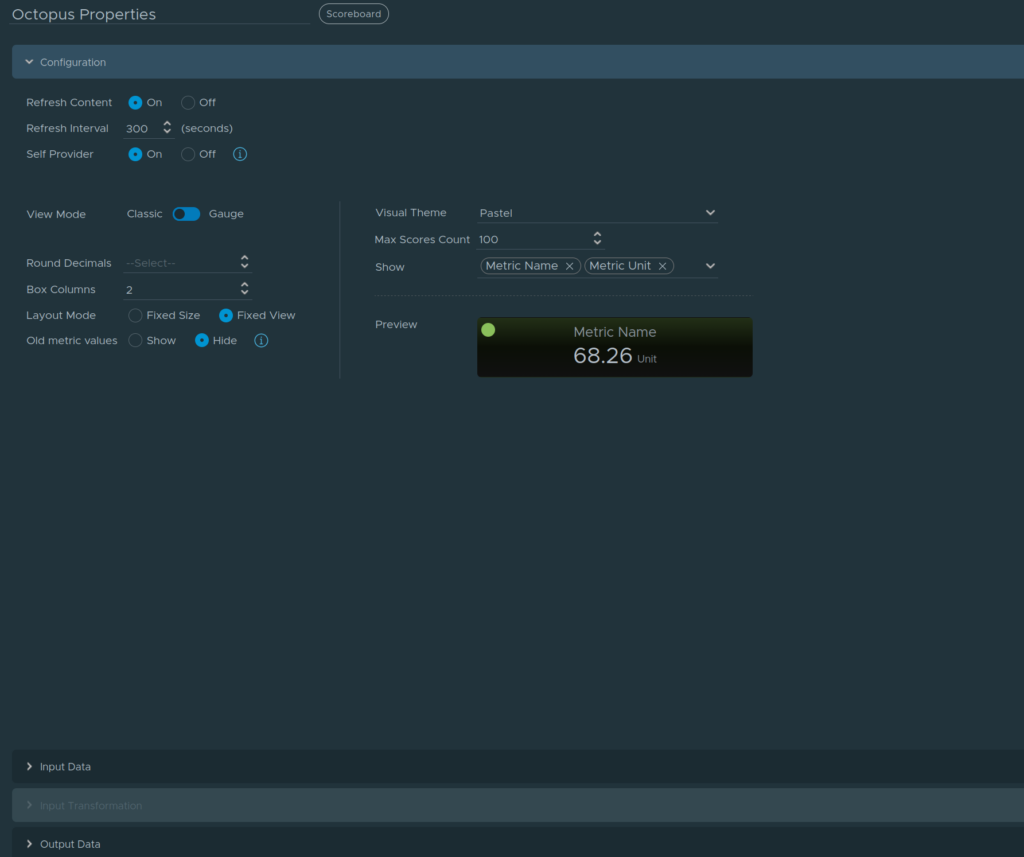
Give the widget a name, then set the following and click Output Data
- Visual Theme – Pastel
- Refresh Content – On
- Self Provider – On
- Box Columns – 2
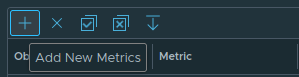
Click the +
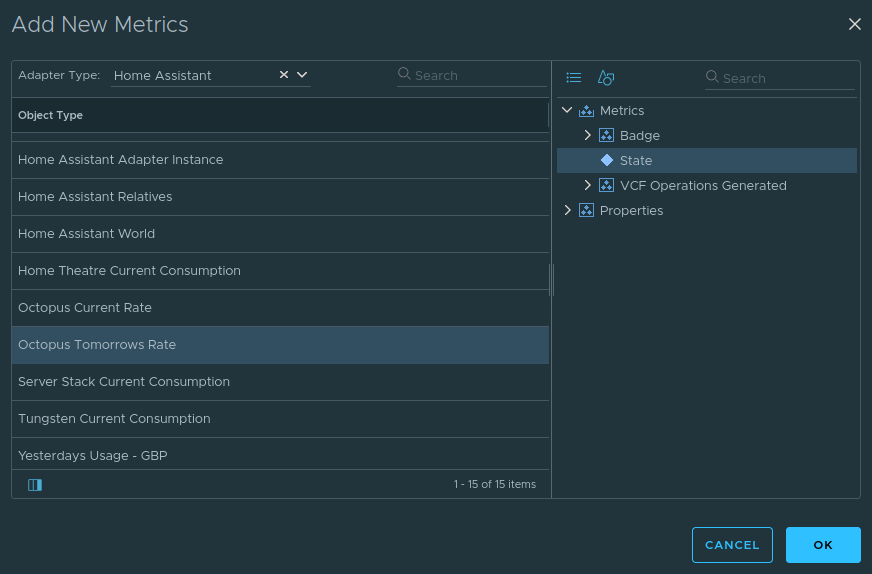
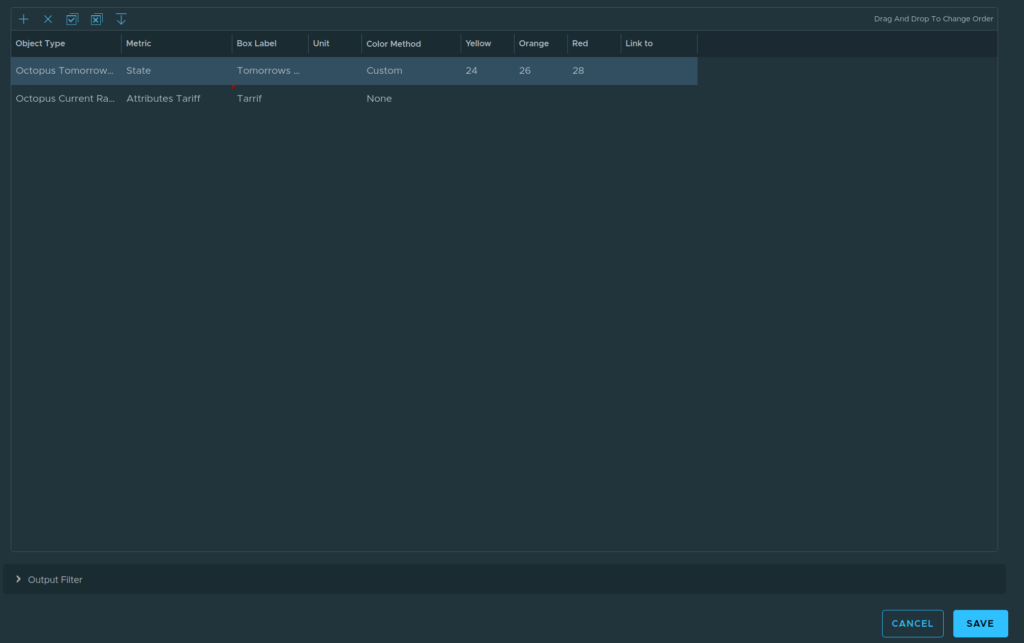
Set the Adapter Type to Home Assistant, I added my Octopus Tomorrows Rate/Metrics/State and clicked ok
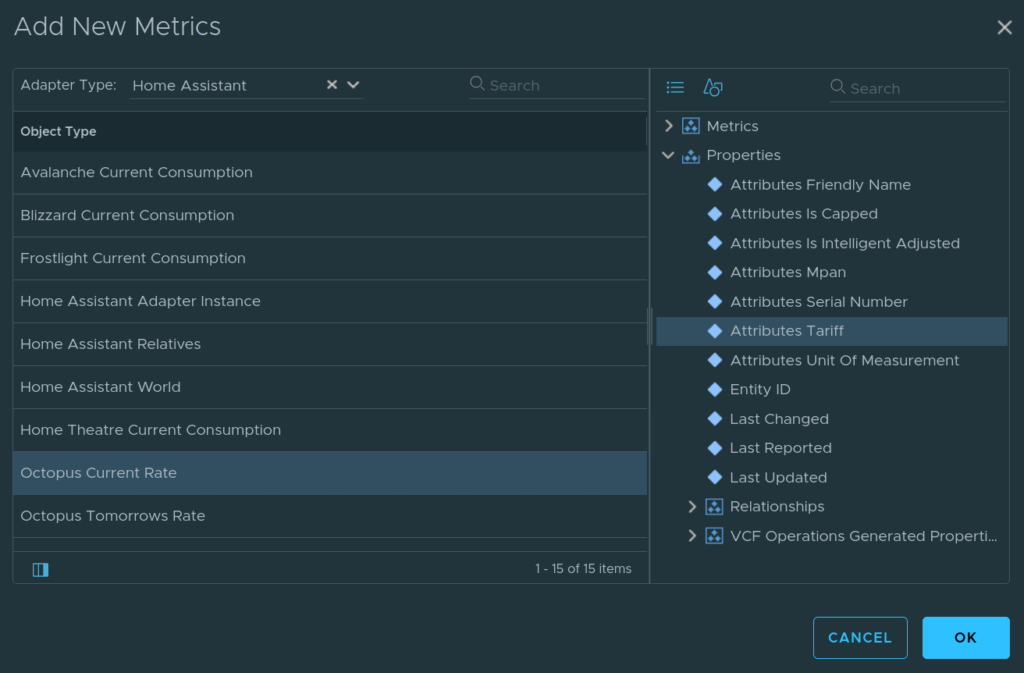
I added more properties under Octopus Current Rate/ Properties and selected the Attributes Tariff option
Double click the entry and set the Color Method to None, you could optionally set one which I did for my rate tomorrow, then click Update

Then click Save
The widget should look like this