In this article we are going to look at everything included with the default VVF package from Broadcom, with a focus on the Aria suite, with no extras added in and how to make the most out of it, as the quotes have gone up a lot, but there is also a lot more on offer that most people didnt have before, so there is a little silver lining to the price hikes
To start, what do you get for your money in VVF, according to Broadcom here, this is
- vCenter Server
- ESXi
- vSphere IaaS control plane
- vSAN Enterprise (250 GiB per core per host) – Broadcom’s article for the change is here
- VMware Aria Operations
- VMware Aria Operations for Logs
- VMware Aria Suite Lifecycle
Aria is the main selling point for features here that you likely dont already have, Aria, formerly vRealize, is all about management for your environment and optimising what you have as well as generally making life easier for managing your vSphere setup
Aria Operations is all about managing your main environment, with diagnostic overviews, day to day operations including alerting, troubleshooting and more, capacity where you can reclaim disk space thats being wasted, right size machines and cover scenarios around adding workloads and infrastructure to better manage your environment
Aria Operations For Logs is a brilliant syslog server with a helpful GUI to help manage your logs in vSphere, but also anything else can output to syslog, it makes reading syslogs much easier, especially around vCenter/ESXi so you dont have to trawl through dozens of folders and files, you can just filter through everything, as well as alerting and dashboards for alerts with a high amount of granularity and customisation
Lastly we have Aria Suite Lifecycle, this is used to deploy Aria appliances, though for VVF isnt not really needed for this, but you can also add appliances, which is what we will be doing here, and manage them all in once place to plan patching and upgrades, its helpful for VVF, but there is only three Aria appliances including the Lifecycle manager, but its most useful in VCF when you might have all 6 appliances in and the management becomes a lot harder
We will explore the Aria Suite below, we will go through deploying them all from scratch, and importing it into Aria Suite Lifecycle along with some of the best ways to get the most out of the appliances with as little work as possible
We’ll start with the deployment of the appliances, then the integration and setup of them all
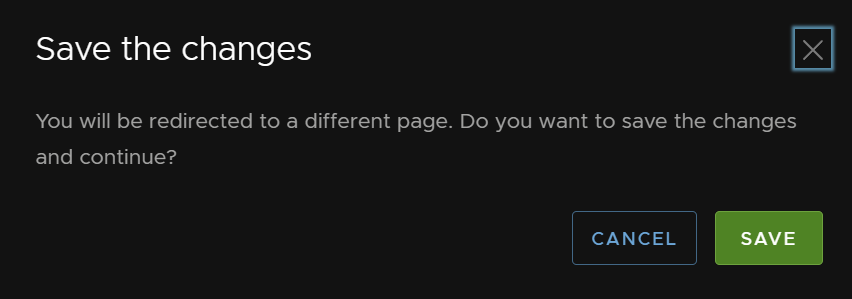
Important – By continuing you are agreeing to the disclaimer here
1 – Deployment
First, lets get all the appliances deployed, so that we dont have to sort an NFS server out, and attach the OVAs, given the deployment of Aria Ops and Aria Logs is very simple, we will deploy them first, then Lifecycle manager, and then import them for later management
1.1 – Aria Operations
1.1.1 – OVF Deployment
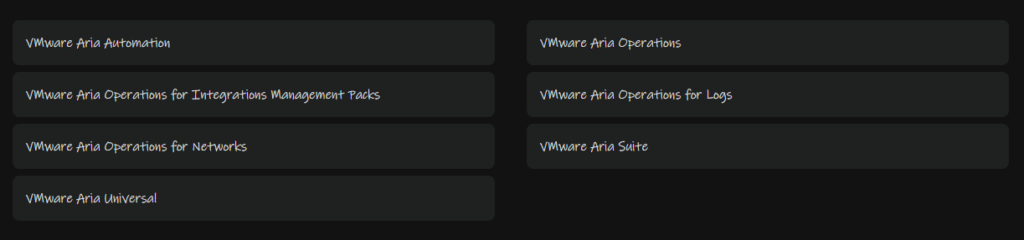
First you’ll need to download the Operations Manager from the Broadcom portal, you want Aria Operations
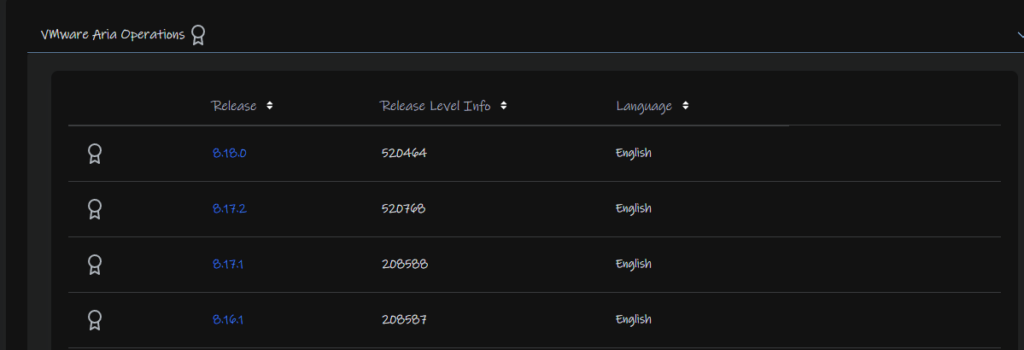
From there select your release, eg 8.18
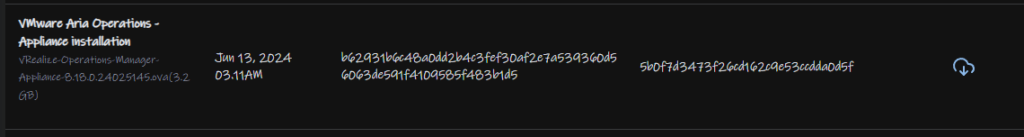
You then want the appliance installation
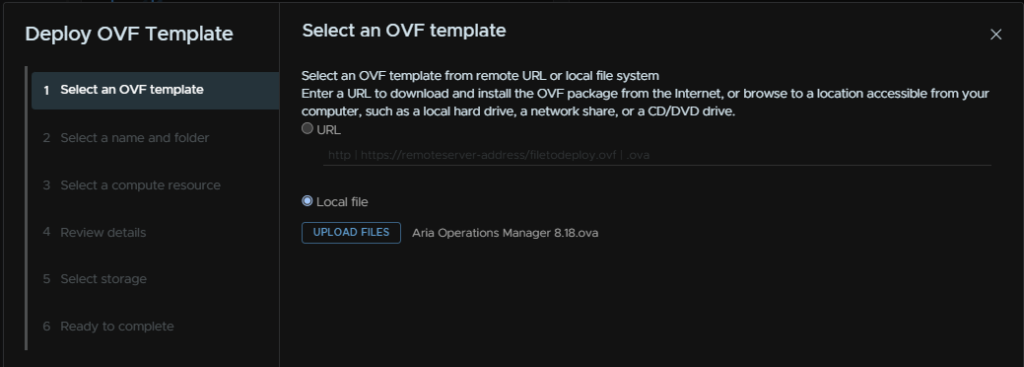
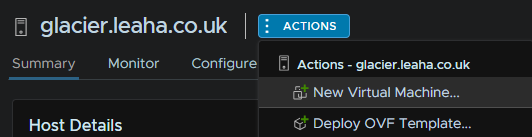
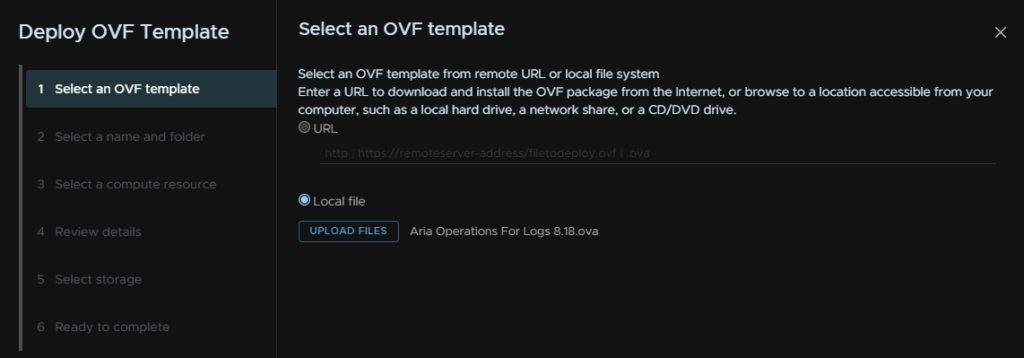
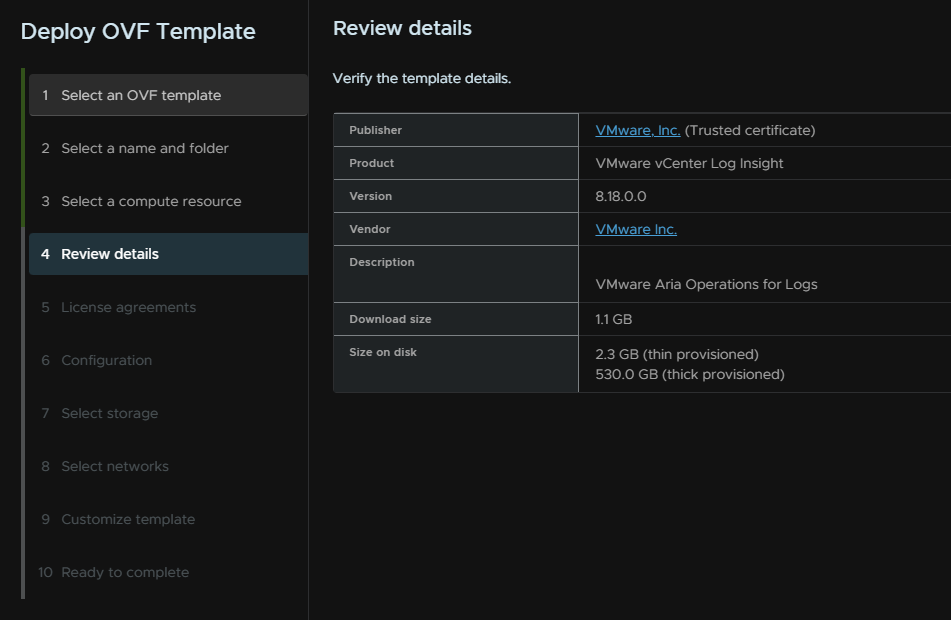
Next, in vSphere deploy a new OVF template and select the local file
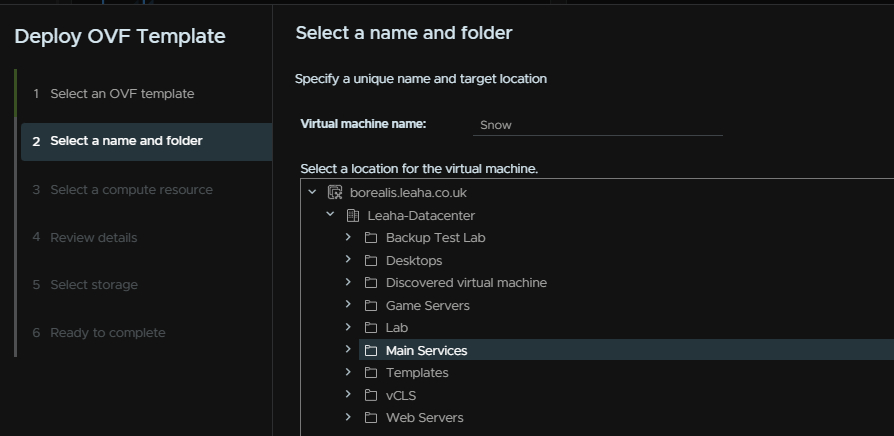
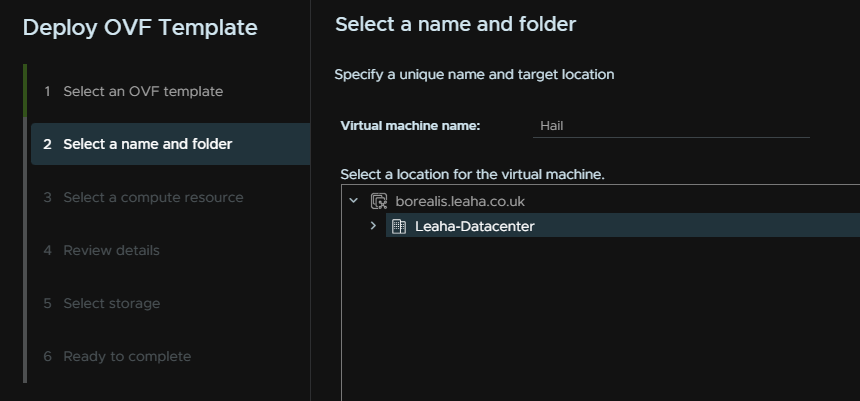
Give the VM a name and select a folder to pop it in
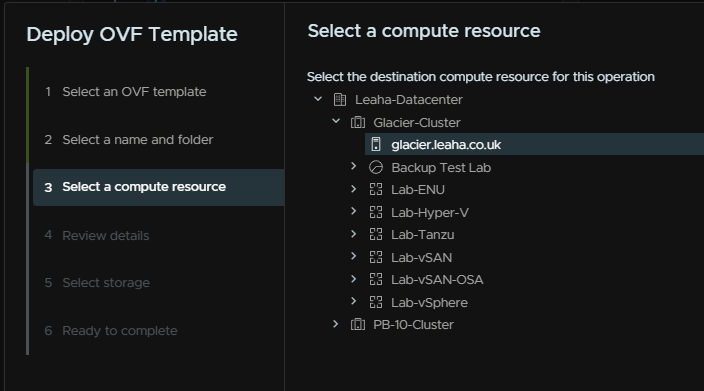
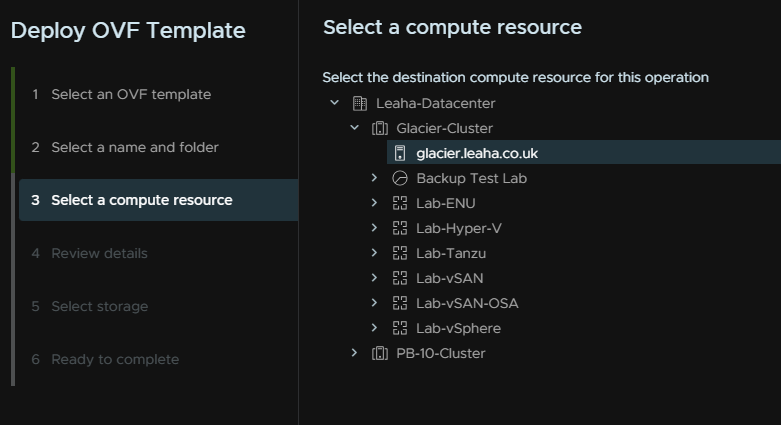
Select your compute
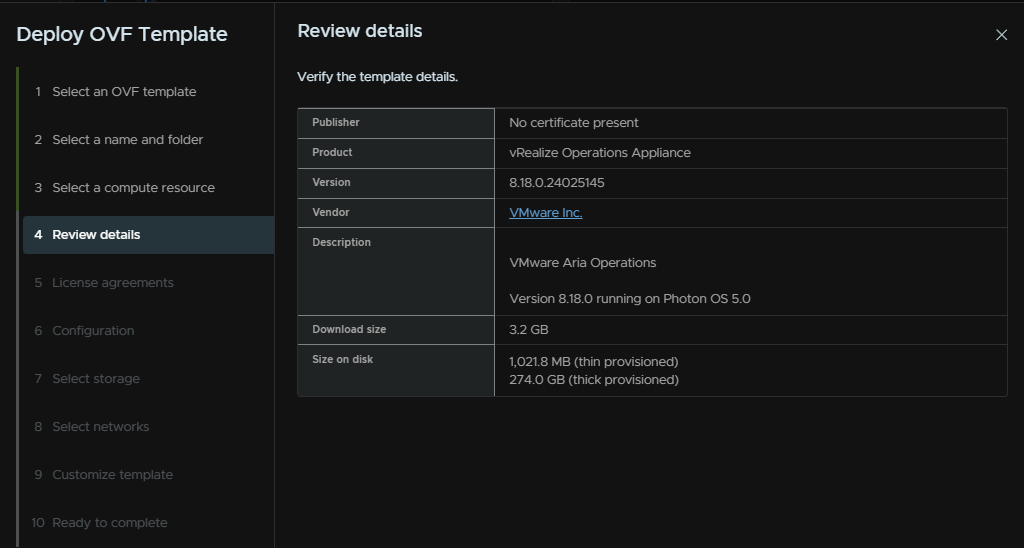
Hit next here
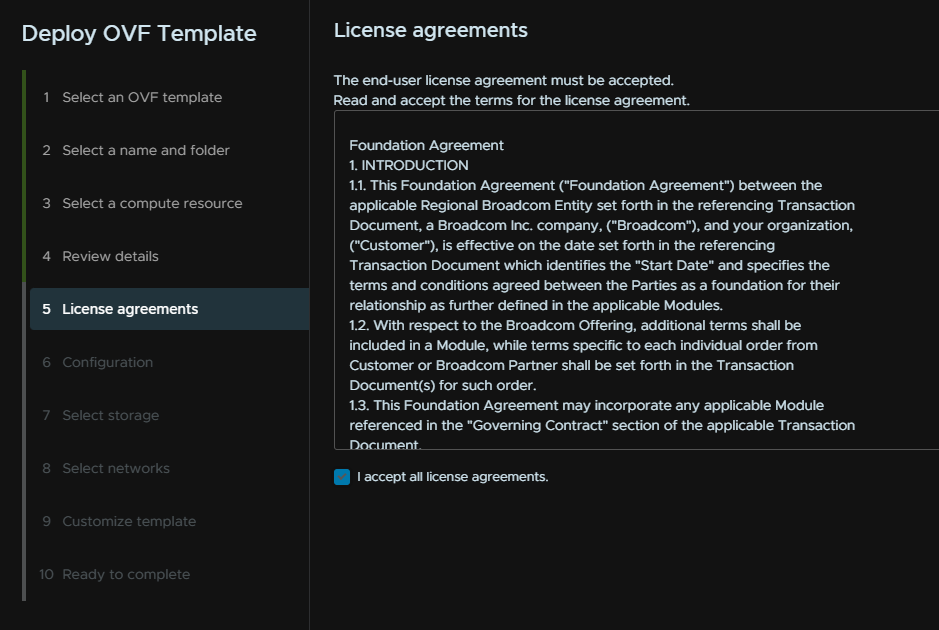
Accept the EULA
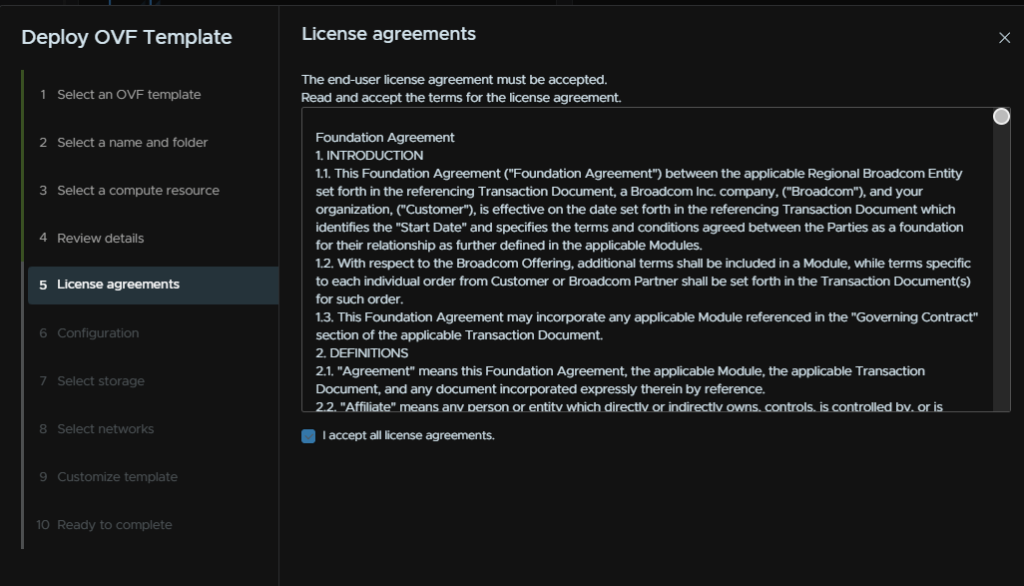
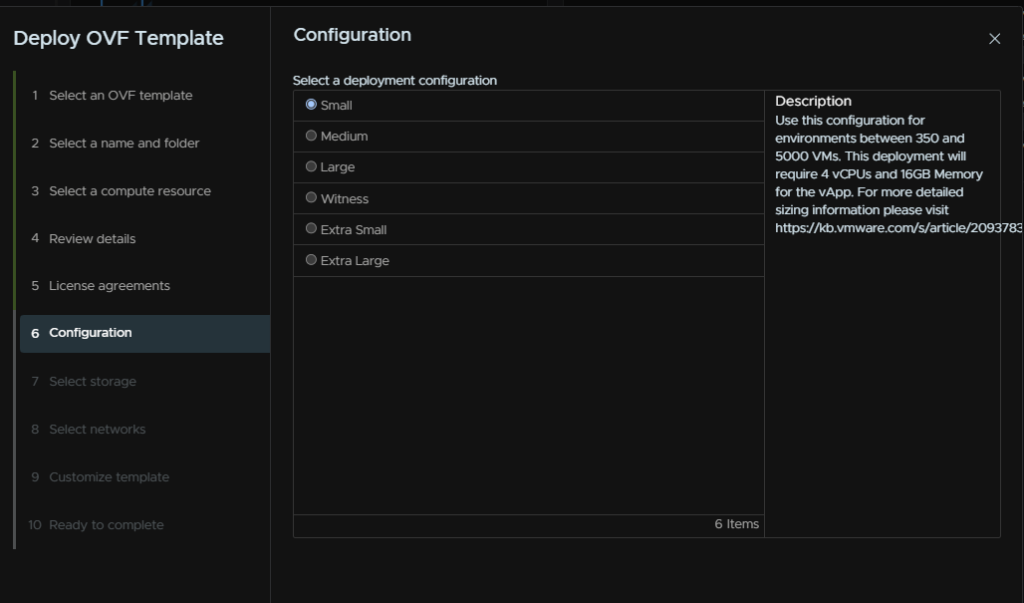
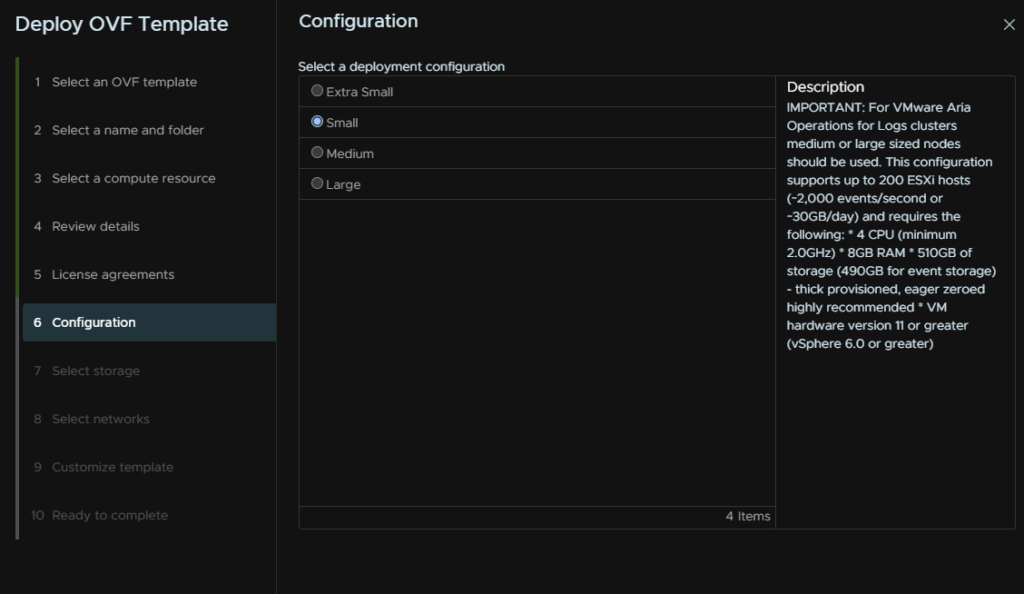
Select the size for your environment, in production you shouldnt go smaller than small
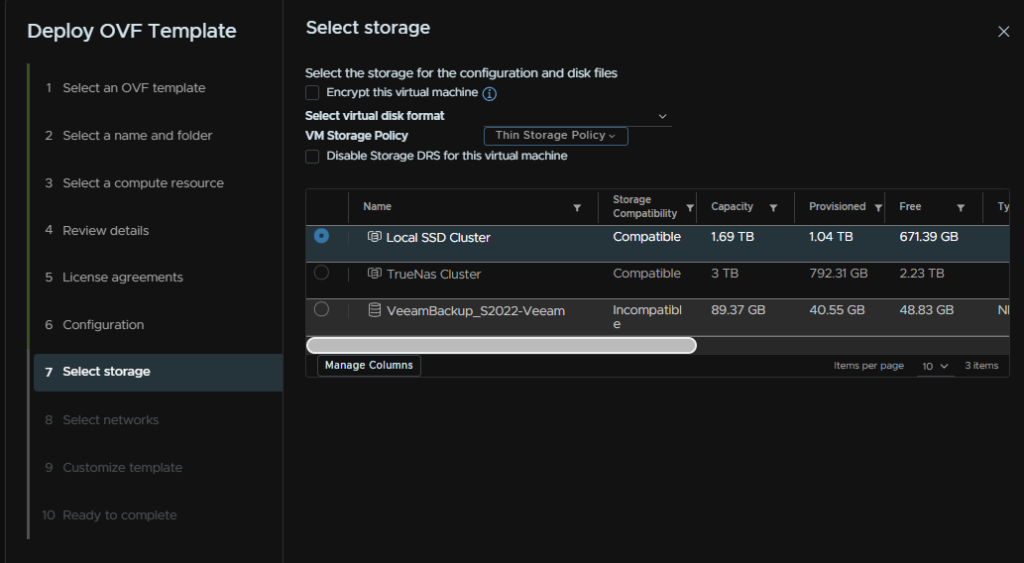
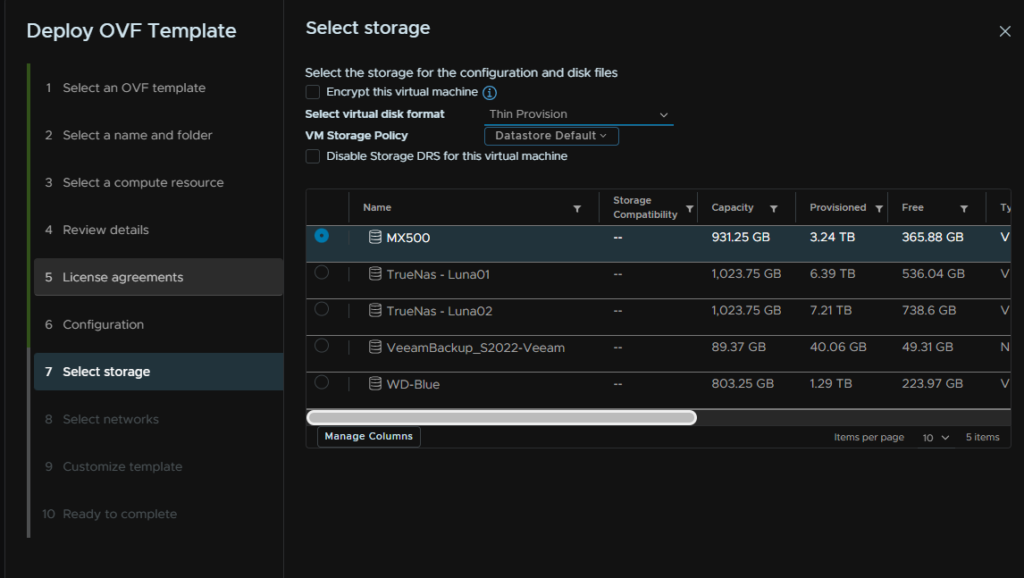
Select your datastore, you may not be able to select Thin/Thick provisioning for datastore clusters, so I am using a policy to ensure this, normal datastores you can just select thin provision as normal
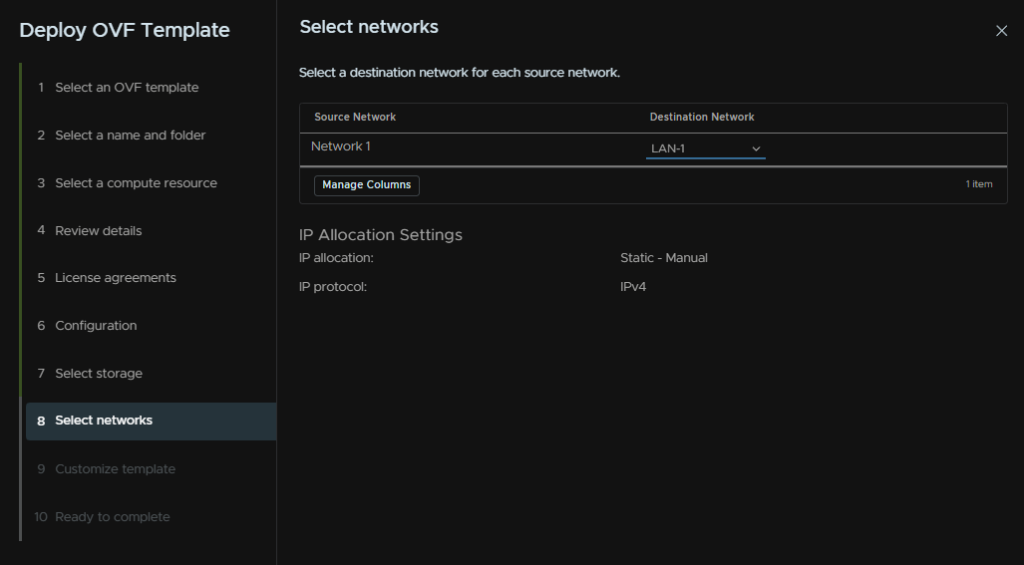
Select a network
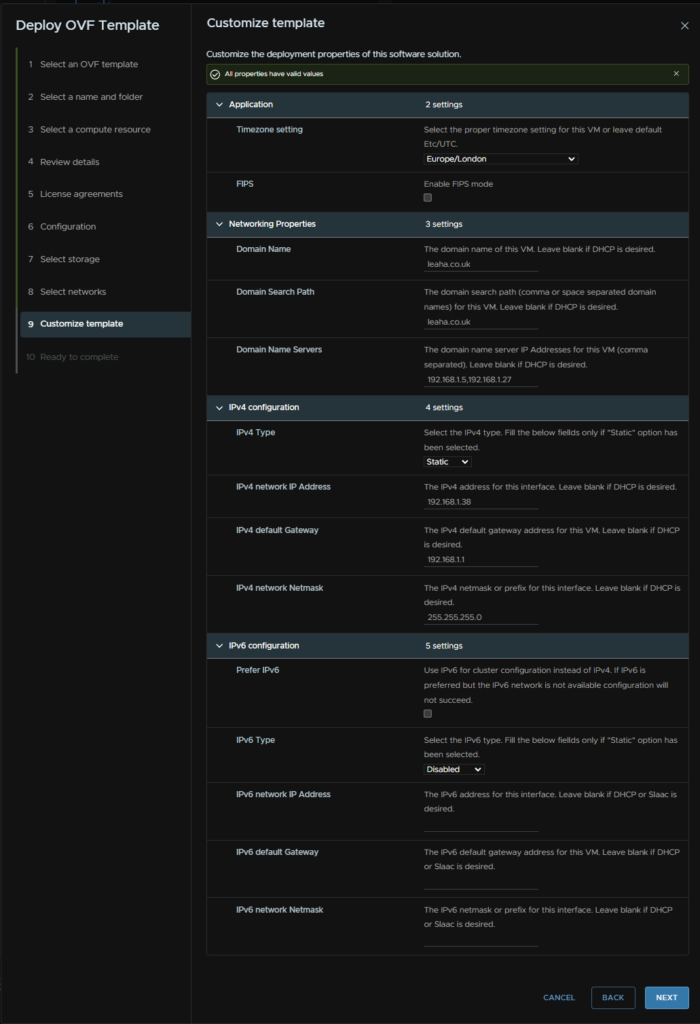
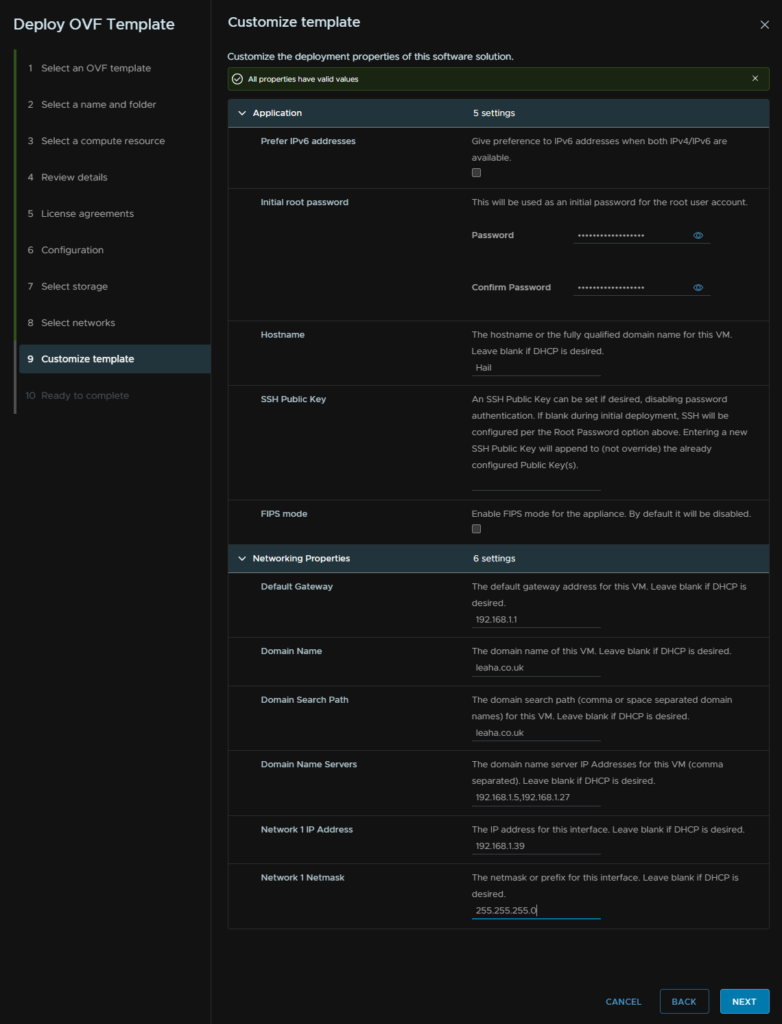
Set your Timezone, select FIPS if you need it, if unsure leave this unchecked, and fill out your networking info
Then finish and deploy
Once its deployed, power the machine up
1.1.2 – Initial Setup
Once the VM is powered on go to the web UI on
https://fqdn/admin or https://ip/admin
This will redirect you to the initial setup page
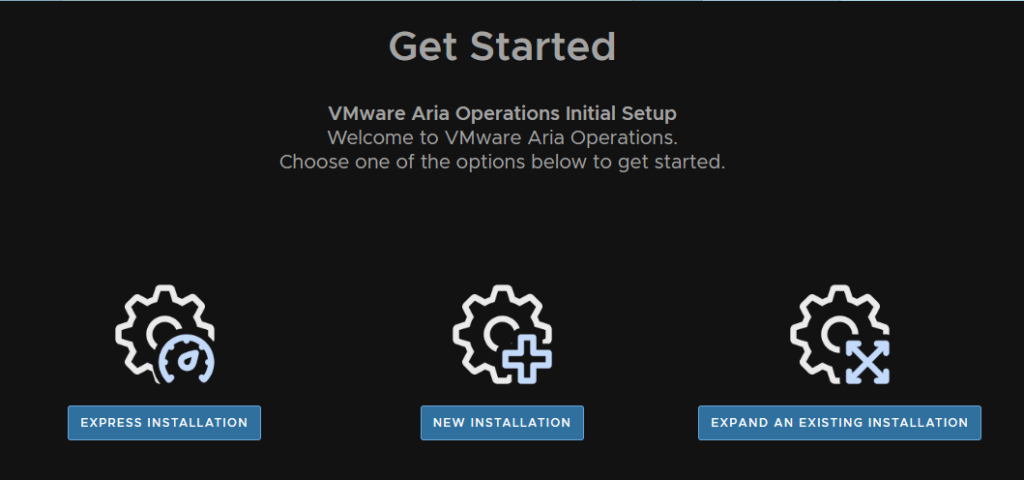
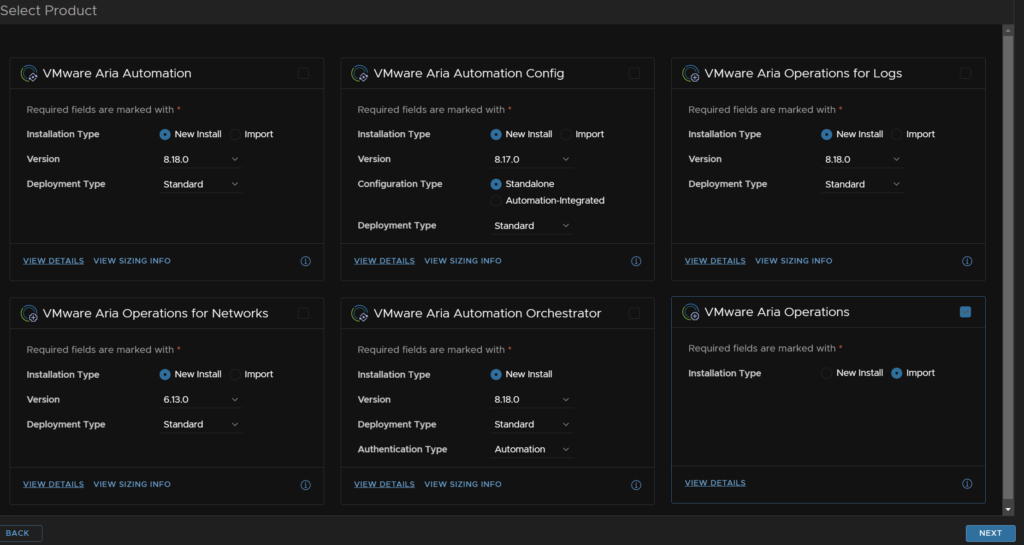
We are going to go down the New Installation route, you can use express installation to save time, but I want to manually configure everything I can, so we are going with the slightly more advanced route
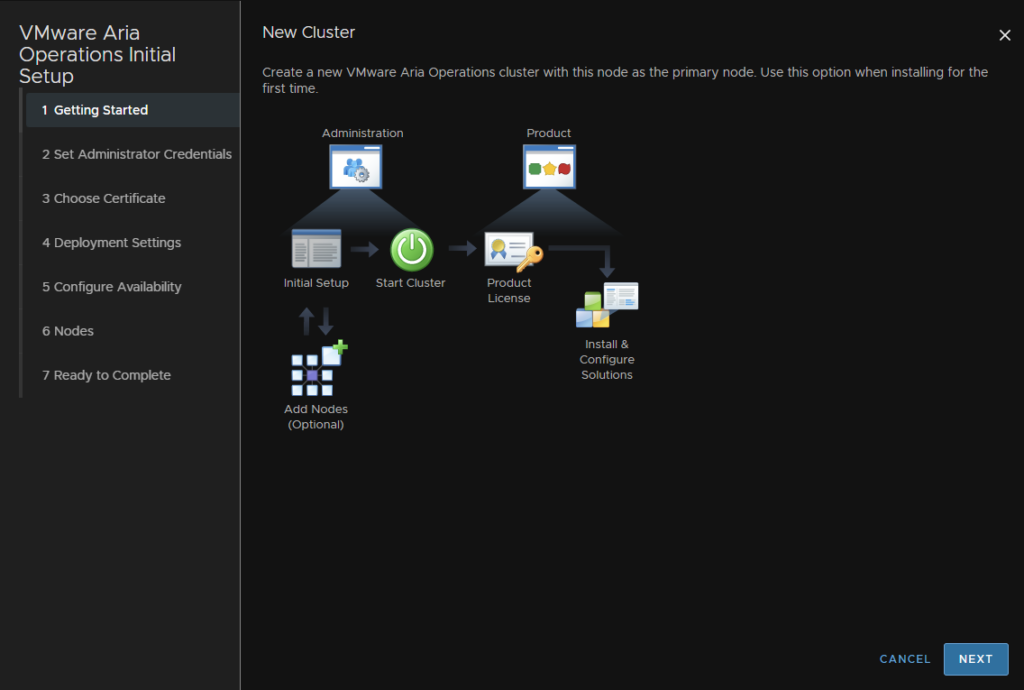
Lets leave this stock and hit next
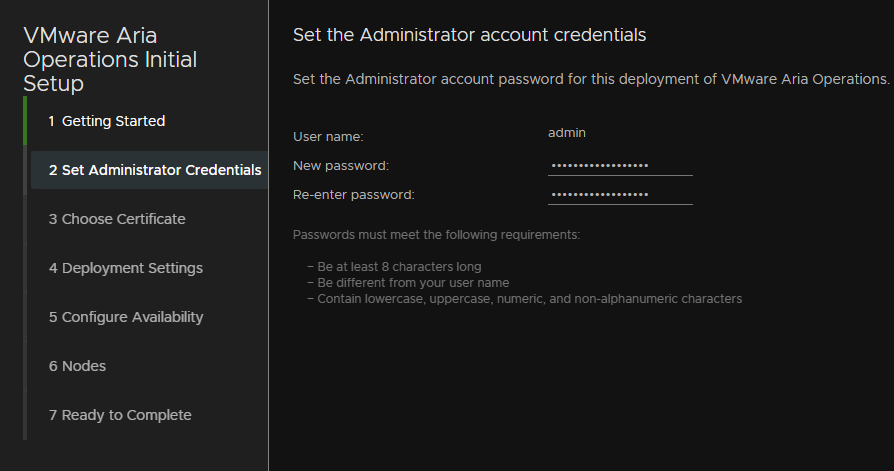
Setup an admin account with a secure password, then hit next
Choose a certificate, the default self signed ones are fine unless you need custom ones signed by an on prem CA, so I’ll be sticking with the default

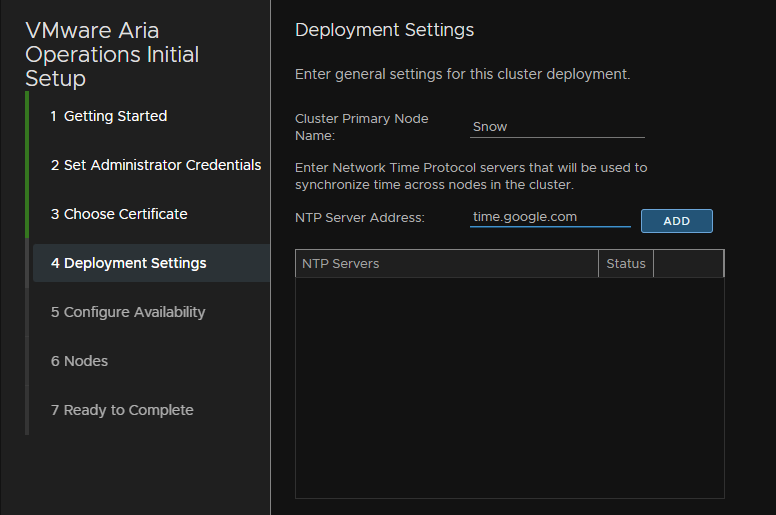
Name the primary node, as this is a new installation this will be the node we are setting up, I have used the same name as the VM and whats in my DNS entry, Snow, then also add an NTP server, I am just using Google for this, and click Add to add it to the list, the hit next
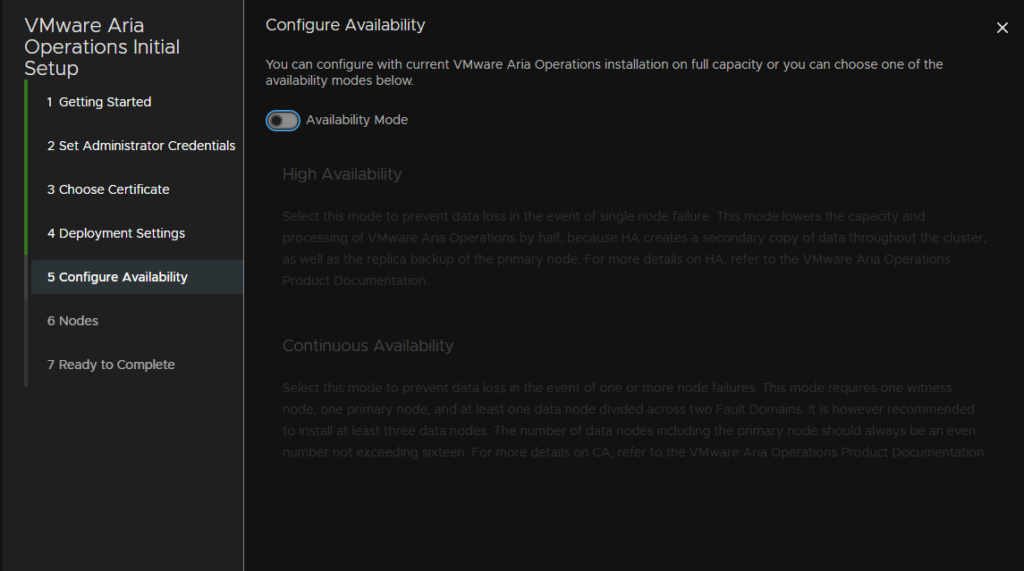
You can setup HA with the appliances, but for now, we are going with a single node, as you can expand a cluster this is configurable later if we need
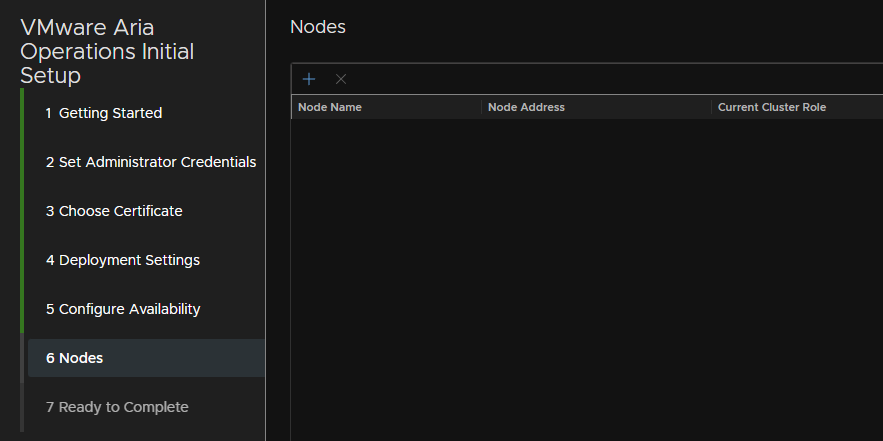
You can add other nodes in here, such as a replica for the HA setting we’ve disabled, as this is a single node we can leave this blank and hit next
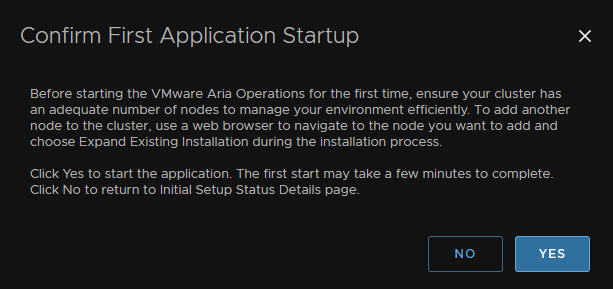
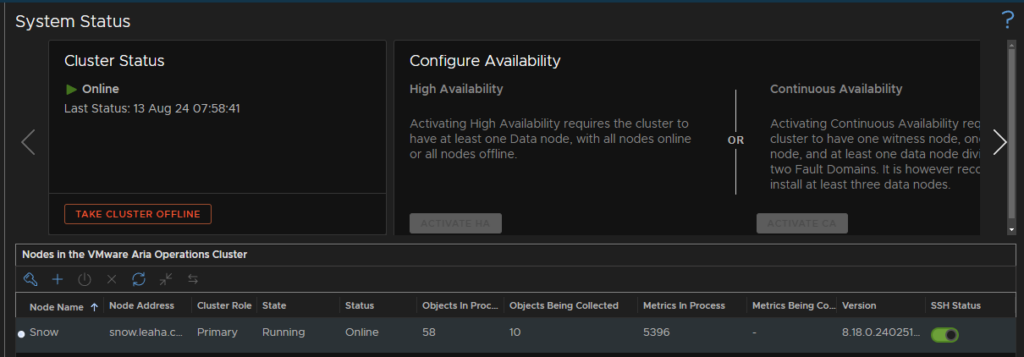
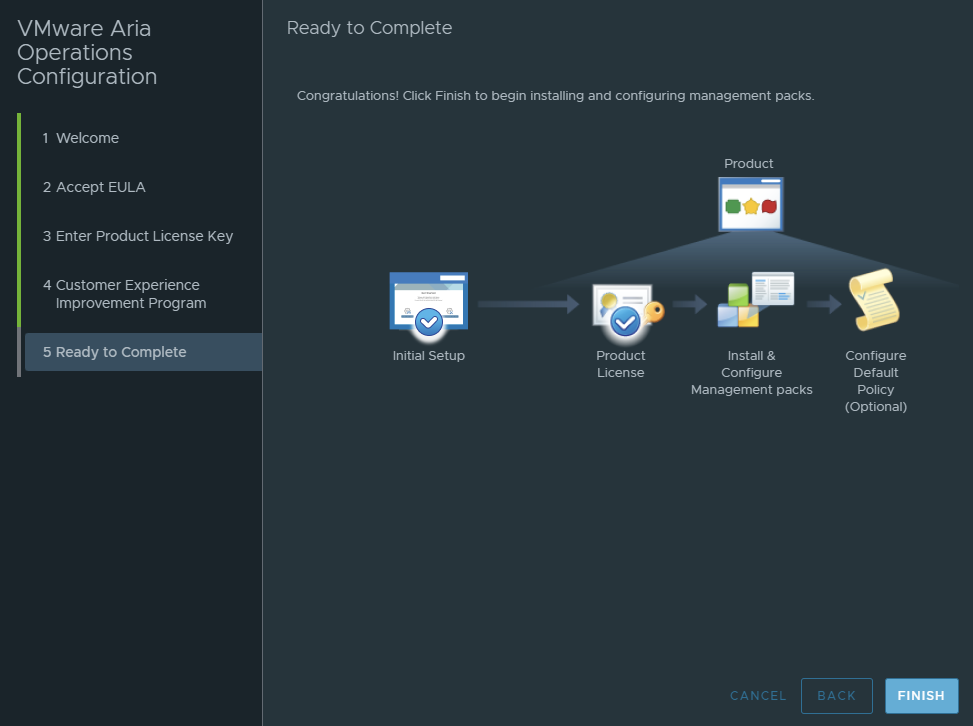
This brings you to this page after you click Finish on the Ready To Complete section, from here we need to click Start VMware Aria Operations to start the cluster, I also enabled SSH on the node

We can click yes here, if you had a massive environment, you may need extra nodes, but you would also use a larger config during the OVF deployment
After a while the cluster should then come online, this can take ~10 mins
1.1.3 – Post Setup Config
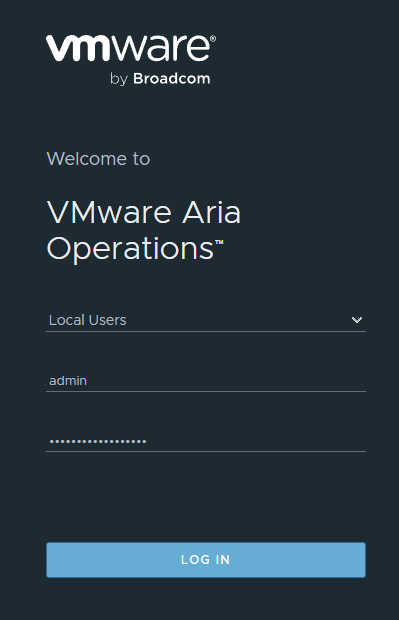
Once the cluster is online via the admin portal we need to log into the WebUI, this is accessible now on
https://fqdn/ui or http://ip/ui
From there login with the admin account
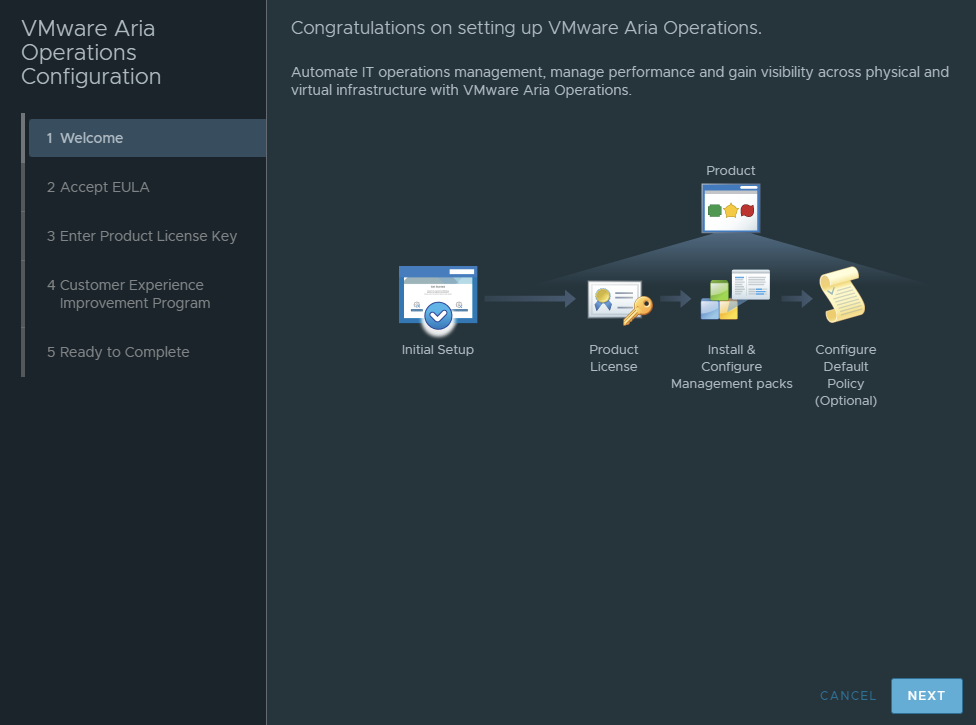
Now we need to license the appliance, click next here
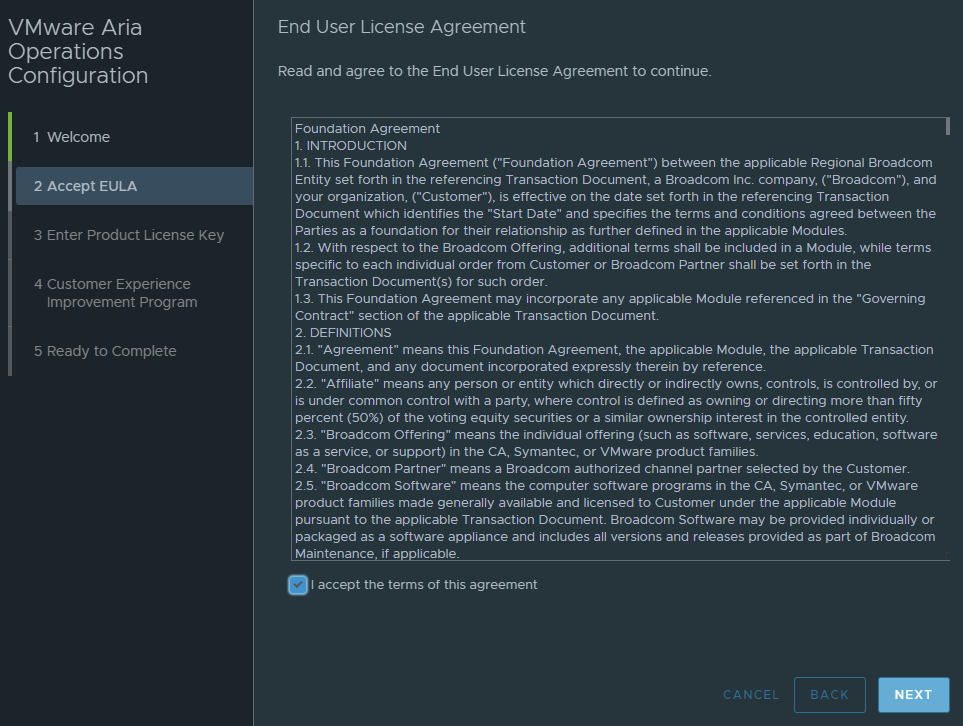
Accept the EULA
Either, use evaluation, or enter your key
Click next on the CEIP
Now click finish
1.1.4 – Setting Root Password
Got to the console on vSphere and login as root, with the password empty, this will prompt you to set one if its the first time youve logged in
1.2 – Aria Operations For Logs
1.2.1 – OVF Deployment
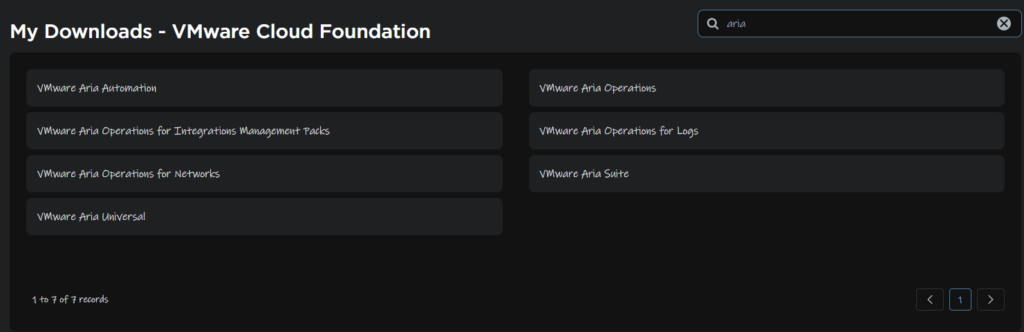
First you’ll need to download the OVF appliance from Broadcom’s website, you want to do to My Downloads and select Aria Operations For Logs
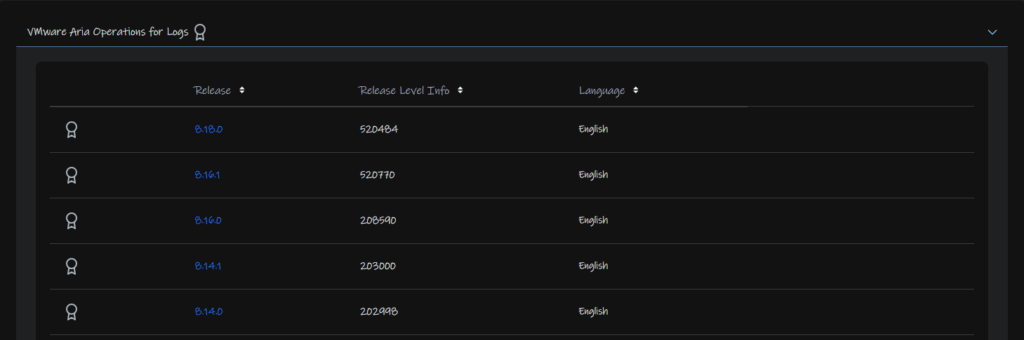
From here select your release
You then want the appliance

From vSphere deploy a new OVF template from your host
Select the Operations For Logs appliance you downloaded
Give it a name and a folder
Select compute
Click next here
Accept the EULA
Select your deployment, I recommend small or larger for production, I will be using Extra Small for my home lab, as its just a couple ESXi hosts
Select your datastore, you can also thin provision the VM from the select virtual disk format
Select a network

Customise the template enabling IPv6 if needed, setting a root password, hostname, SSH public key and FIPS if needed, I am not using these, then setup the networking for your environment
Then hit next and finish
1.2.2 – Initial Setup
Navigate to the WebUi on
https://fqdn or https://ip
From there start the initial setup
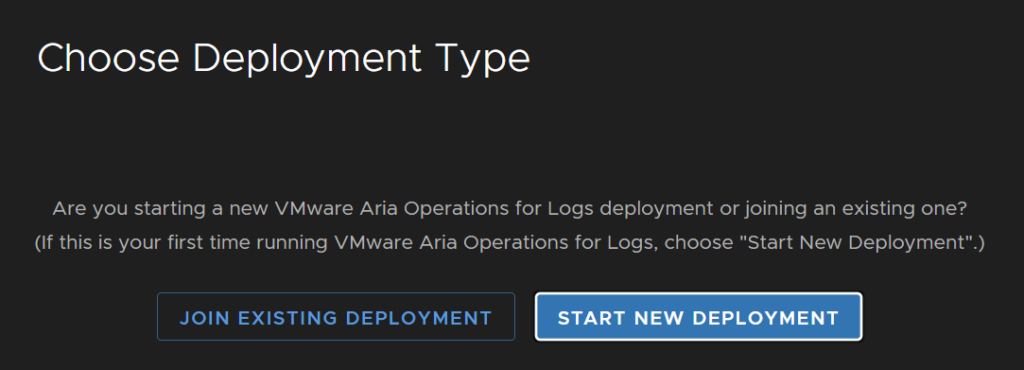
Then start a new deployment
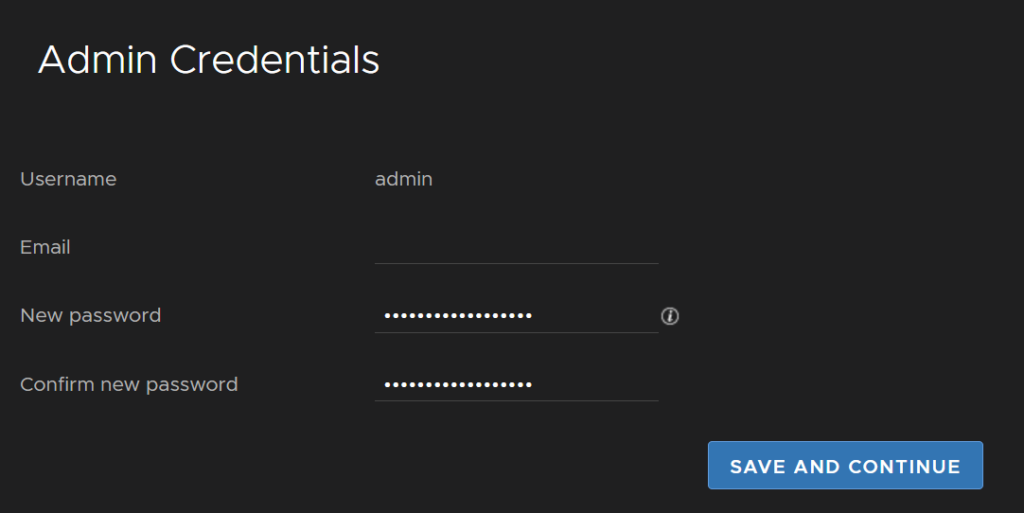
Setup the admin credentials
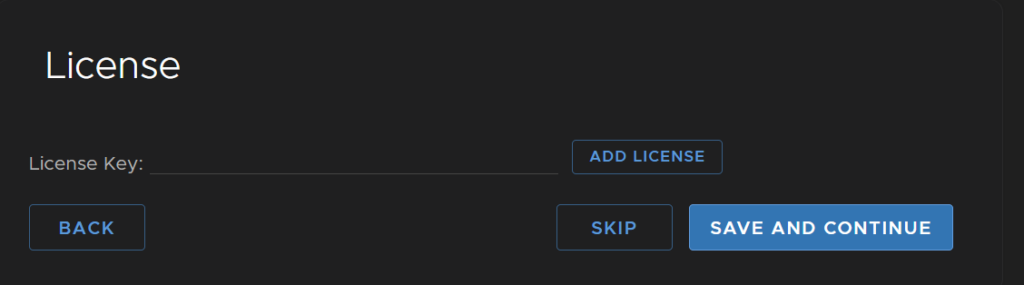
Then add your license
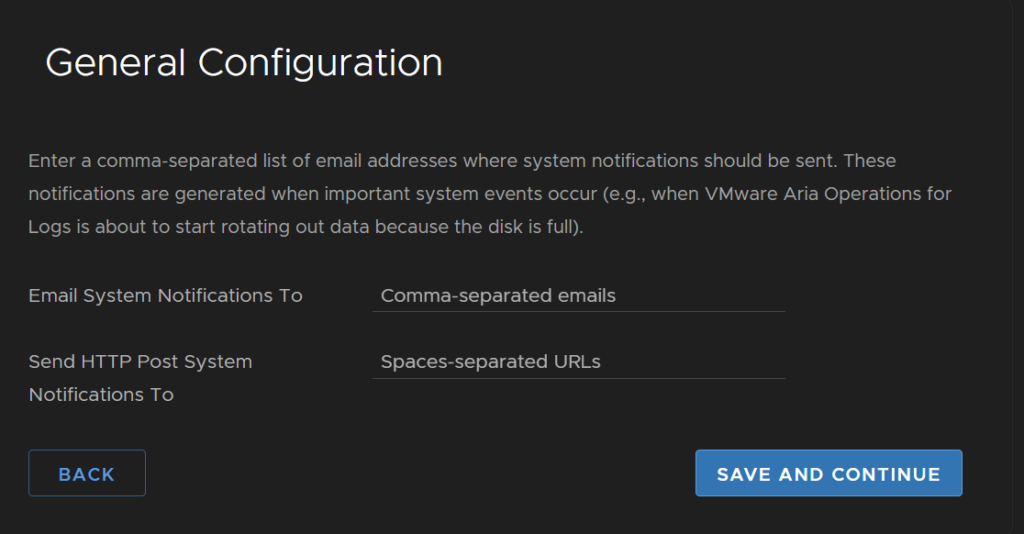
You can setup email notifications if you need, I have left this blank for now
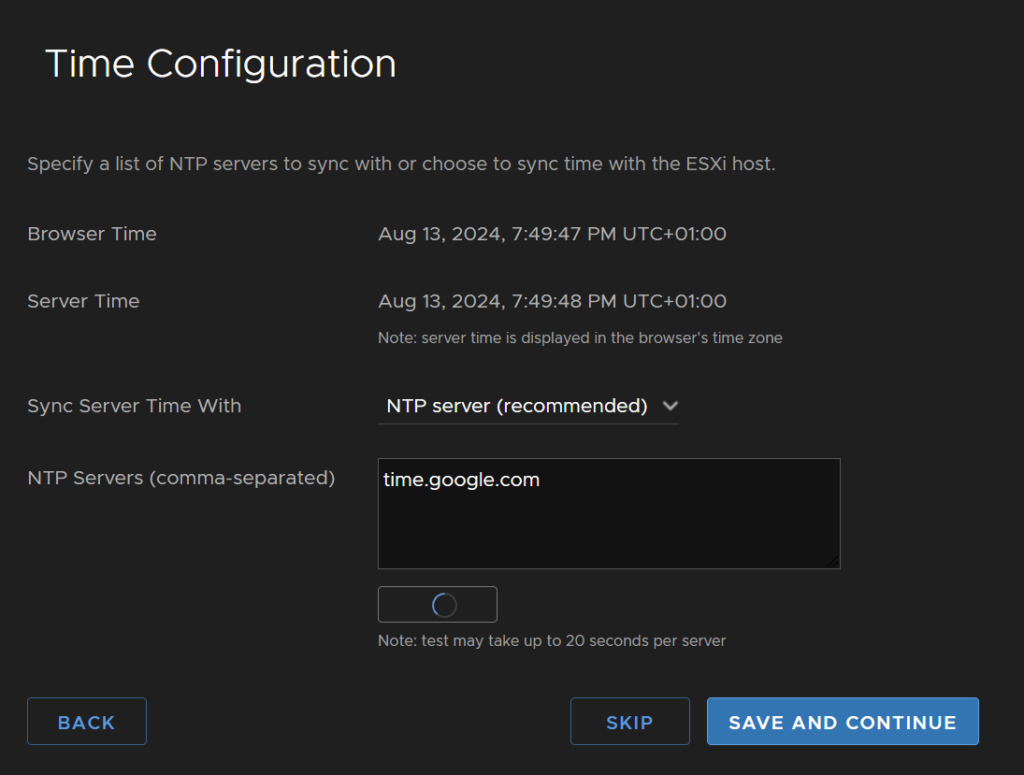
Setup NTP, you can sync to the ESXi host if you want
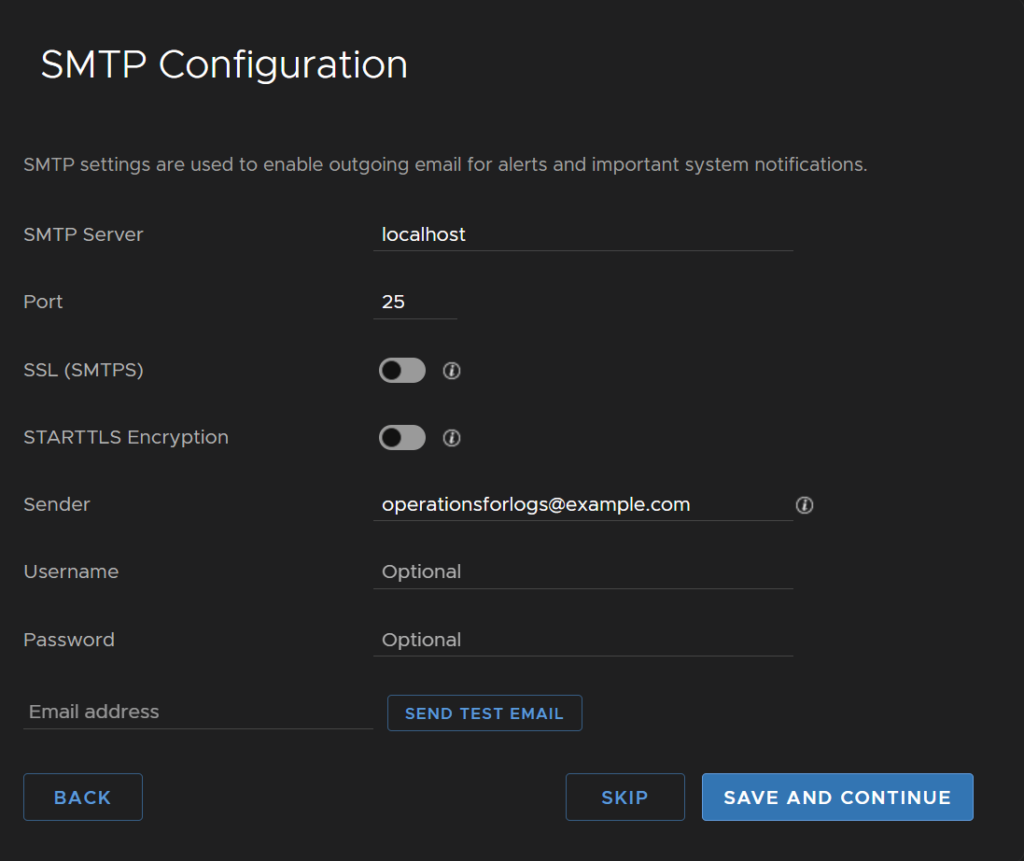
Configure SMTP for the email alerts, I have left this stock as I can set it up later if needed
You can proceed here with the self signed certificates, or add your own if you have an on prem CA and need certs to be signed by it
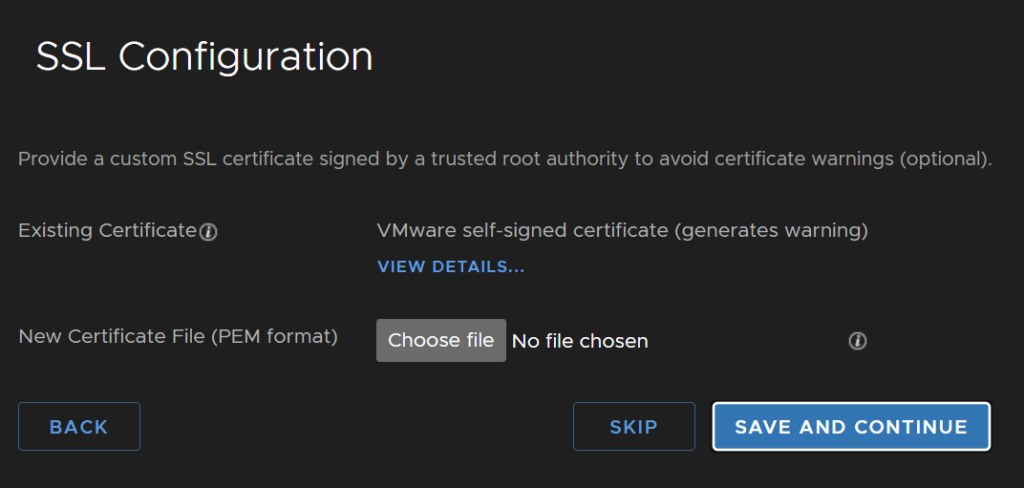
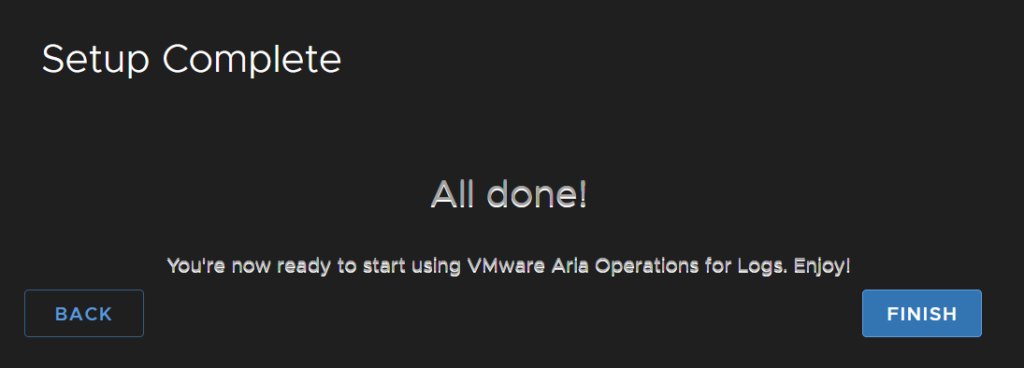
Click finish
1.3 – Aria Suite Lifecycle
First you’ll need the ISO from the Broadcom portal, this can be found under Aria Universal, or the Aria Suite depending on your entitlement
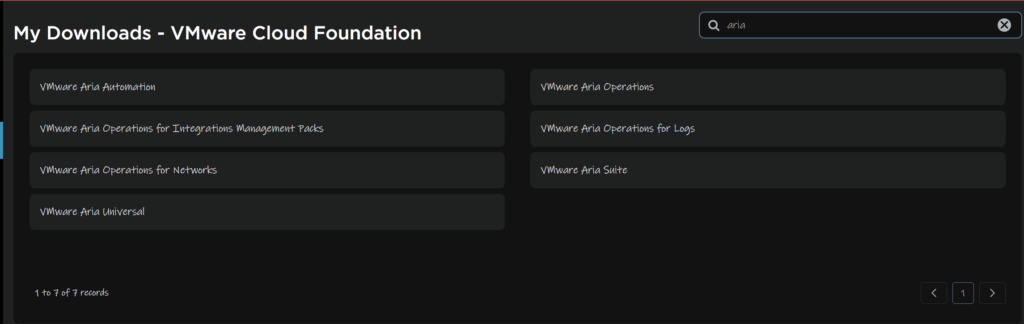
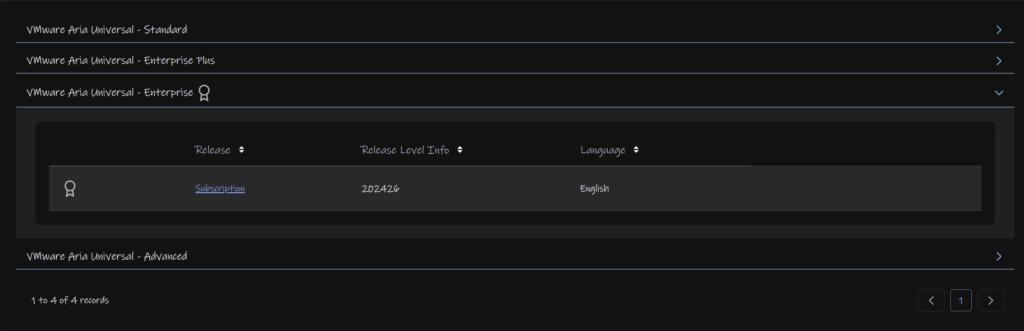
For Aria Universal
Select your entitled version, this is available under all, and select subscription
For Aria Suite
Select the version for your entitlement, I’ll use standard as an example, then click the latest, 2019
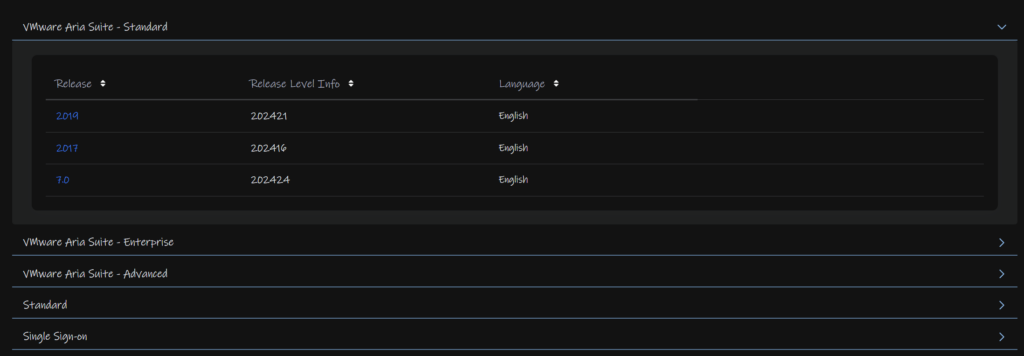
The rest is the same for both
Click view group under Aria Suite Lifecycle

Click I agree at the top and download the easy installer

Mount the ISO and open the UI installer folder
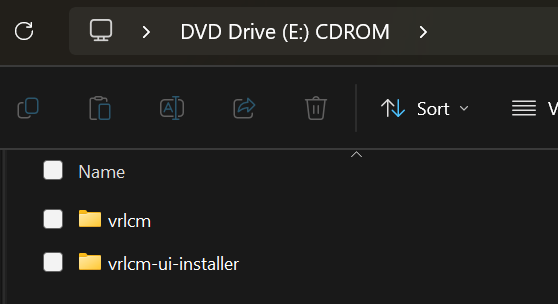
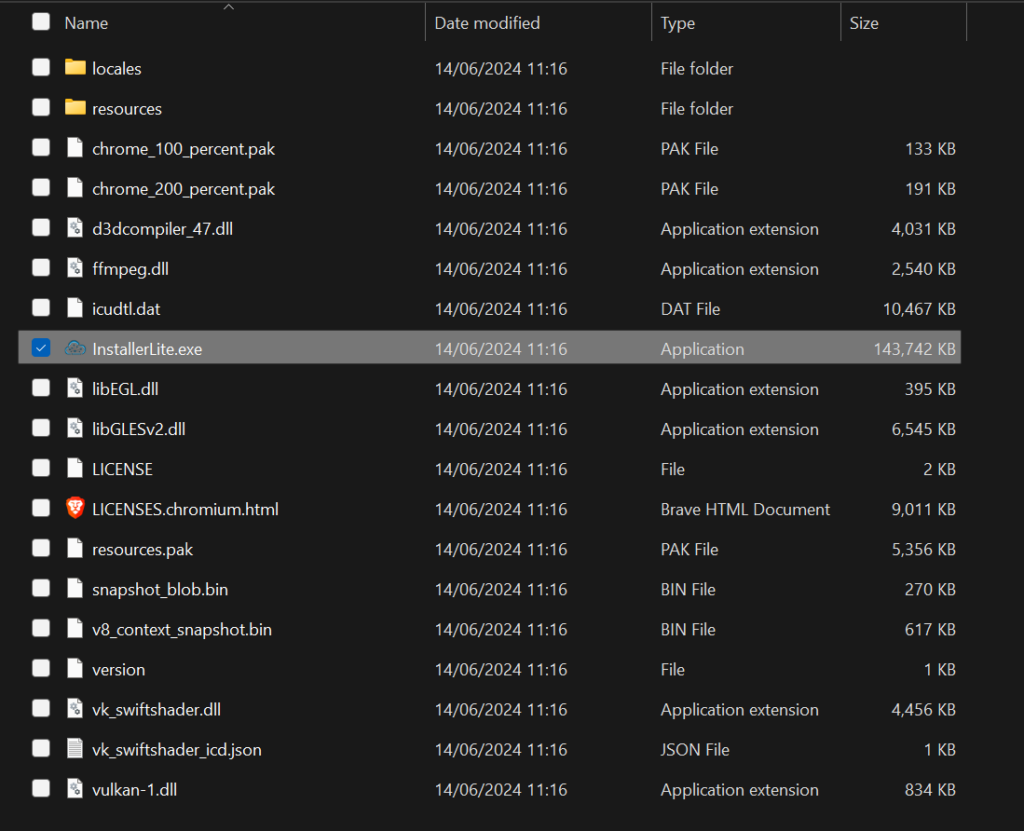
Then win32-lite

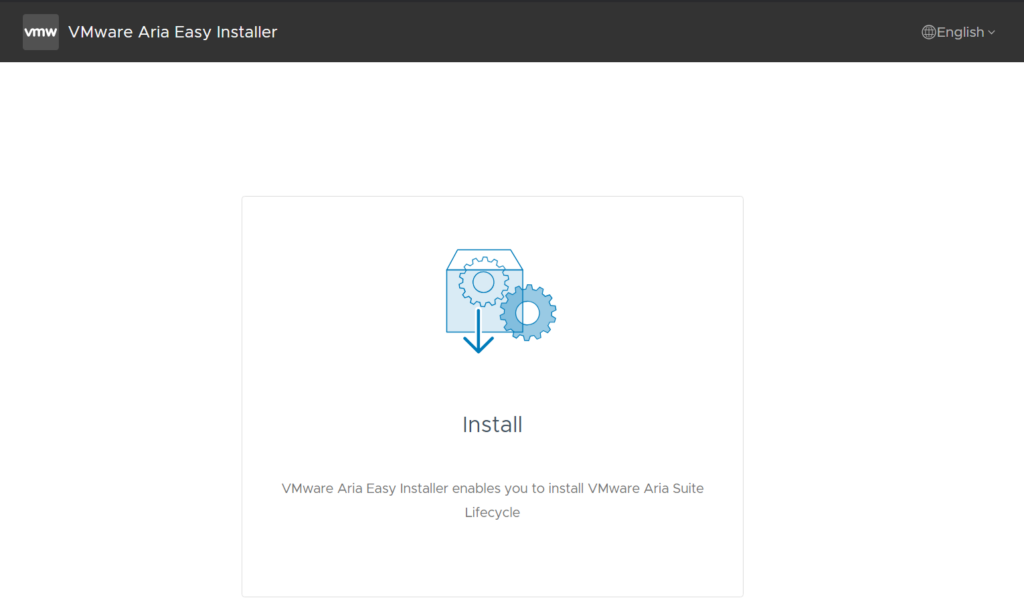
Then run the installer
Click install
Click next
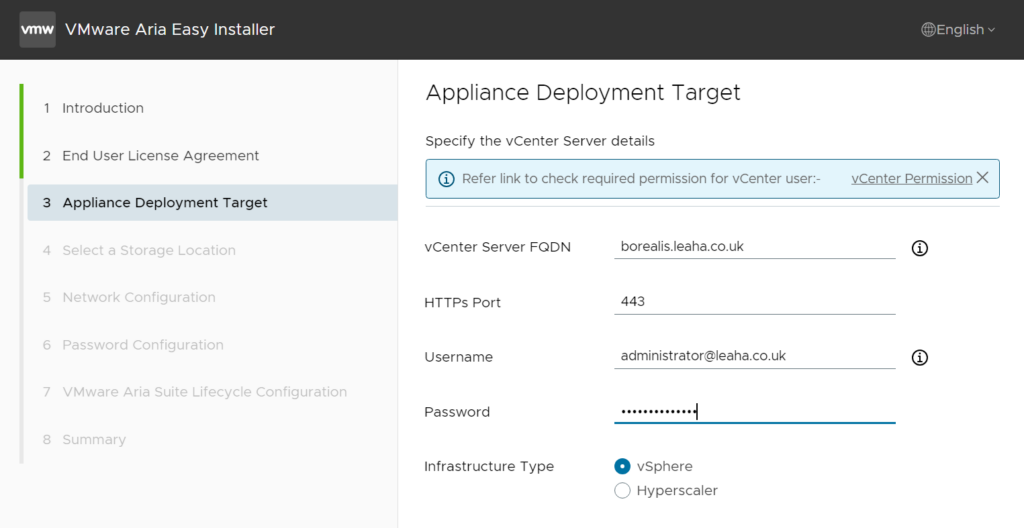
Accept the EULA and opt in or out of the CEIP

Put your vSphere FQDN and admin credentials in
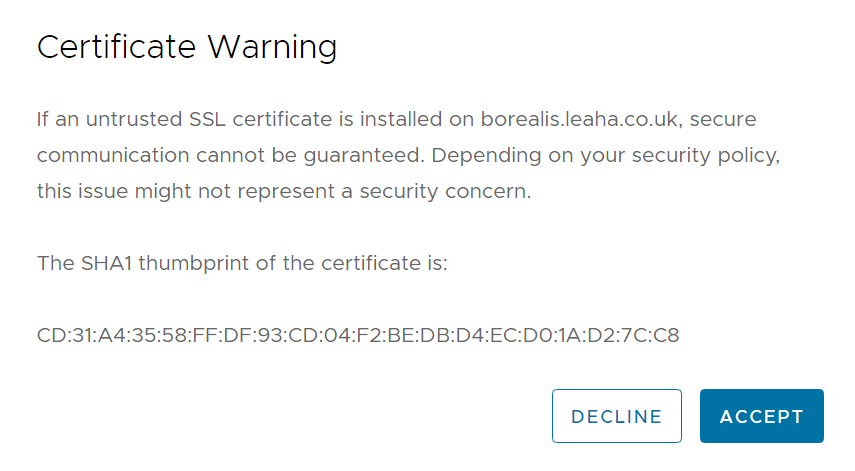
Accept the SSL warning
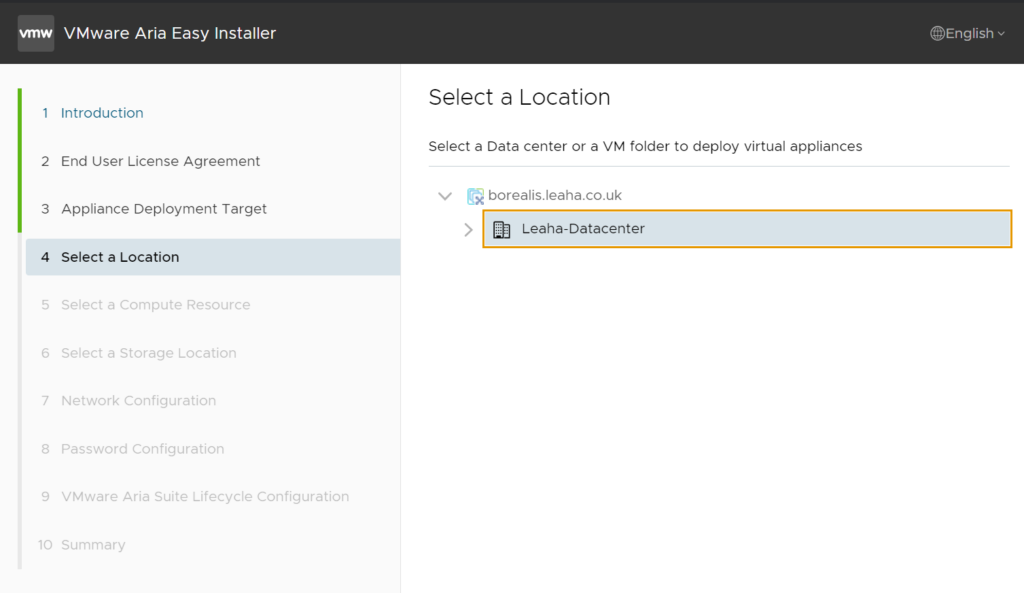
Select a folder, I am just popping this on the datacenter
Select compute

Select a datastore, you can enable thin mode unless you need thick mode for the disk

Configure the networking for your environment
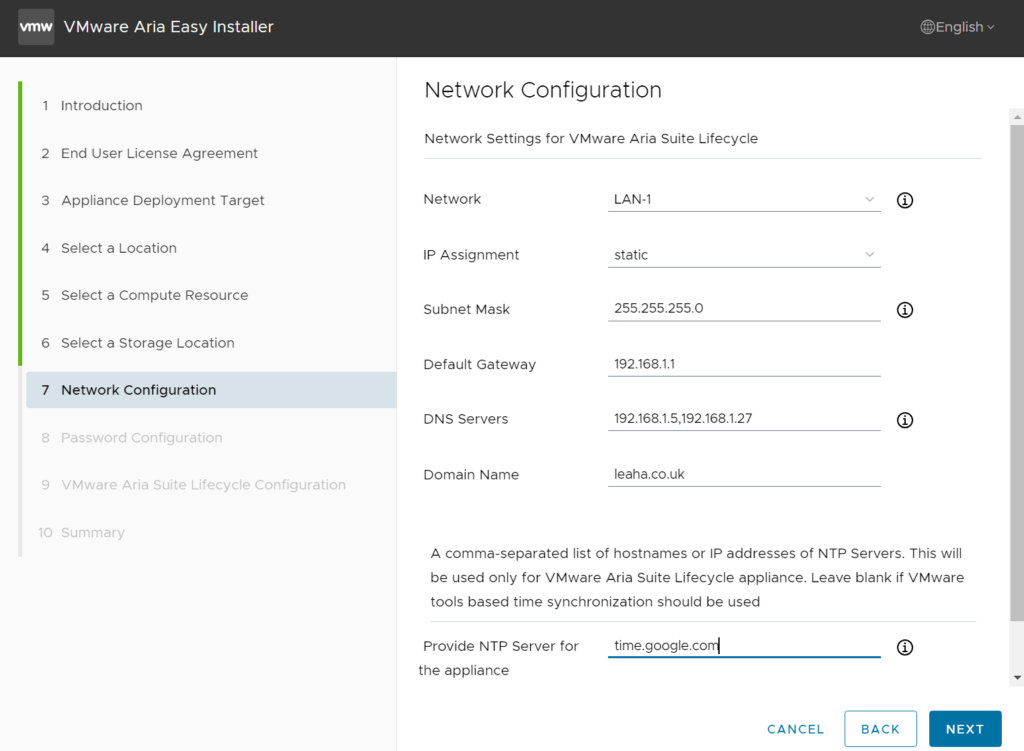
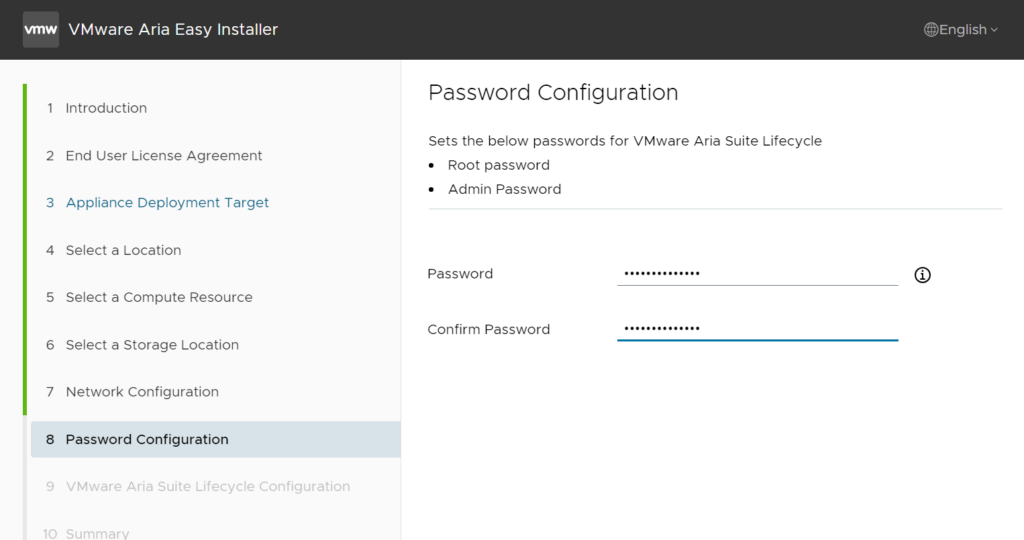
Add a password for root
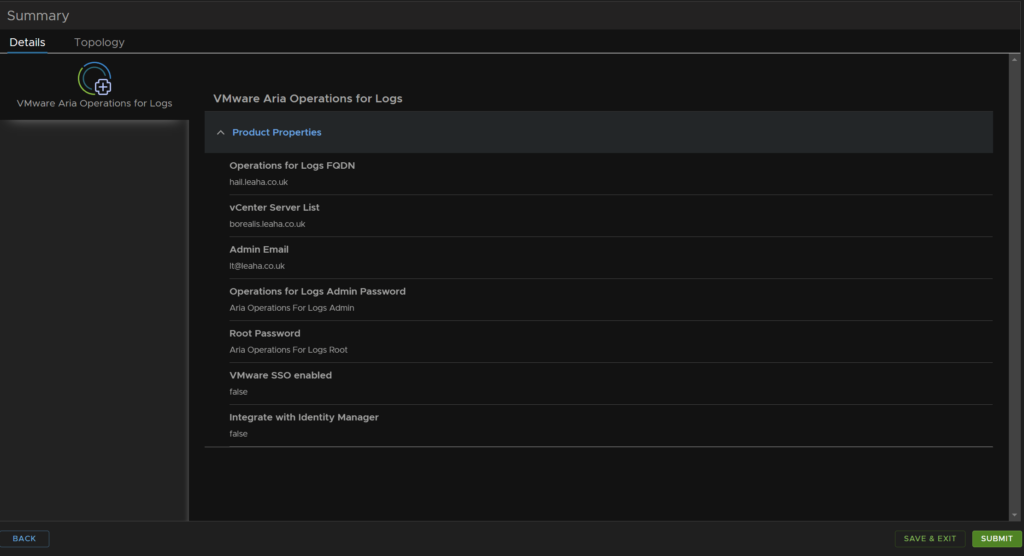
Add a VM name, IP address, and fqdn , the optional parts at the bottom you can leave unless you need to change them
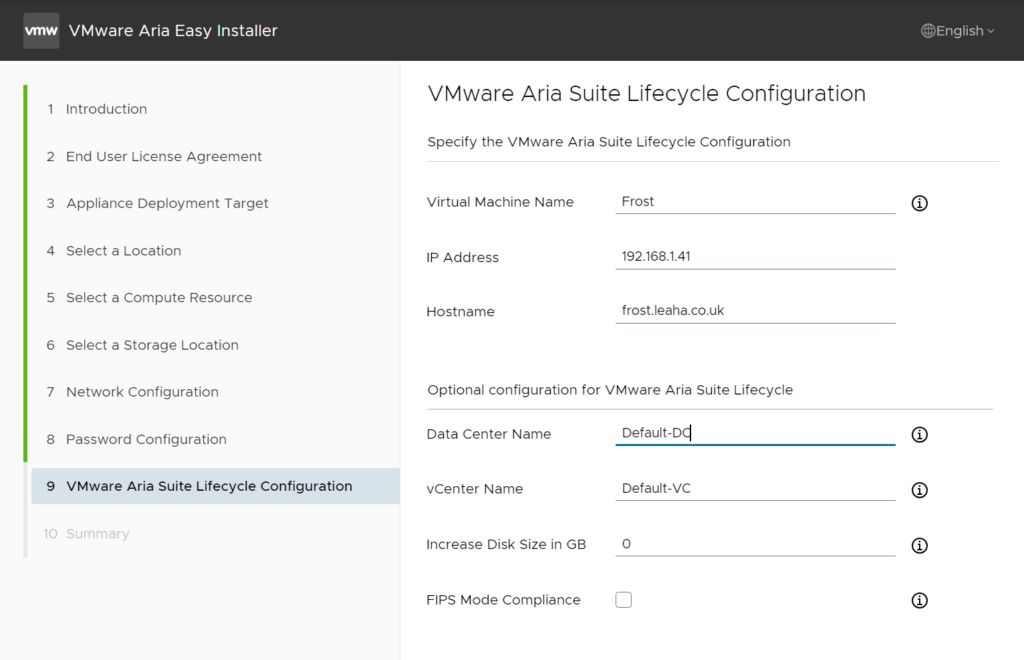
Then hit submit
You can access the appliance once the installer says its all setup on
https://fqdn
https://ip
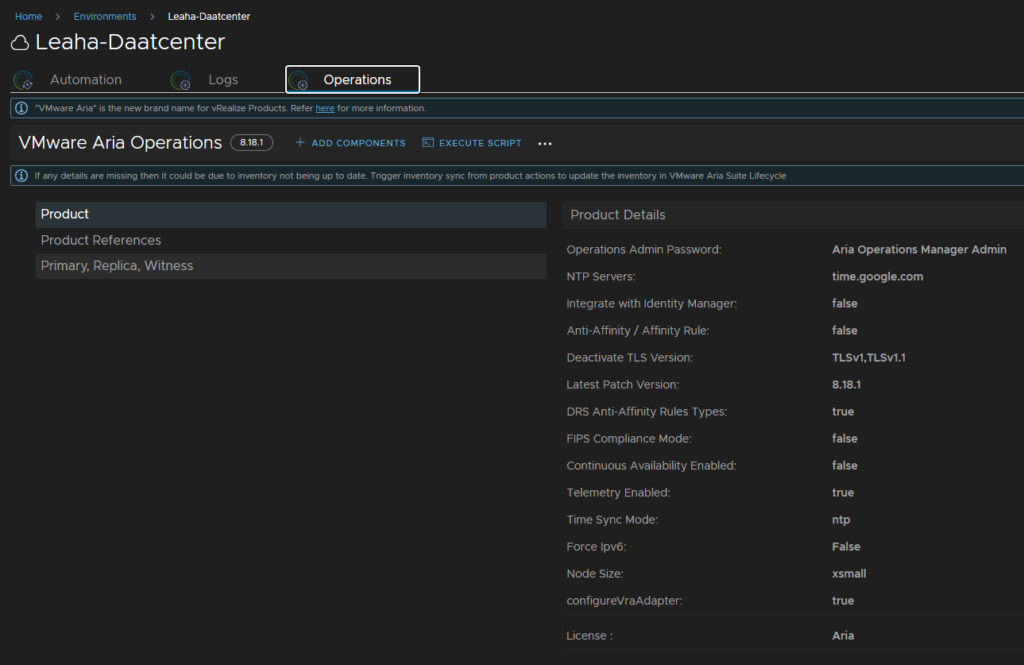
2 – Importing Into Lifecycle
Now we have the base appliances setup, lets get them added into Aria Suite Lifecycle to it can manage them, we will create an environment and import existing Aria Appliances
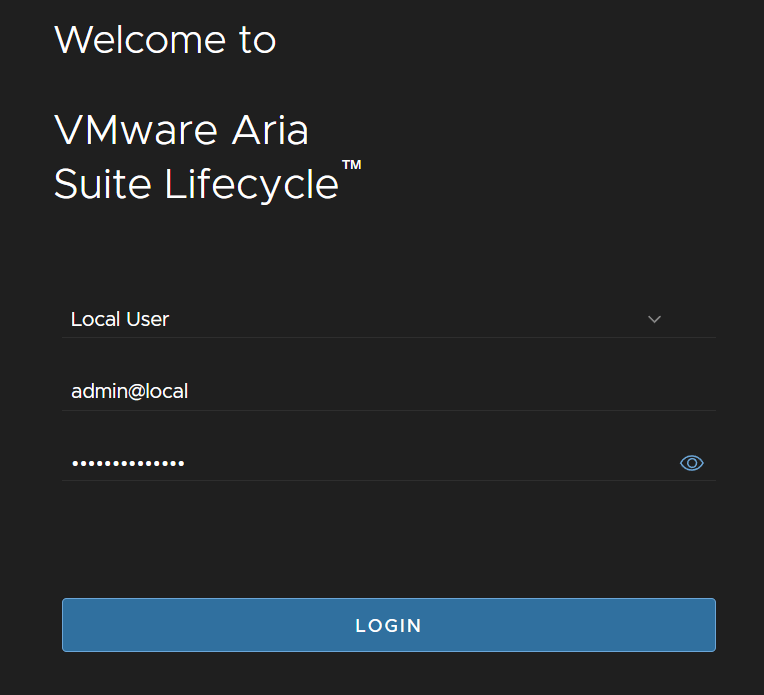
Log into the appliance on
https://fqdn
https://ip
The credentials are admin@local and the password you used for root in the deployment
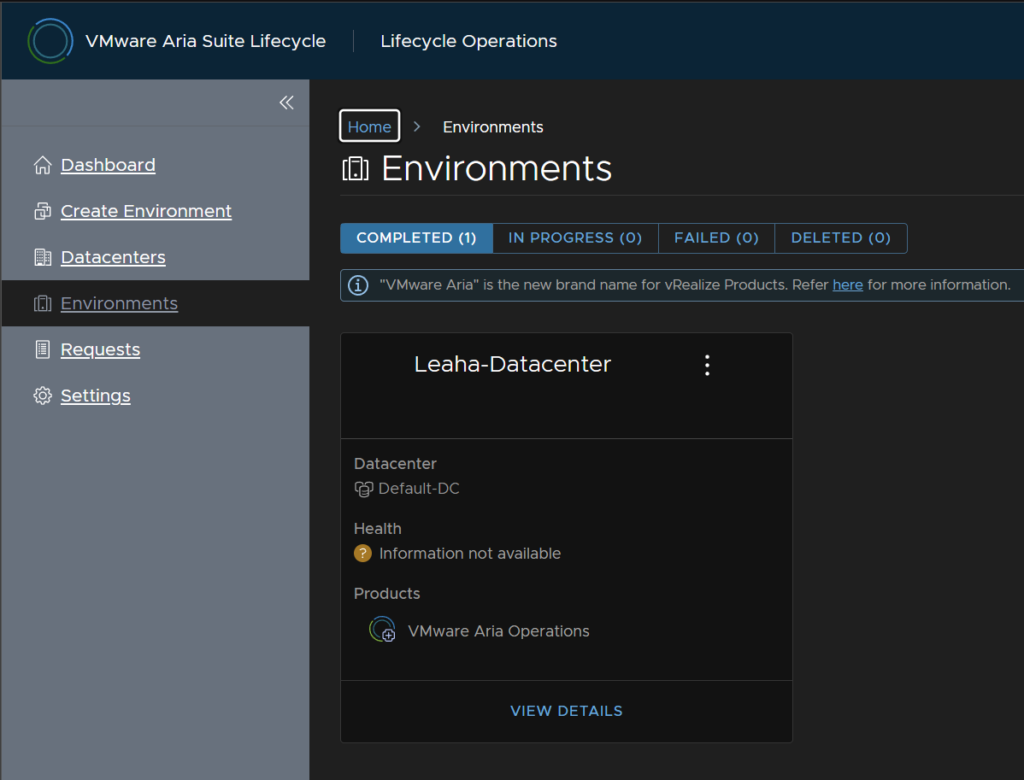
To start managing appliances head to Lifecycle Operations
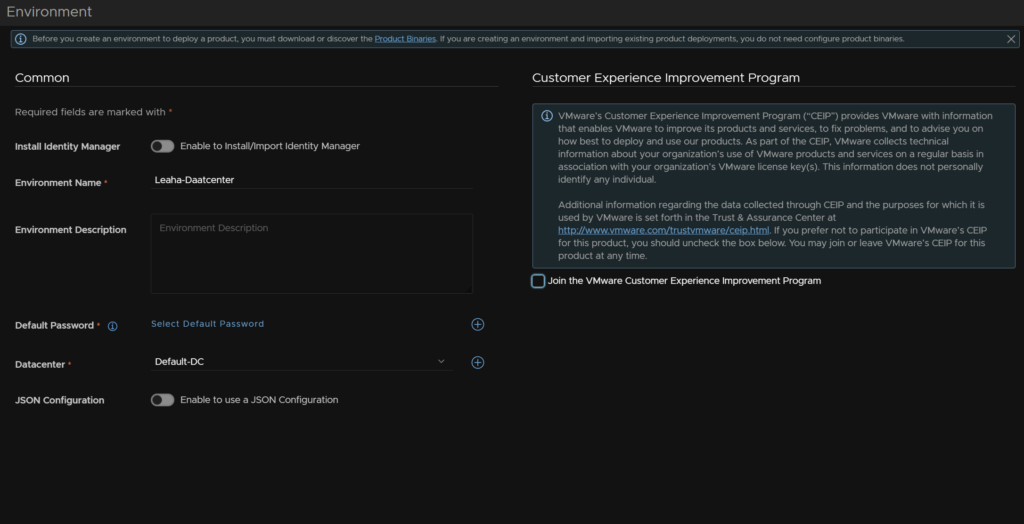
Lets first create an environment

Name the environment, select the datacenter at the bottom in Life Cycle Manager, the default from the install is fine, and click the + to add the admin credentials for it
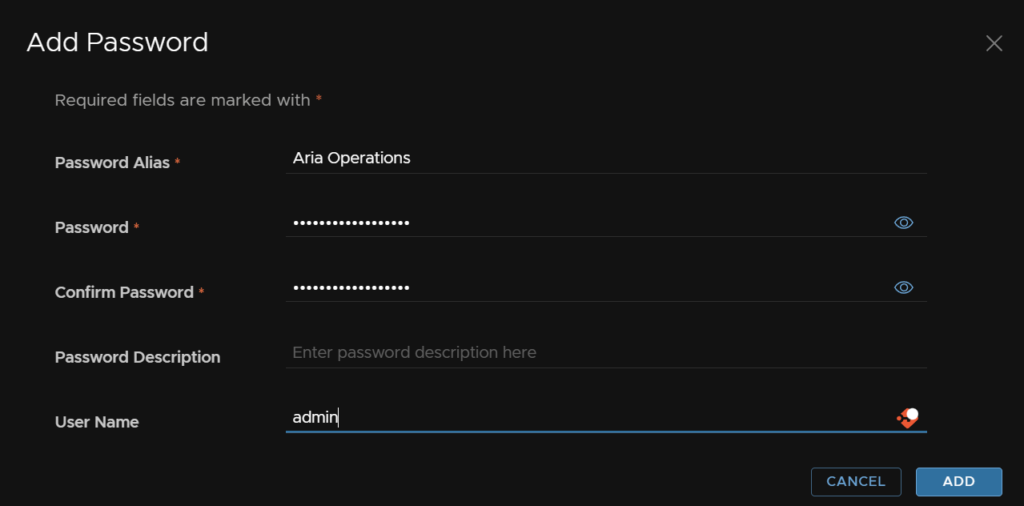
I have added my password for Aria Operations, both admin and root
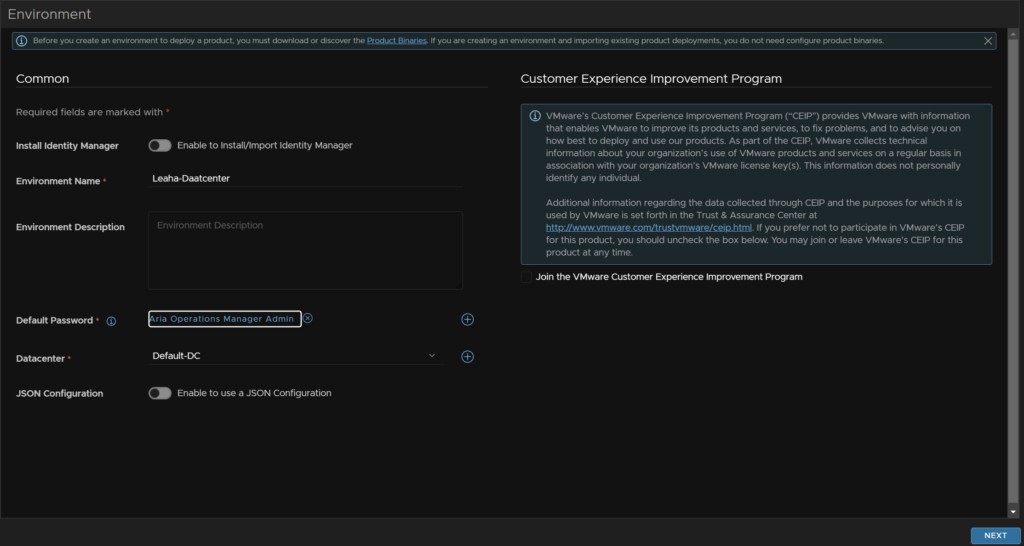
Then select the default password
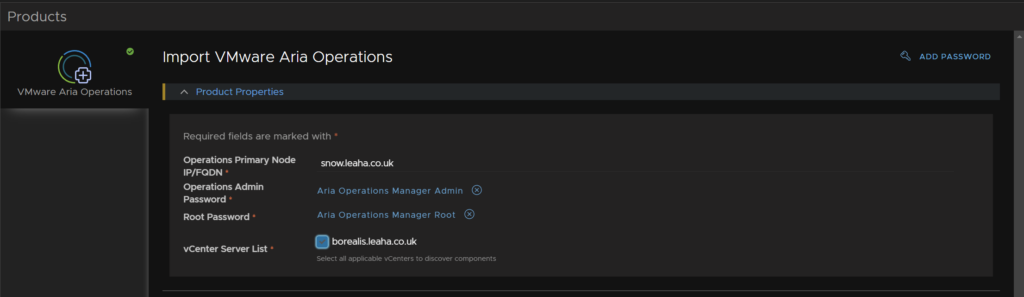
Then click next and select the appliance to add, I am importing this as I already set them up, then click next
Add details for your appliance, the default password will be used by default
Add the FQDN and select the vCenter, and change the default, which we set as admin earlier, for the root password to the root password credential
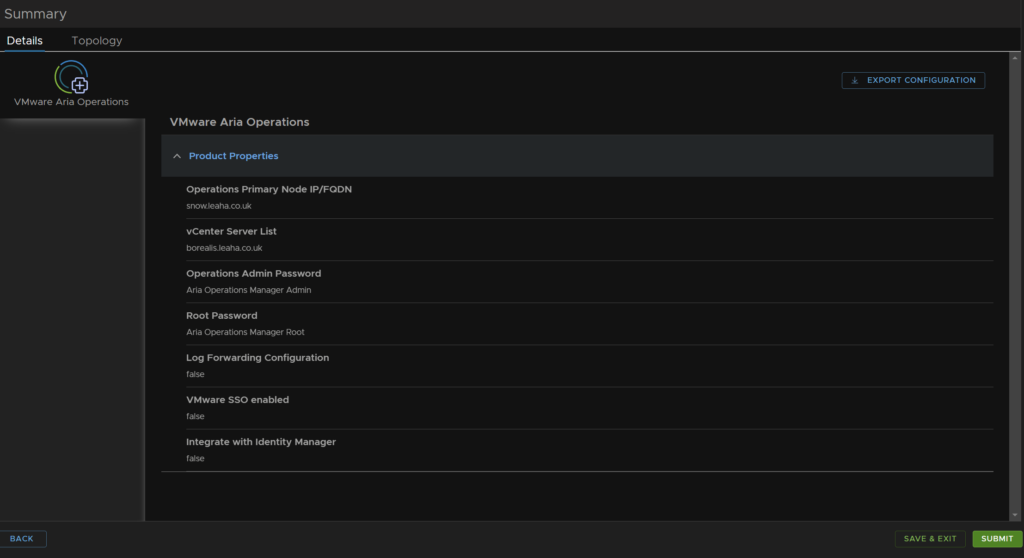
Once youve done your appliances, click next in the bottom right
Then submit
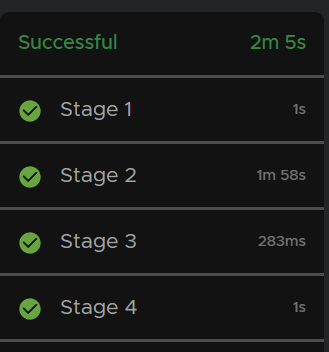
Wait until the request is done
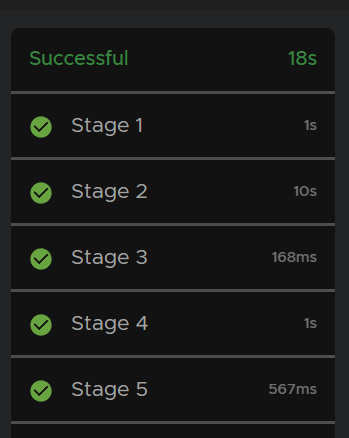
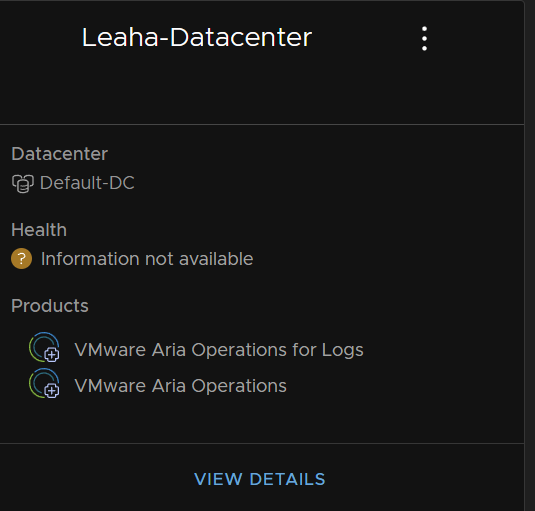
Its now visible in environments
I also have Aria Operations For Logs setup, so lets import that into the environment for my datacentre
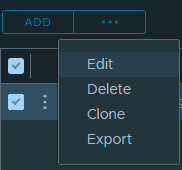
Head to the environment and click the 3 dots then Add Product
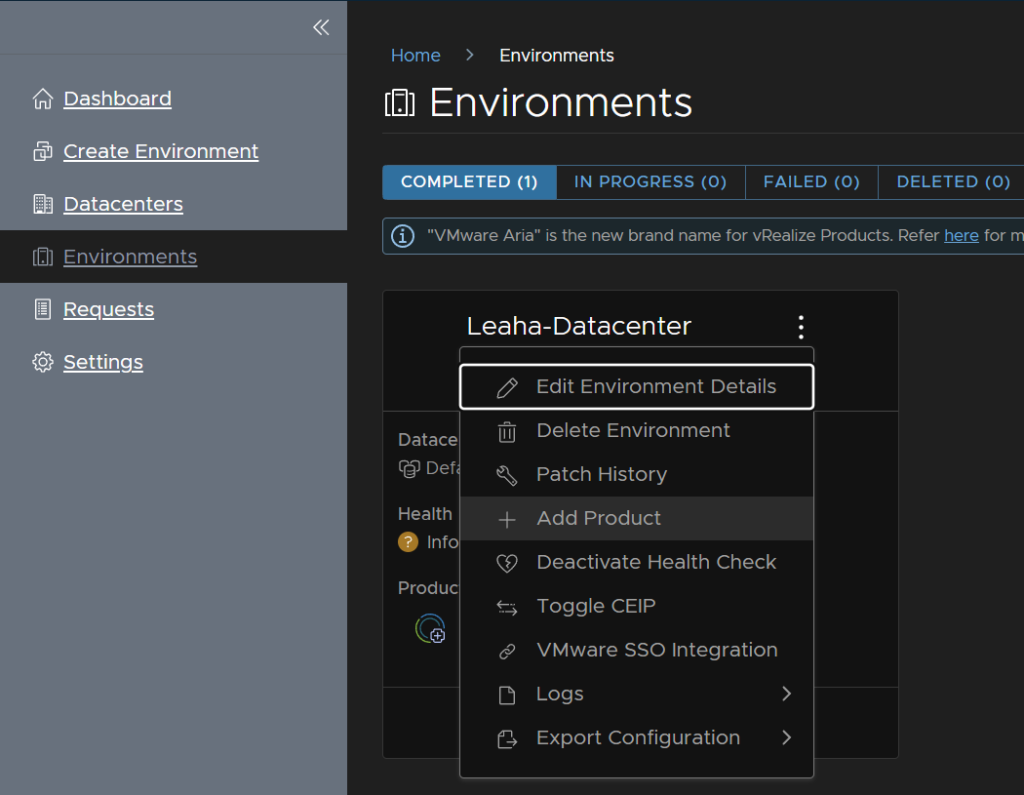
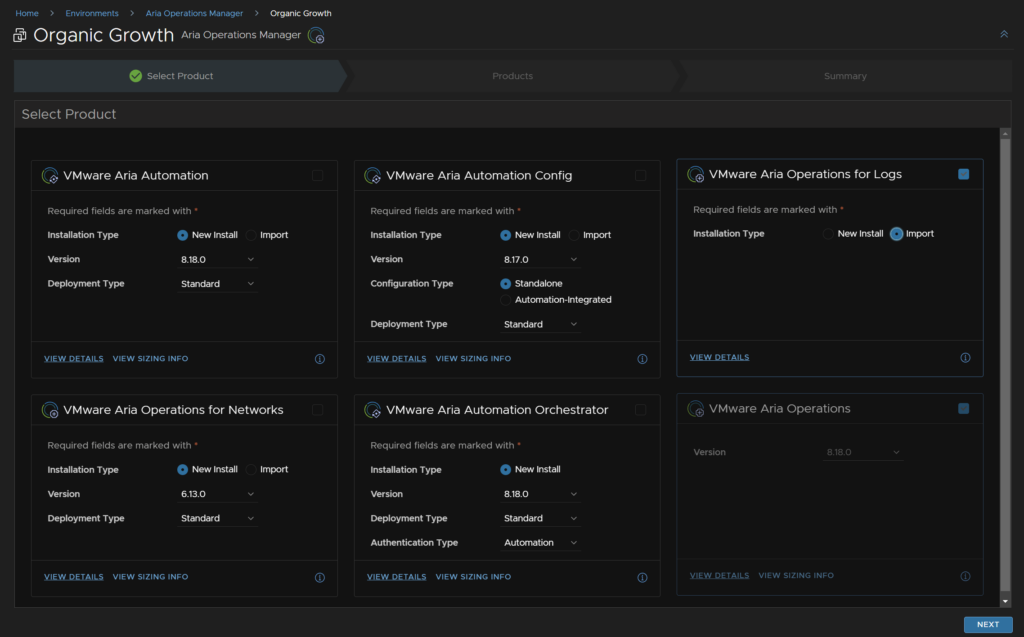
Lets check Aria Operations For Logs and import on it, then hit next
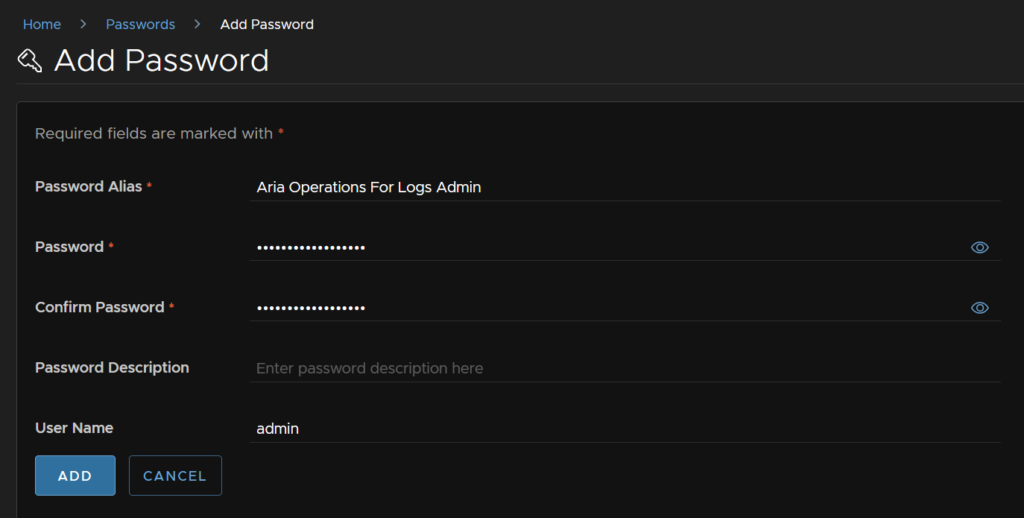
Click add password on the right to add the logs credentials
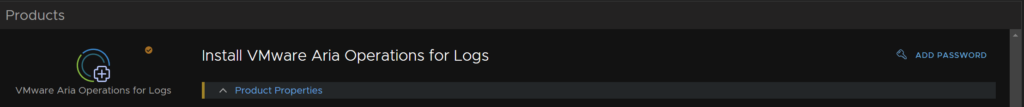
Click save
Add the admin credentials
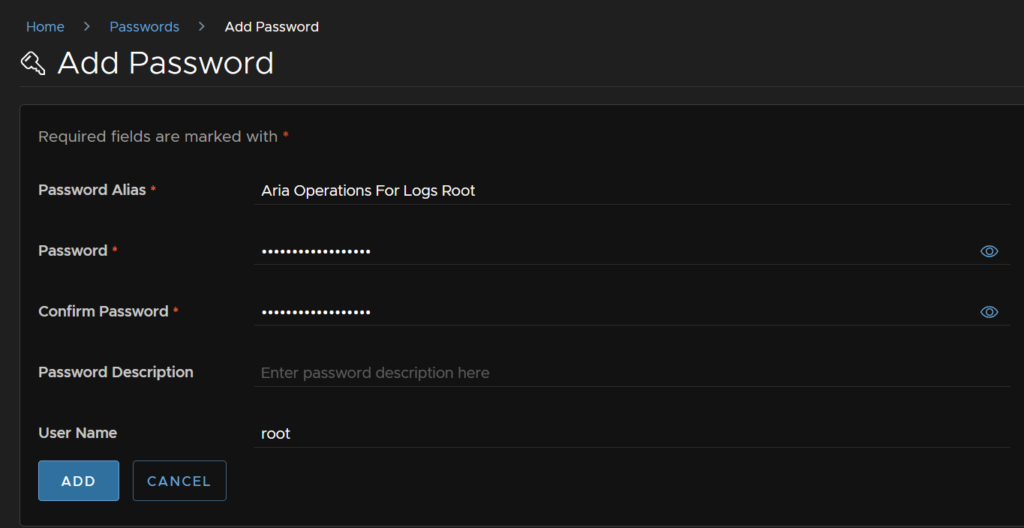
Repeat the add password and click save to add the root credentials
Fill in the appliance fqdn, email, add the password and check the vCenter box and click next
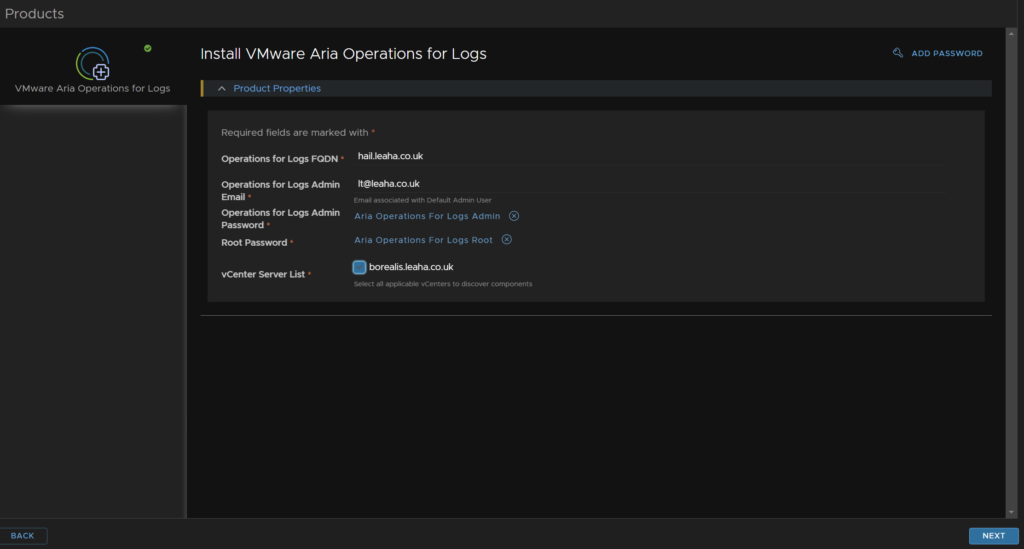
As we havent setup an Operations For Logs email, you can log into the appliance and go to Management/Access Control to set it up
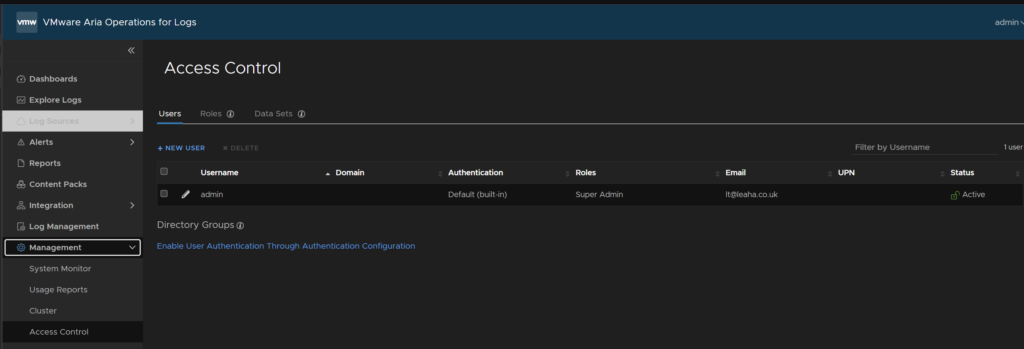
You can click the pencil to add one
Then submit
Once thats done we can go back to the environments
And Operations For Logs has been added to manage its lifecycle
3 – Post Deployment Configuration
Now we can get into the configuration of the apps, we’ll start with Aria Operations For Logs, as it feeds info to Aria Operations that it needs, and finish with Aria Suite Lifecycle
Its worth noting, once Aria Operations is configured you really want to leave it a couple weeks to set the data in, as a lot of its metrics require over time analysis, I have left that amount of time between importing the and first configurations, you can certainly start configuring things before that amount of time, however the info may not be accurate
3.1 – Aria Operations For Logs
3.1.1 – Ingestion
3.1.1.1 – vSphere
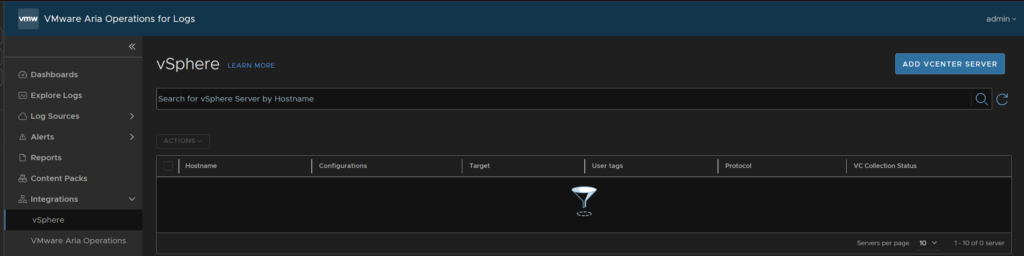
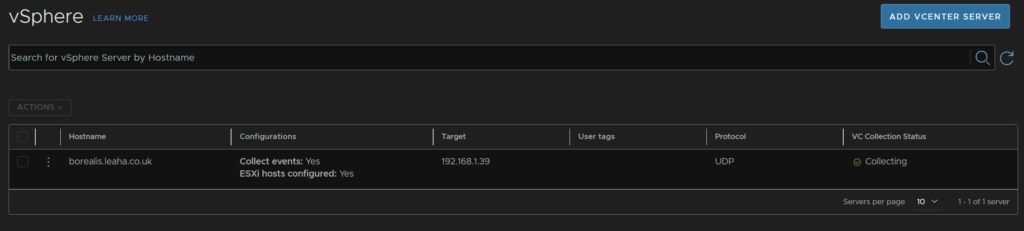
In the Aria Operations For Logs appliance, go to Integrations/vSphere and click Add vCenter Server
Fill in the vSphere info and administrator details, my vSphere domain is leaha.co.uk
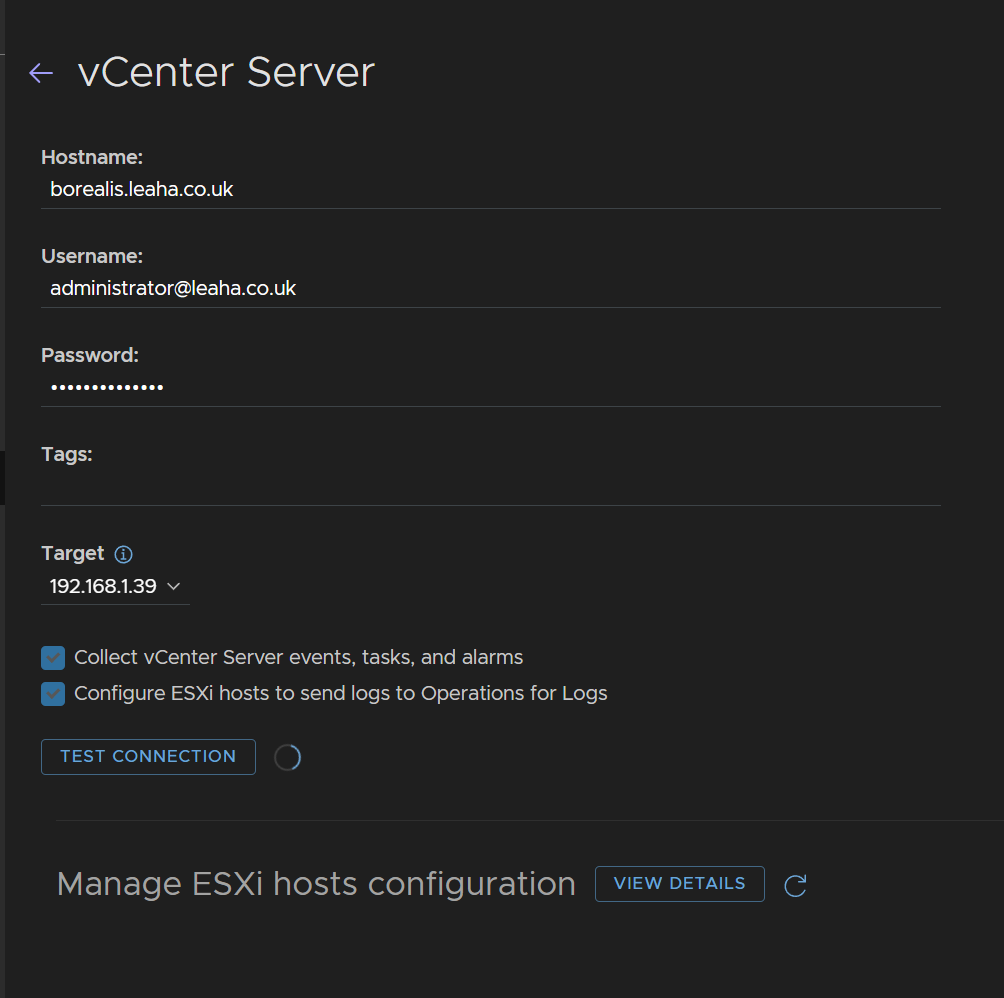
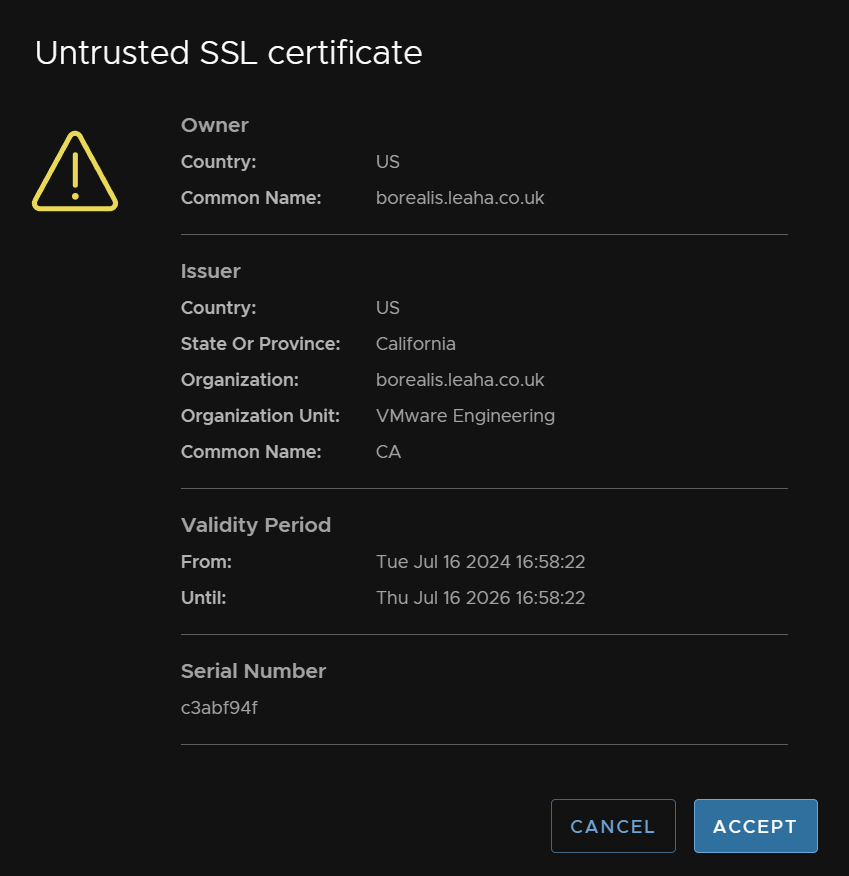
Then click test connection and accept the SSL certificate
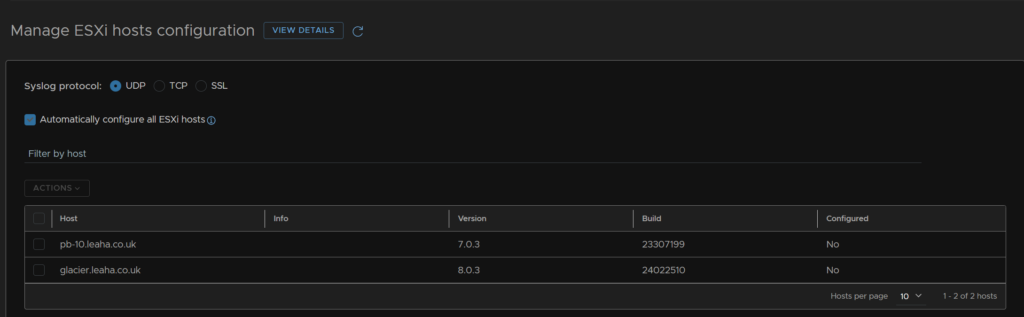
If you expand the Manage ESXi hosts part, it should be configured to auto configure them all
Once thats all done, click Save at the top right
The vCenter now shows up under Integrations/vSphere
3.1.1.2 – Adding Aria Operations
Go to Integrations/VMware Aria Operations, and fill in your appliance info, the hit test connection
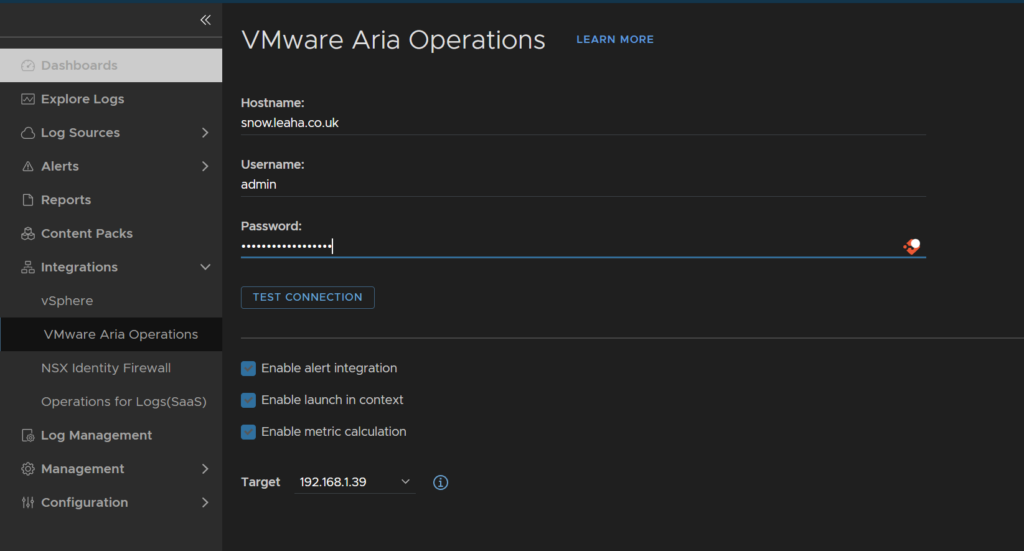
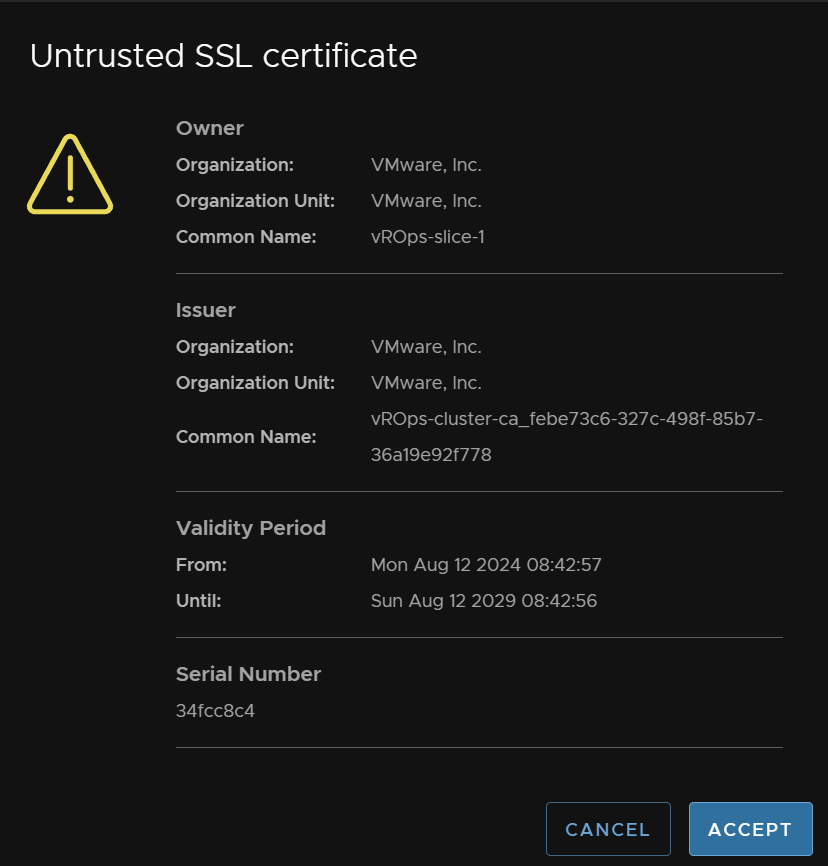
Accept the SSL Certificate
Lastly hit save in the top right
3.1.2 – Exploring Logs
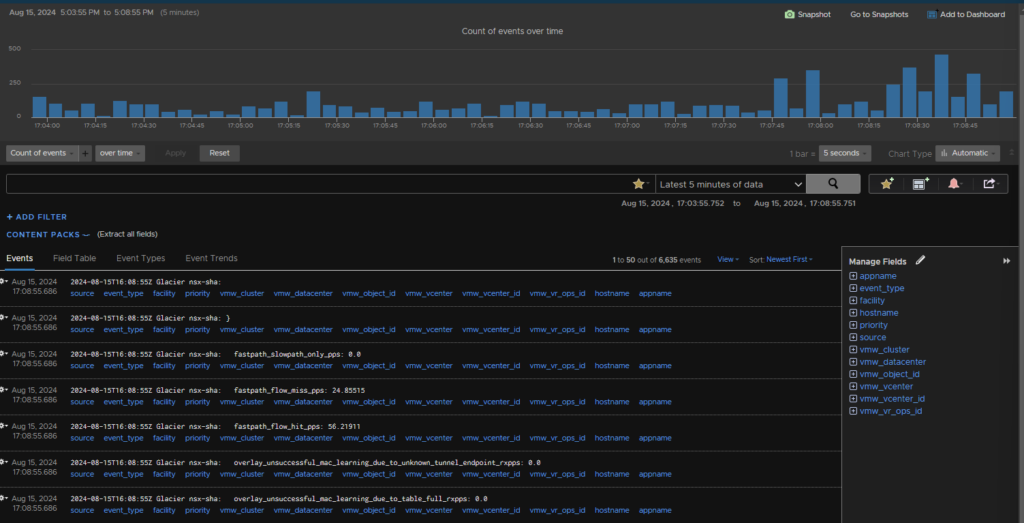
Once you have everything setup and configured for your vSphere environment, you can explore all logs from the Explore Logs section
From there you’ll see all logs in the last 5 mins by default
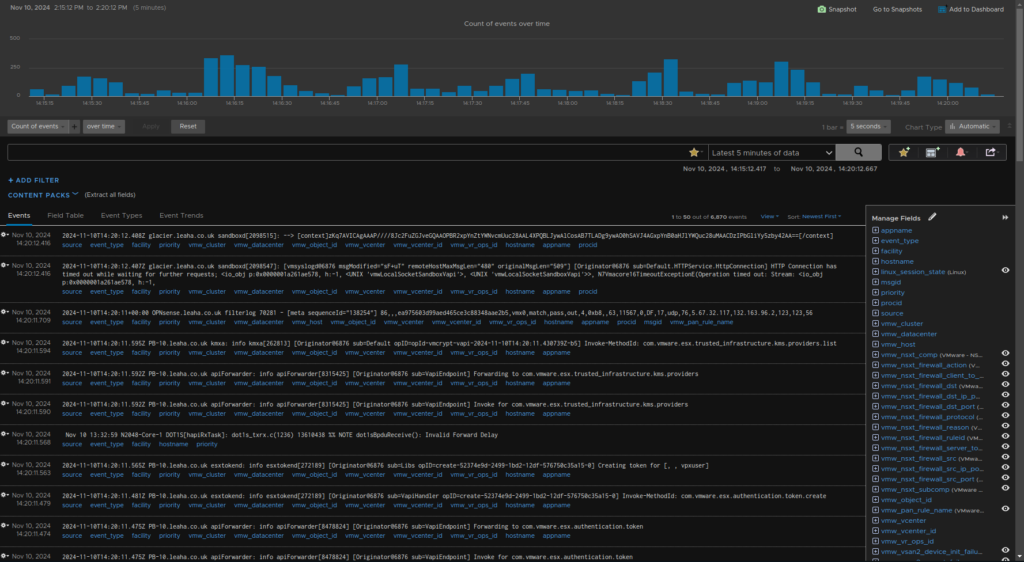
This gives you a handy place to see all VMware logs, as normally, for ESXi/vCenter, everything is in several different files
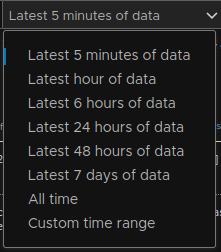
You can drag the mouse across the bar graph showing log volume to specify a particular time, or manually enter one by expanding the log time drop down, to the right of the search bar
I can also add filters and specify a search for a particular hostname

I could also specify text to search for in the log, for example, snapshots, if one was removed and this wasnt expected
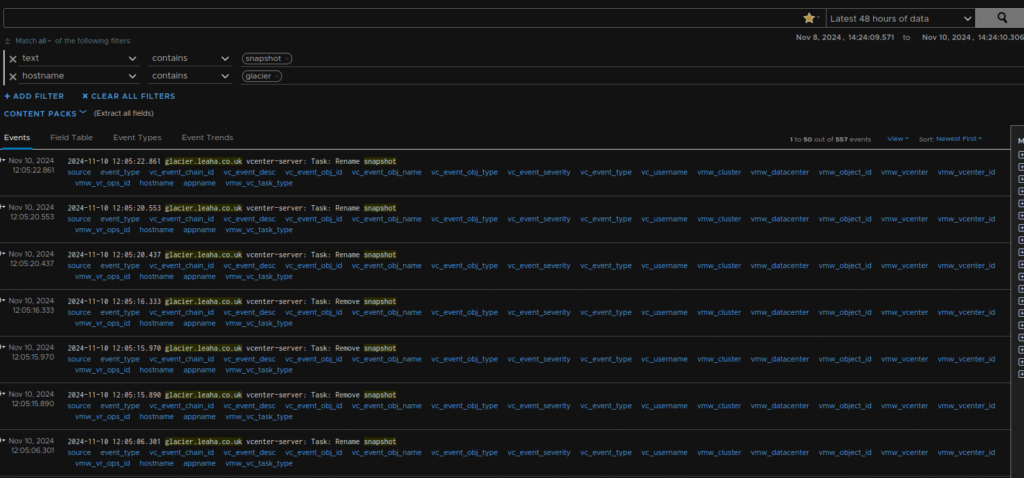
I can attribute this to a time, in my case, my VBR replication job, however the info for the vSphere account isnt stored in log files and is only available from the GUI
I could also view all error alerts for a given host in the last 7 days
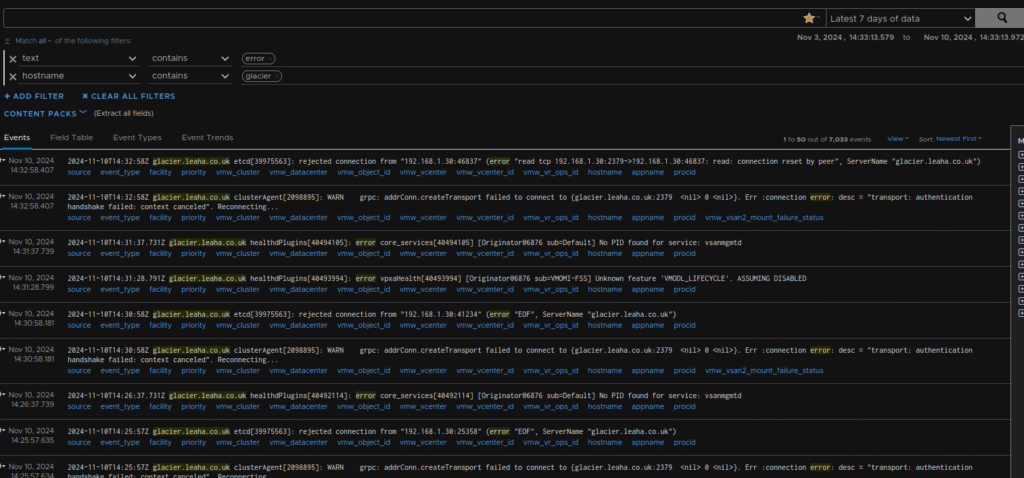
This isnt really useful on a day to day basis, however, when something goes wrong in the environment, you can search this significantly easiler than the ~100 log files across ESXi/vCenter
You can also configure syslog to forward here from other hosts, I configured a few servers and my TrueNas server to log here via syslog UDP port 514, and the server gets all of these for me to view
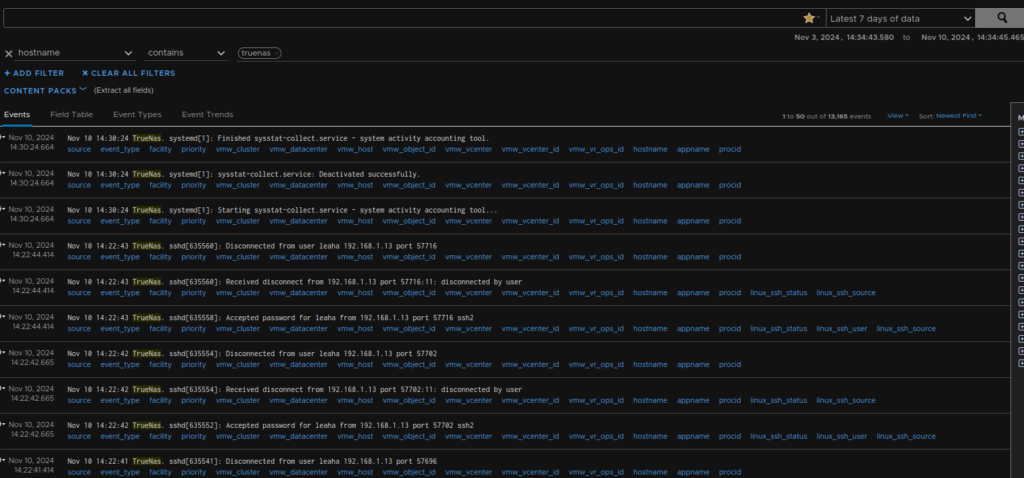
This is the real strength of Aria Operations For Logs, centralised, easy, log management for your environment, not just VMware
3.1.3 – Log Filtering
When you set this up, it takes in a lot of logs, and the default 530GB can fill up very easily
The default setup is for the server to fill this drive, and remove logs as the drive fills
But what if you want to retain logs for a longer period of time, but can as the drive fills up
Well, you can add more disks, but thats a great way to fill your SAN up with logs you might not need
So, Aria Operations For Logs allows you to filter out logs and not store ones you dont need, though you should be 100% sure you wont need this before telling it to drop it, as if you come back later needing it, you can get a dropped log back, of course, you can disable the log filtering rule, but that wouldnt help you with an investigation, so proceed with caution
First things first, we need to find something we dont like, the best way here, is to drop an app name
The best way to do this is to find an example of something being very noisy, that, when you look at the logs, is pretty useless, lets take ESXi as an example
If we filter for an ESXi host, glacier.leaha.co.uk, in the last 24 hours

Then expand the Over Time menu by clicking it, and selecting appname, then apply

This will filter everything by its app, and show you how noisy it is
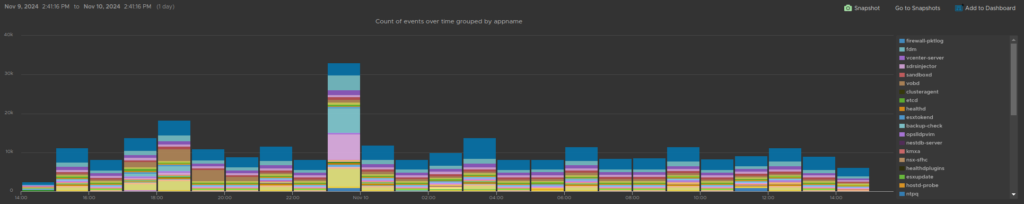
FDM seems to be logging a fair bit, hovering over the large bar section
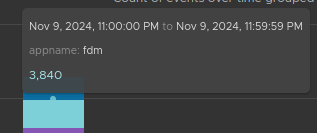
If I then click that bar, it will filter all logs showing me only fdm appname logs below
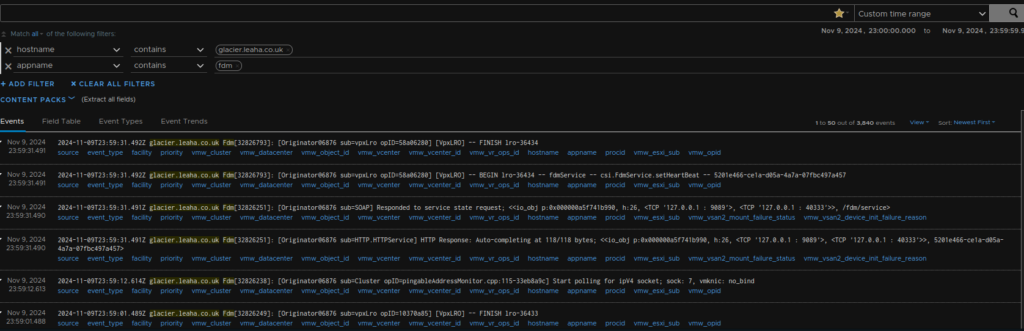
Scrolling through these, nothing here seems remotely useful, so I will use this as my example, I want to drop these
I can heat to log Management, the Log Filtering

Click New Configuration, its worth noting 5 seems to be the max here
I can give the rule a name, lets say ESXi_Drop, as I would want all ESXi drop rules in one, then select a hostname filter, and select all ESXi hosts, and then add an appname filter matching the appname we got before, fdm, the hit save
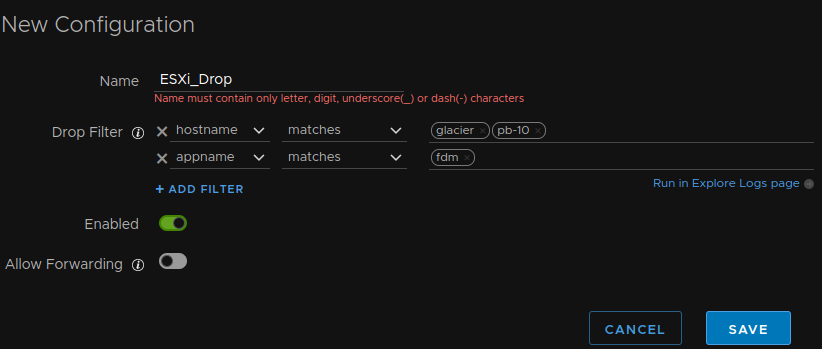
This will drop any fdm logs from those hosts and not store them
3.1.4 – Retention
You can configure the default retention in the log server from Log Management/Index Partitions
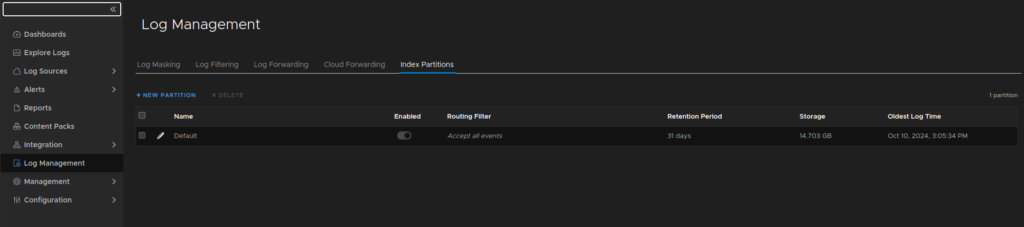
You can click the pencil to edit, I set my to 31 days, but the default is to keep logs until the system drive fills up, as its separate from the OS
As I filtered my down, I dont want everything storing for months, so I have 31 days
3.1.5 – Dashboards
3.1.5.1 – Overview
There are a lot of different dashboards in by stock, with several categories
Eg vSphere
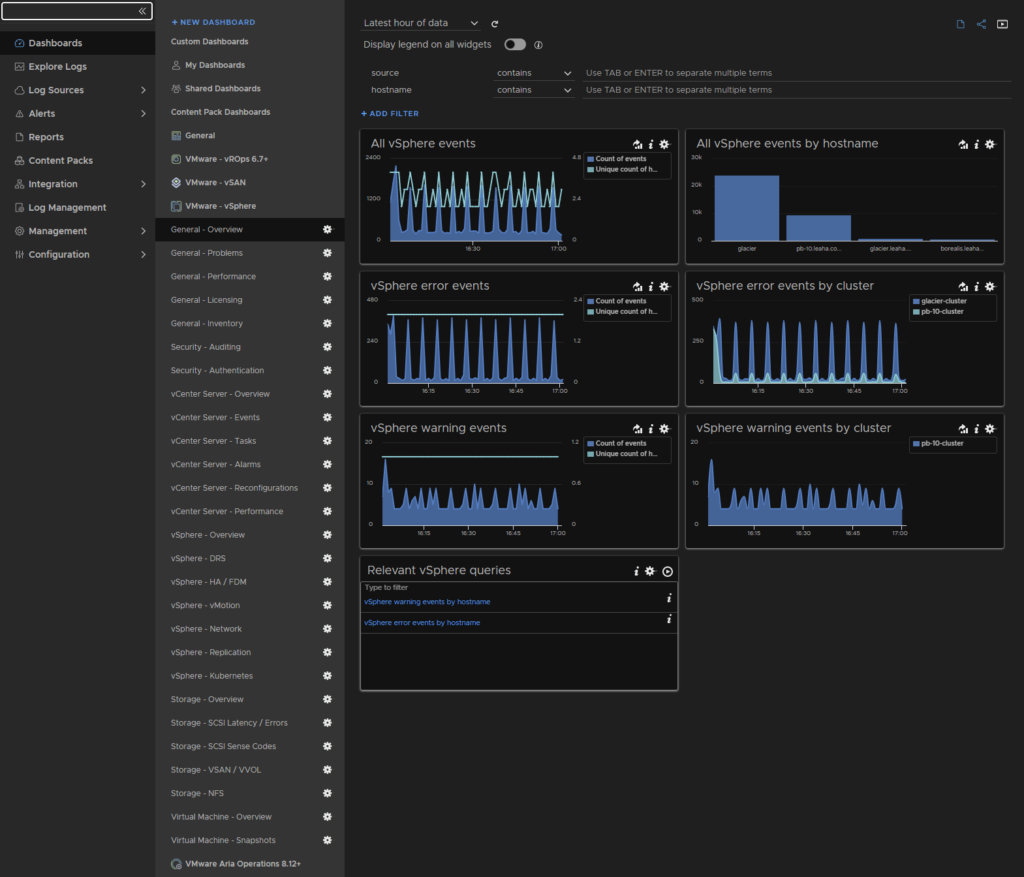
You can use these as templates for custom Dashboards
3.1.5.2 – Firewall Dashboard
A solid dashboard you can do with this is one for your Firewall, now this will vary depending on your environment, but if you configure your Firewall to log to Aria Operations For Logs on UDP using port 514, then all syslog events will be recorded here
You’ll also want to ensure any rules you have are enabled for logging, as some firewalls can default to not logging rules
This example will use VMware’s NSX firewall, as that is what I use at home for my security, however the overall premise is the same, as all widgets are derived from log filtering, this can apply to any firewall and it doesnt need to be VMware related, in theory, so hopefully with this example you can see how you can apply the log filtering and dashboards to your environment
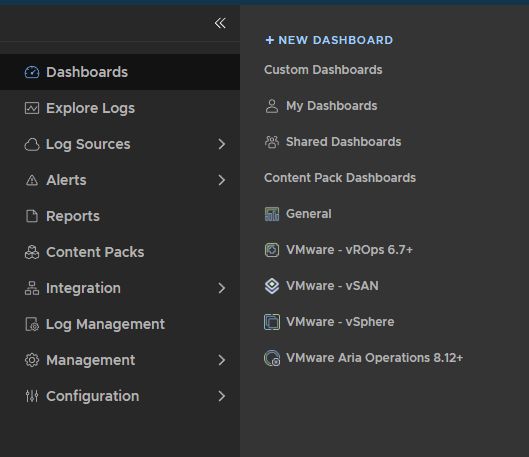
Lets create a new custom dashboard, so I can get the logs I want, there is also nothing for NSX related logs in here by default, so this will be a good demo to start with
Lets click new Dashboard
Give it a name and hit save
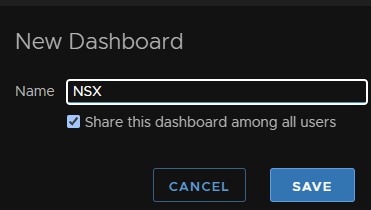
This will create a new shared dashboard anyone can see, under Shared Dashboards
Now, its blank, so we need to add some widgets
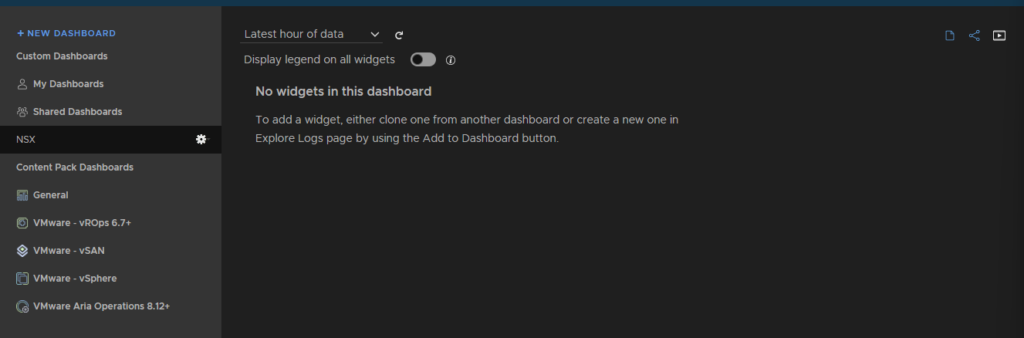
To go this we need to explore the logs and see what we want to track, this is what the templates in, for example, vSphere, are great as you can take one you like and clone it to your own dashboard which is simple, for NSX ESXi logs, we need to do this manually
Go to Explore Logs
First, lets have a think about what we want to see, the best way is to look through the vSphere log entries, or use the search to find something having graphs would be useful
So, first I want to know how many NSX DFW logs there are, these are quite helpful to see, I have my DFW setup to log everything except the default layer 3 rules, like the any any allow rule as this generates a lot of traffic currently, though with Aria Logs this could be logged as Dashboards could allow better visibility and tracking, using the ESXi CLI to view the log file is way to busy with it enabled, but I will revisit that later
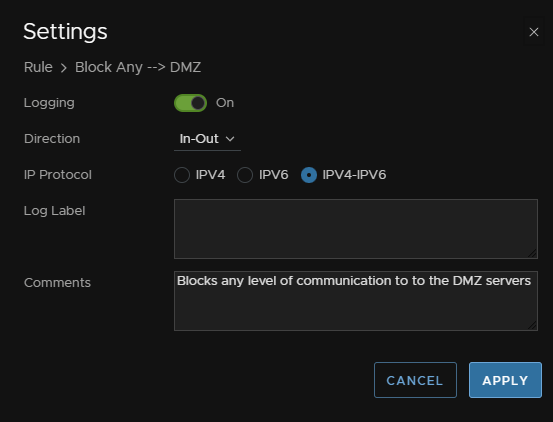
Logging for rules needs to be enabled by default, to do this click the cog on a rule on the right
Eg on my DMZ block rule

And ensure logging is enabled
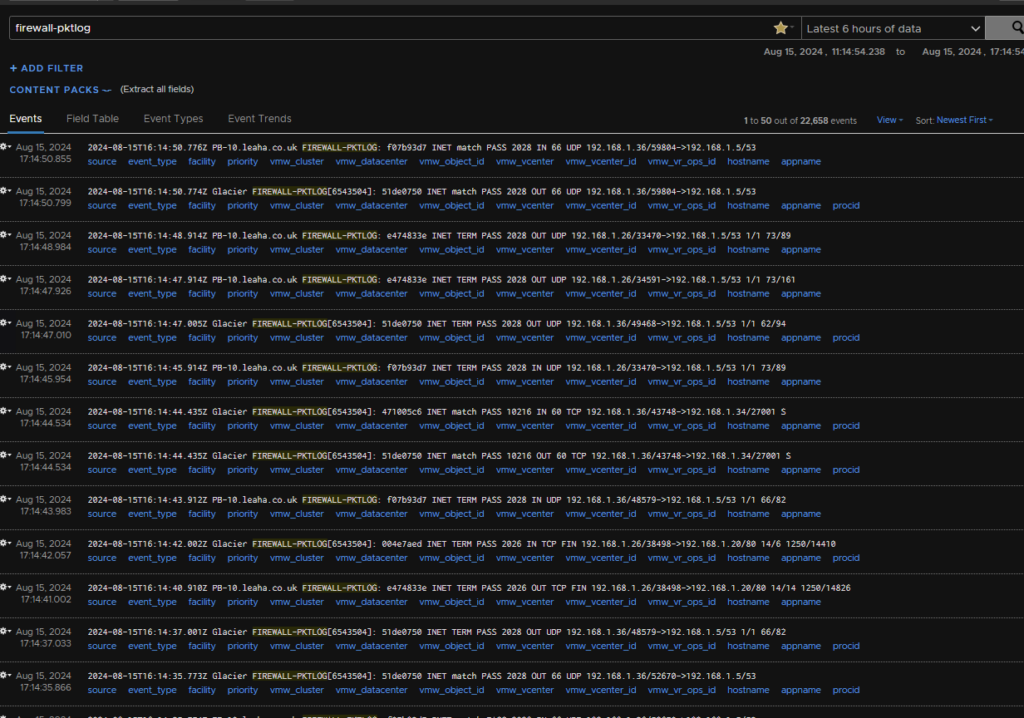
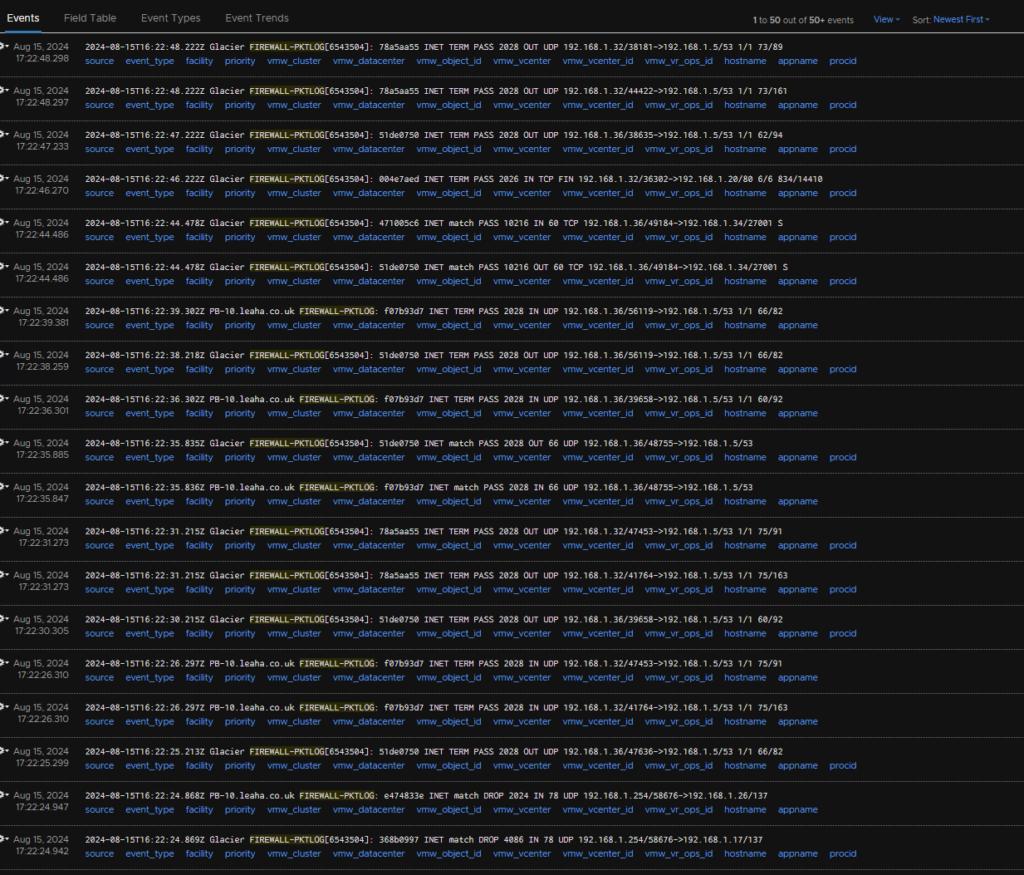
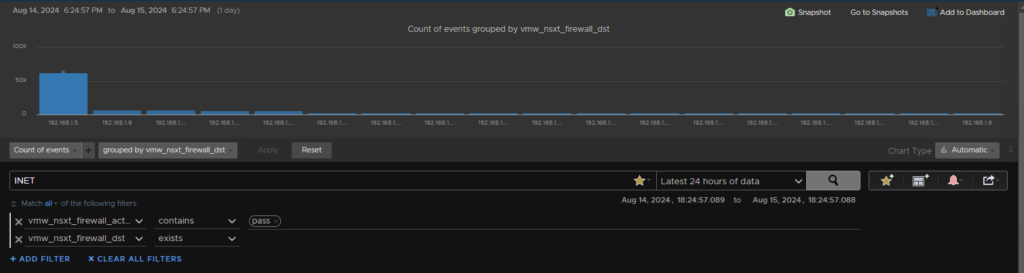
So, if I want to see all logs in Aria that are for the DFW rules, I can filter for ‘firewall-pktlog’ as they call contain this and mothing else does
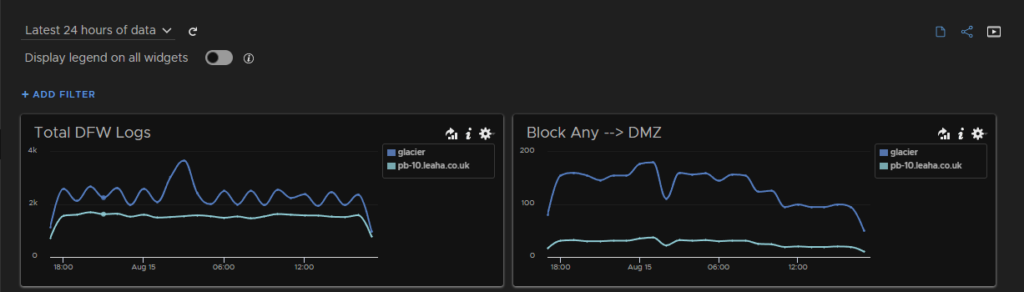
This give me a good overview of all DFW logs
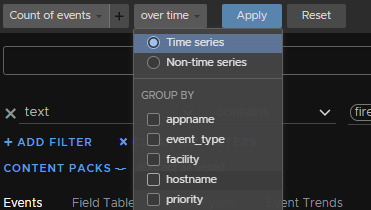
Now a filter is a little better, and thats what we will be using for our custom dashboard, so click add filter and set it like so
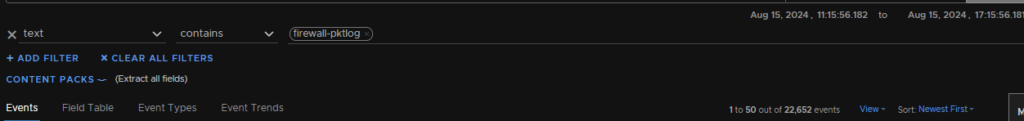
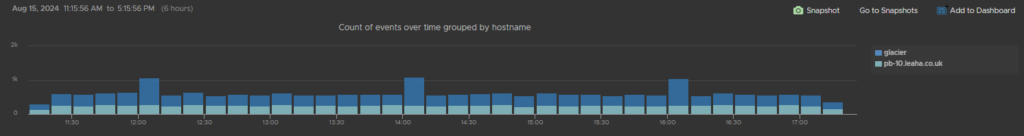
This is just DFW logs so far, a good start, it would also be good to see which of my hosts the logs are coming from as well, so lets group by host, click into Over Time here and select host name, then apply
This is looking better, now I can see how many logs in total, and for each host
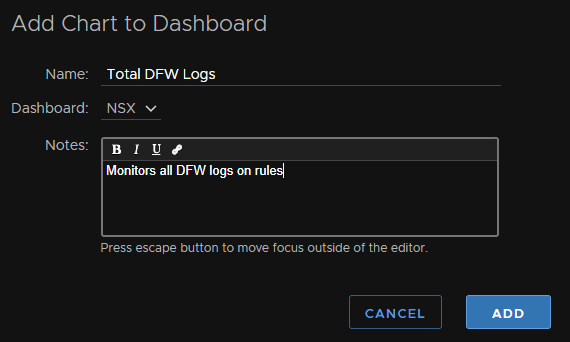
Lets click add to dashboard in the right to add the widget for monitoring all DFW logs
Name the chart, select the NSX dashboard, and add a note, then click add
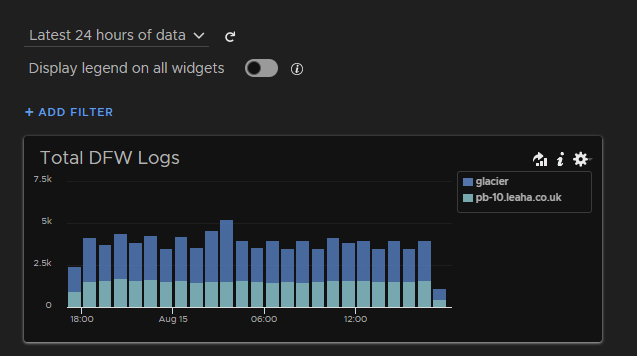
Now I can see a widget of this search from my dashboard and can change the time in the top left
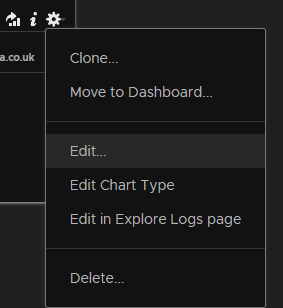
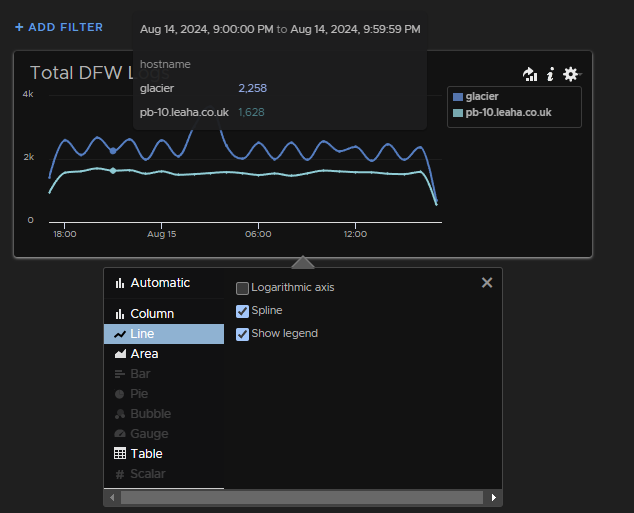
You can also edit how this looks using the widget cog, the edit chart type
Here are some examples of what you can change design wise, where each point is an hour of logs and how many there were
Ok, now I have all logs as metrics, and I can view the individual logs by clicking the icon left most of the cog, this bring be back to the search if I want to examine them
This is neat for reporting and informational purposes, but what about helping me drill into issues and something more specific
Well, each NSX rule is assigned an ID, going back to my rule blocking anything going into my DMZ, this has an ID of 2024

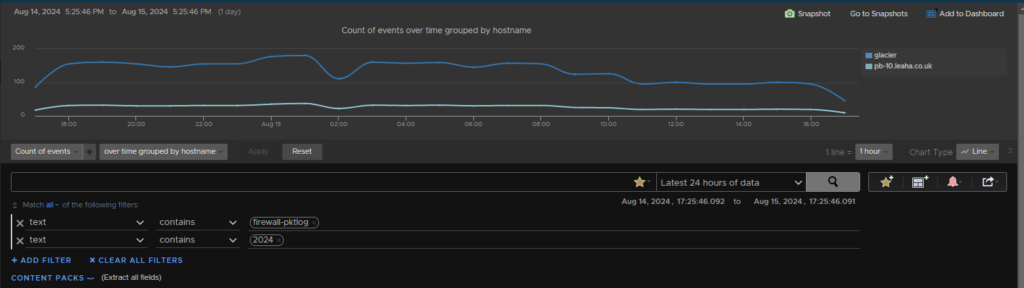
So I can use this in addition to my firewall-pktlog to filter for logs on this rule only, this is more helpful for troubleshooting as well
If we add another filter for text containing 2024, it grabs all logs that have 2024 and firewall-pktlog
So I will add this to the dashboard
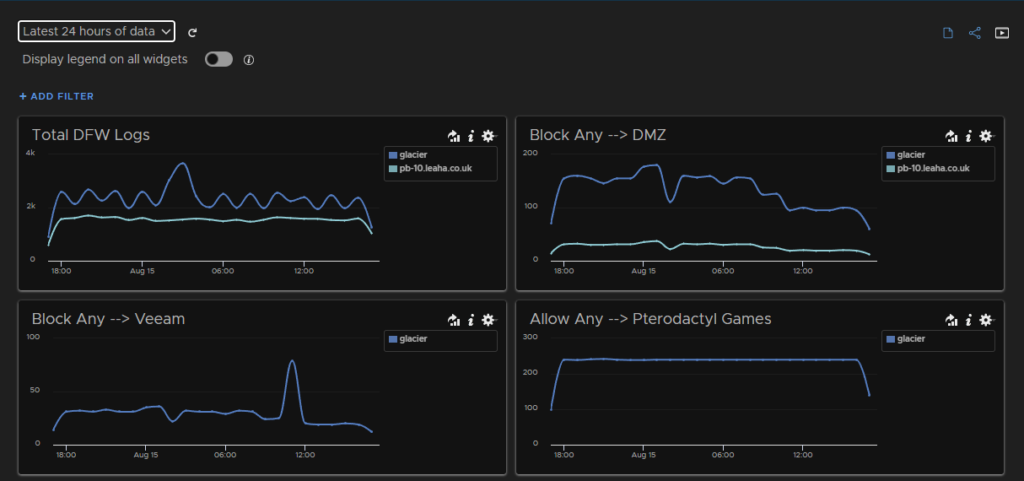
Now we can add widgets like this for important rules that might help in troubleshooting
Here is an example of a few more I added for some rules I want to keep an eye on, like things trying to get into the Veeam environment, I want to know if there is a spike of blocks as someone might be trying to set in, and monitoring access to a game server
We can then add a dashboard for what devices have the most passes and drops in the DFW by source
For passes, you can use these filters, here I have grouped them by source IP
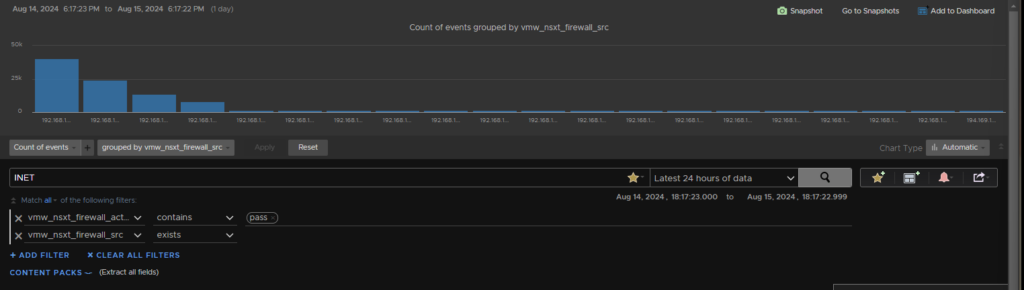
And add to dashboard
For drops, swap pass to drop
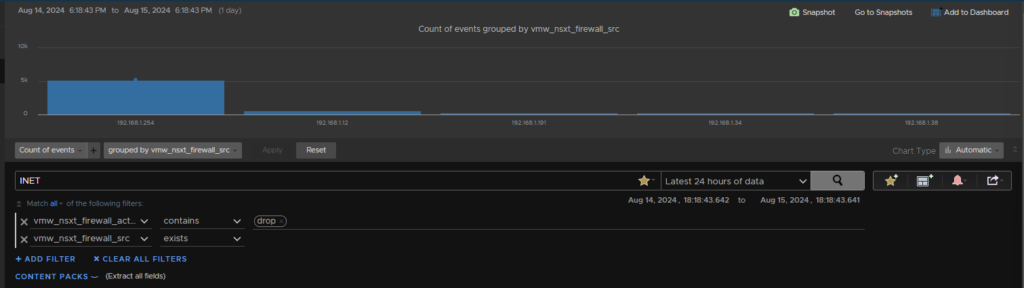
We can then also edit the chat to a Pie, which is a little more readable
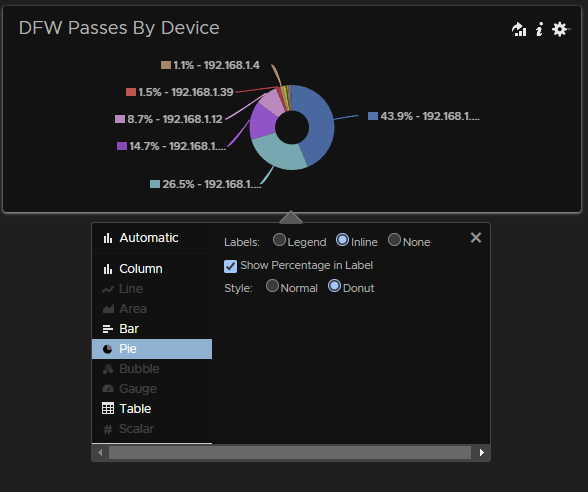
For destination use this

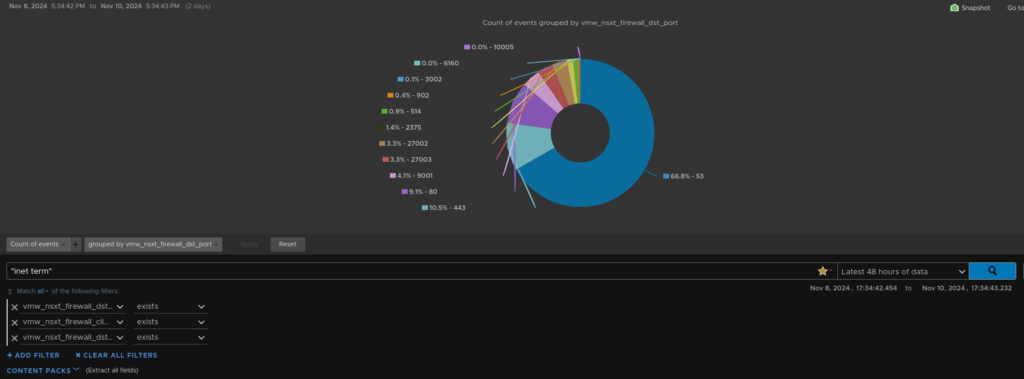
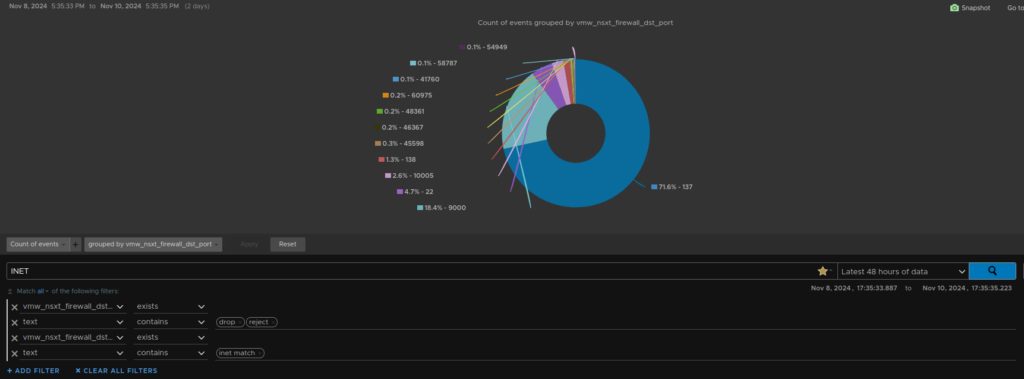
We can also grab application ports by allowed and blocked with this, grouped by destination port and changing the chart to a pie chart
I have also enabled remote syslog for all NSX applications for more logs, for a standard firewall, you would have set this up for the above
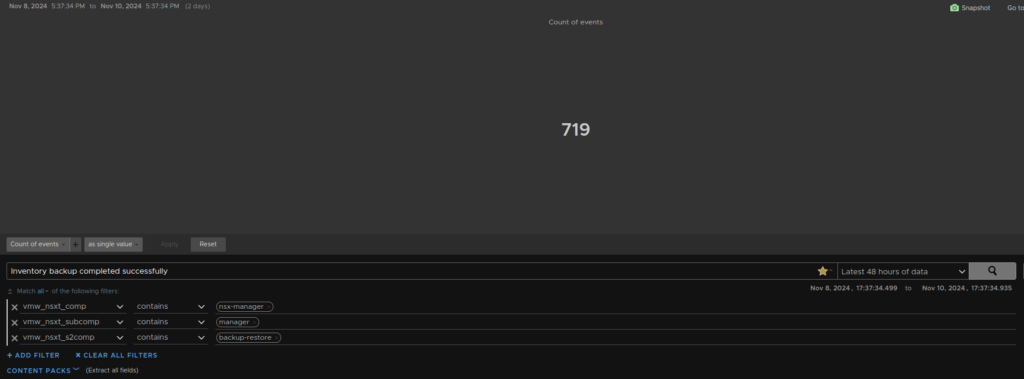
Now when a manager backup runs under this search
We can then also add these for Cluster backups and failures for both as syslog events are generated for them
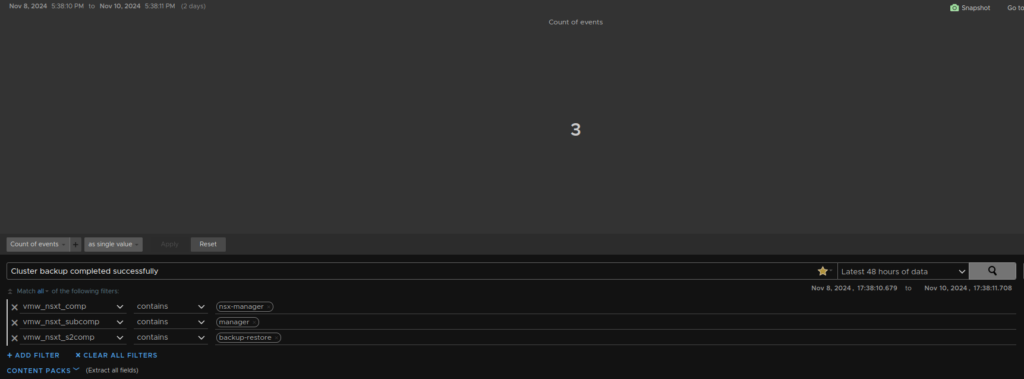
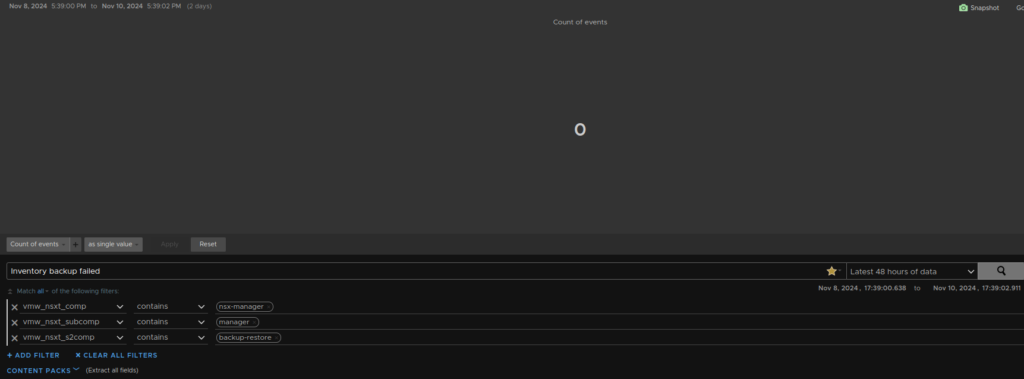

And create widgets from those searches like so

3.1.5.3 – Backup Dashboard
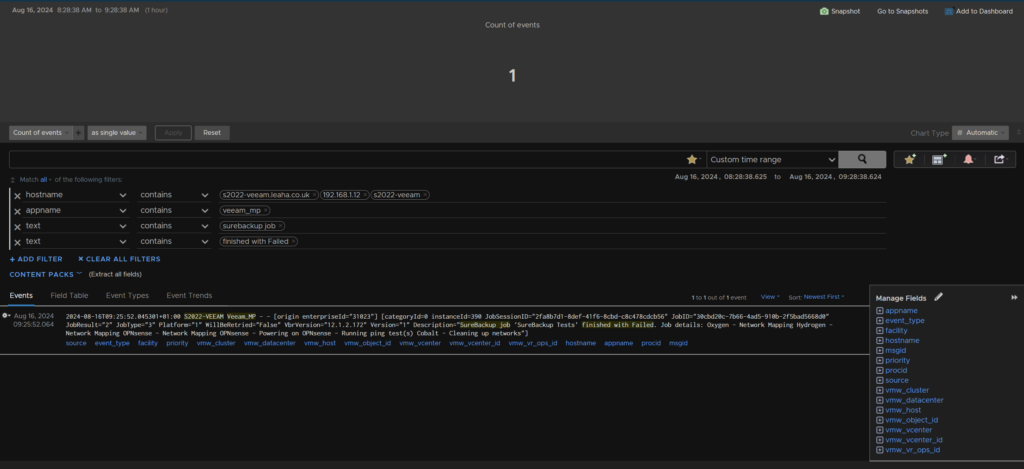
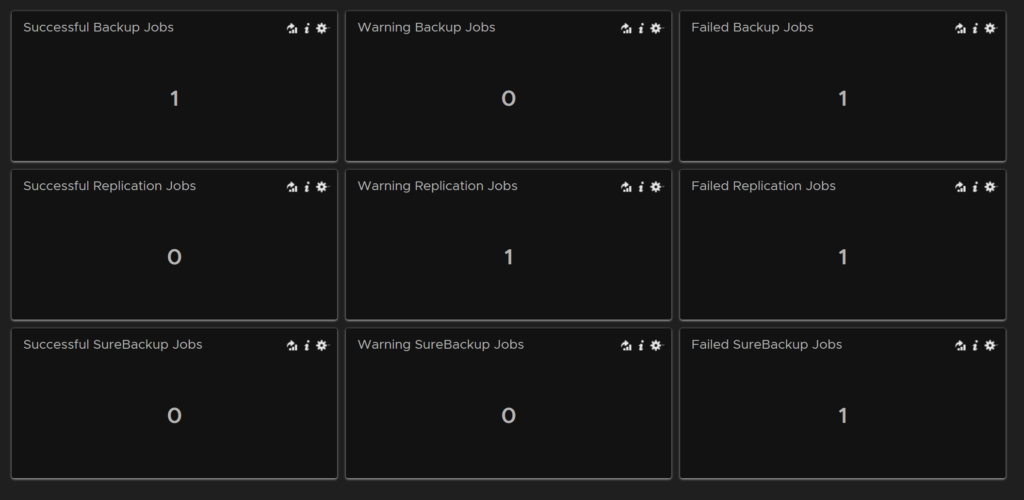
Here is another example using a Veeam as a basis for a backup dashboard, as you can configure it to log event through syslog, and it will create logs for successful and failed Backups/Replication/SureBackup jobs
Whether this works for other vendors depends on if they support syslog logging, and it included job status events, but here is another example of how you can create dashboard using syslog entries whcih you could apply to anything in your environment that logs this way
You’ll want to configure VBR Syslog to the Aria Logs Server
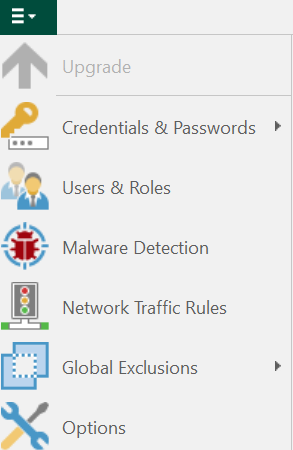
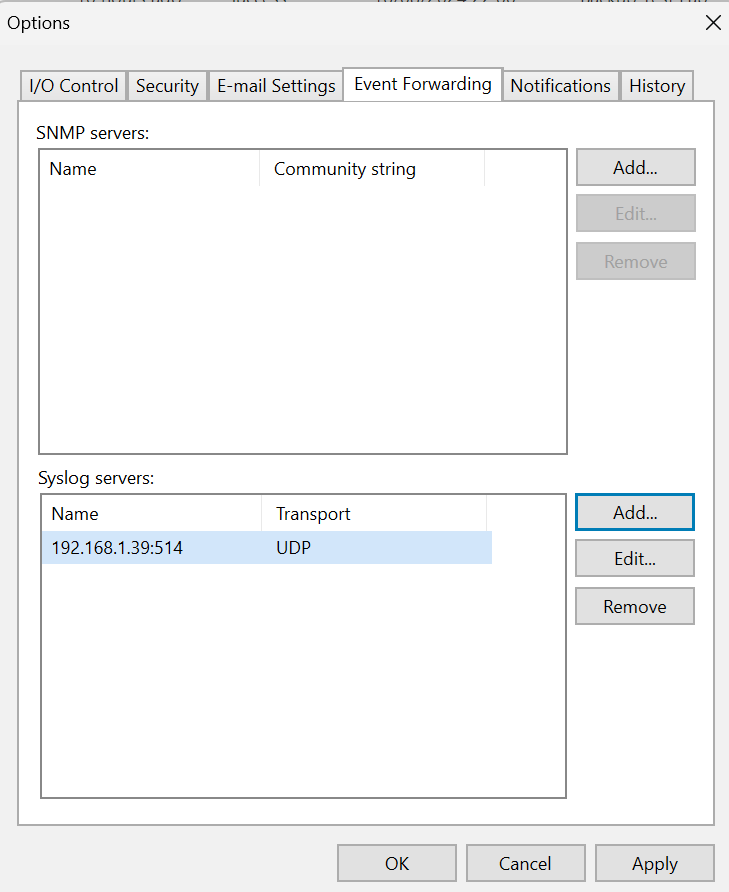
To do this, open VBR, and click options from the context menu in the top left
Go to event forwarding and click add under syslog servers

Add the server
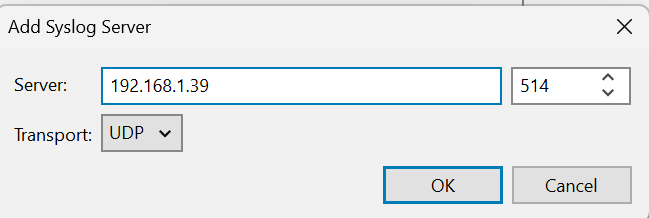
And click ok
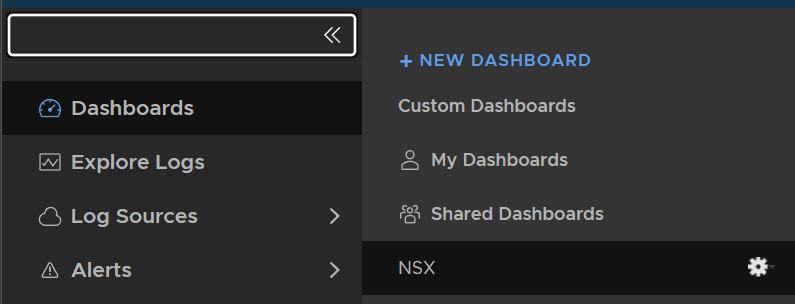
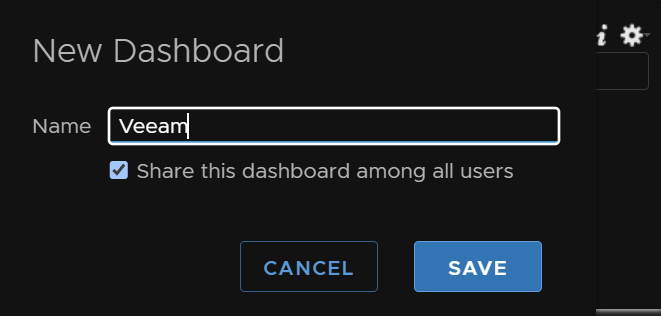
Lets create a new shared dashboard from Dashboards then New Dashboard
Give it a name and click shared
Lets start with one that monitors number of complete jobs
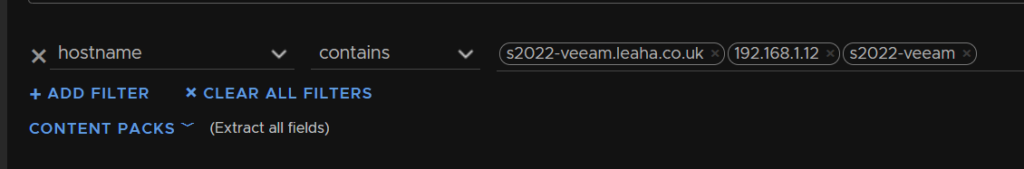
The easiest way to properly filter for all logs for the VBR server is to go to Management/Hosts then click the host, for me this is ‘S2022-Veeam’

This will pre populate the base filter for logs for only this server
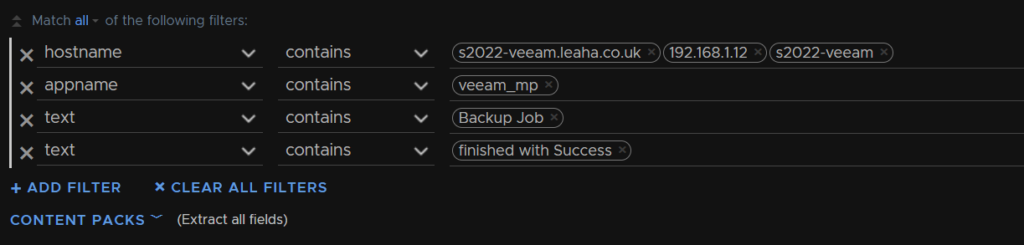
For a number of successful jobs, you can use these additional filters
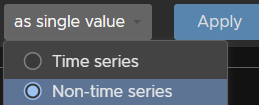
Change this to non time series to give a number
I re ran a backup job as a test, and we can see we have 1 successful hit
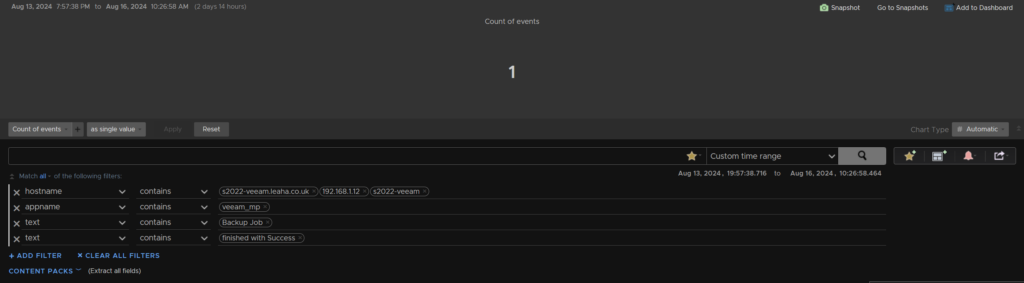
We can then add this to our new dashboard
For warning jobs we can use
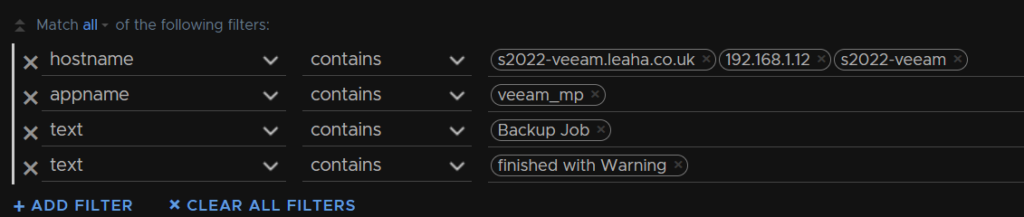
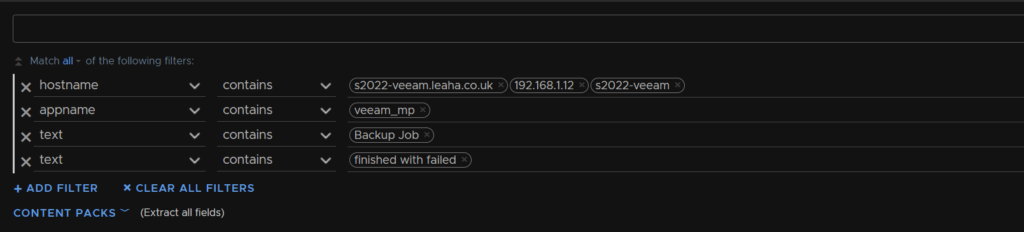
For failed jobs we can use
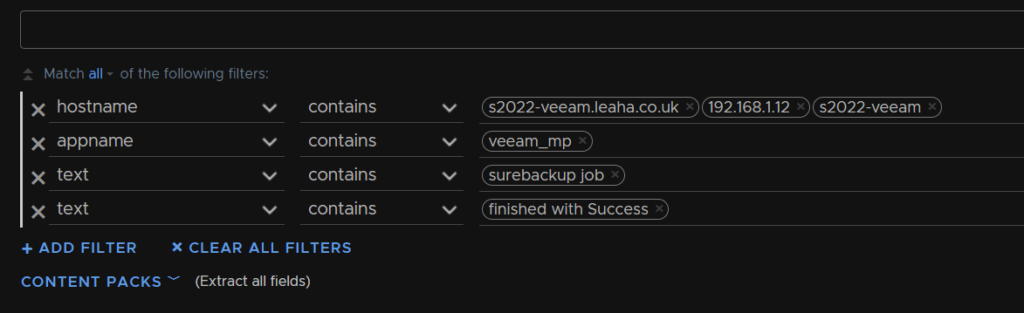
For successful SureBackup jobs we can use
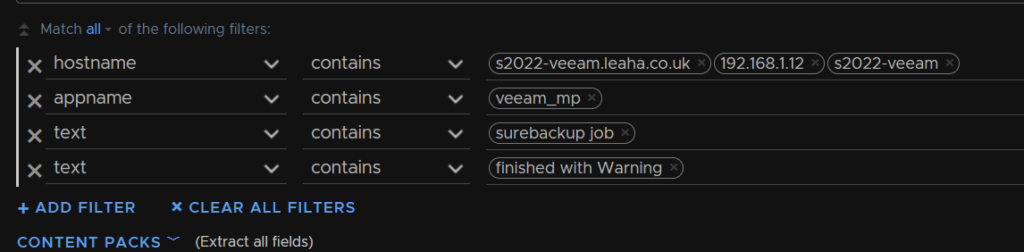
For warning SureBackup jobs we can use
For SureBackup Jobs Failed, we can add this for Failed
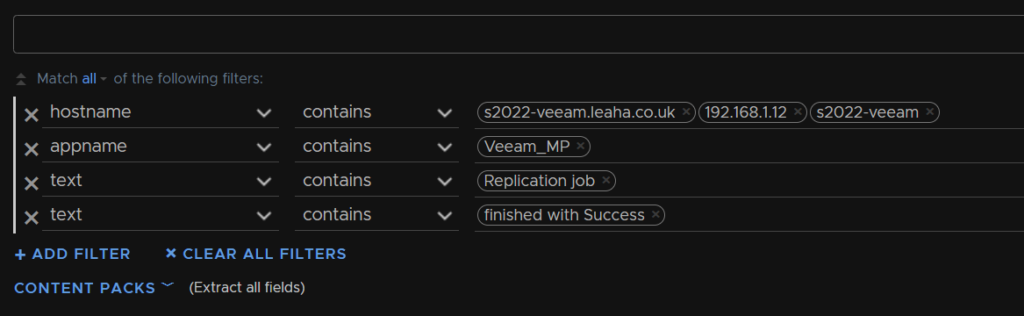
Successful replication jobs can be done like this
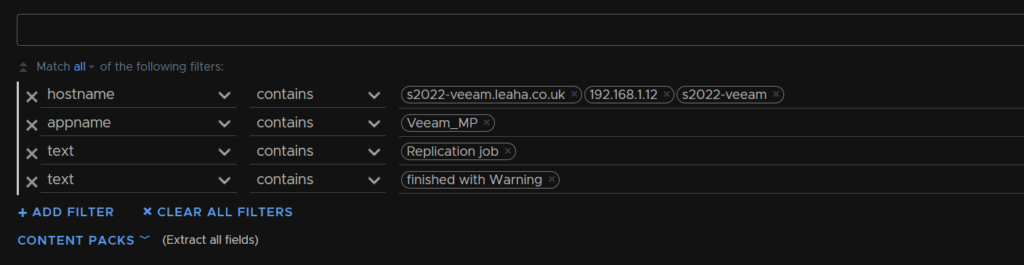
Replication jobs finished with warning can be done like so
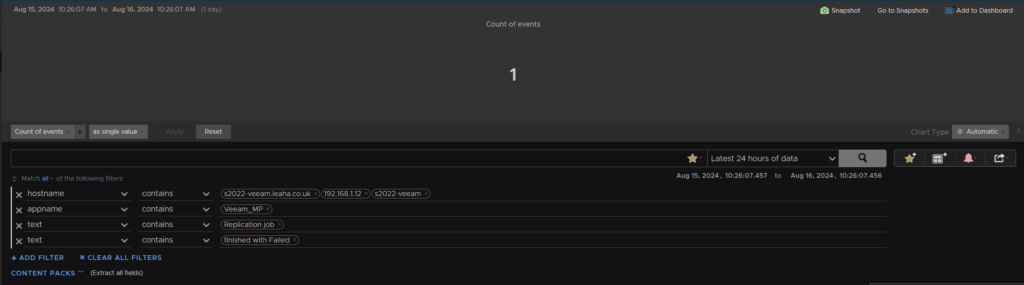
We can do failed replication jobs like this
Then you can arrange the Dashboard to look something like this, here is an example after running some jobs with various states
3.1.6 – Windows/Linux Logs
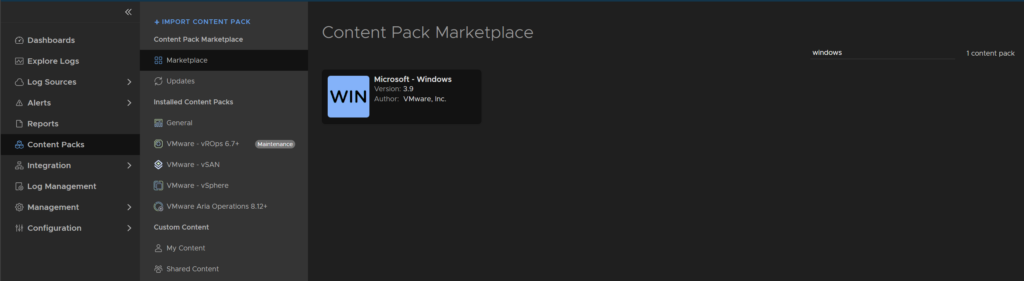
3.1.6.1 – Content Packs
Before we can do anything with agent logs, we need to get the relevant content packs
I will cover content packs for Windows, Linux and AD
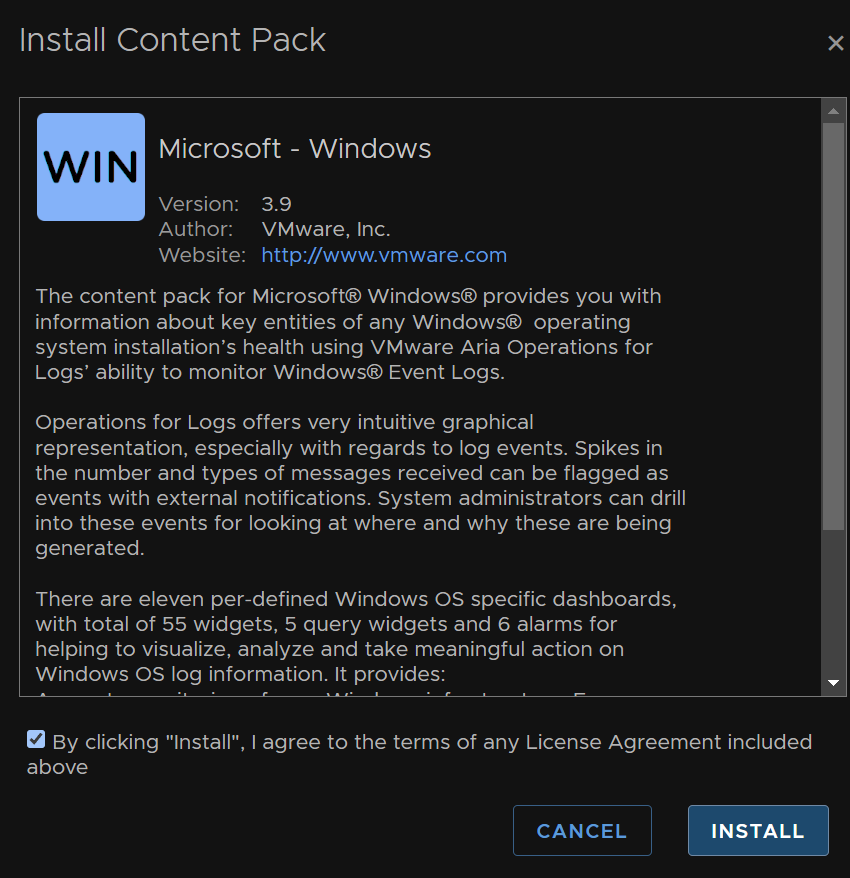
Head to Content Packs and search for Windows, then click the pack
Accept the EULA and click Install
And take note of the instructions, I will have a copy at the bottom
And repeat for Linux, its the right option we want
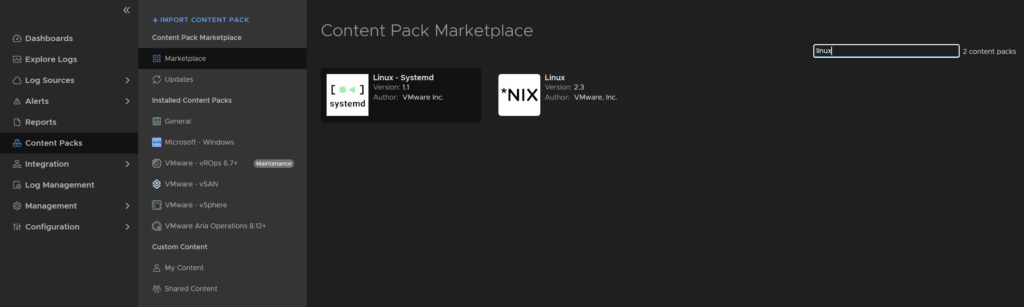
Accept the EULA and click Install
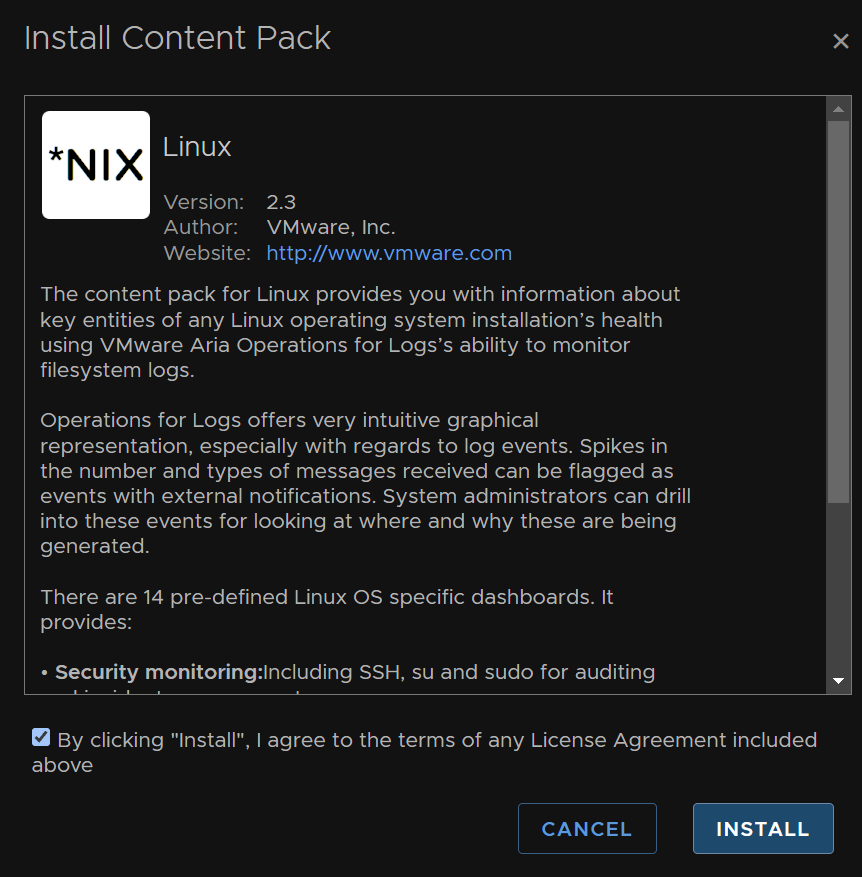
Noting the instructions, I will have a copy at the bottom
AD is another good one to grab, click the icon
Accept the EULA and click Install
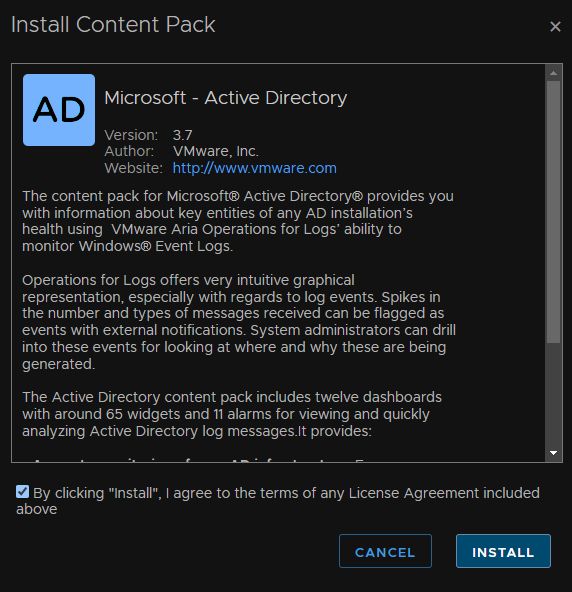
And note the instructions, I will have a copy at the bottom
Other useful packs that I dont really have servers to test on are Dell iDRAC/Networking, Cisco UCS/Nexus, HP Servers, Infoblox, Jenkins, Juniper, MS SQL/IIS, Pure Storage, Palo Alto and Puppet
3.1.6.1.1 – Windows Instructions
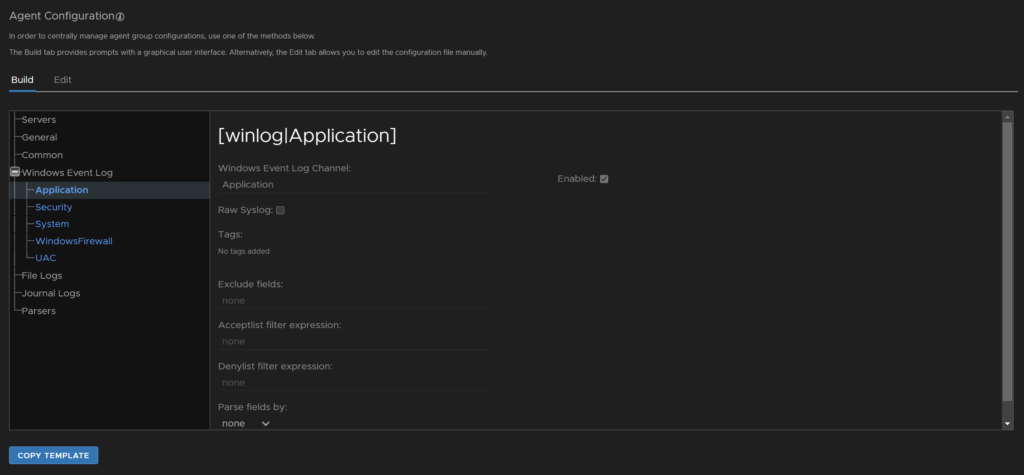
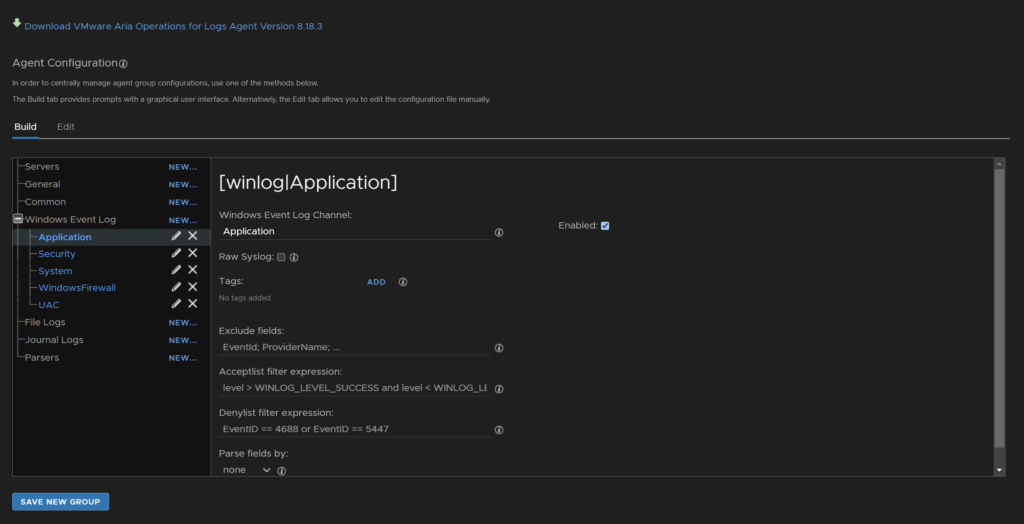
VMware Aria Operations for Logs Agent Configuration:
The Microsoft – Windows content pack requires the use of the Operations for Logs Agent with the cfapi protocol (default) and the included agent group configuration
To apply the agent group configuration
- Go to the Administration > Agents page (requires Super Admin privileges)
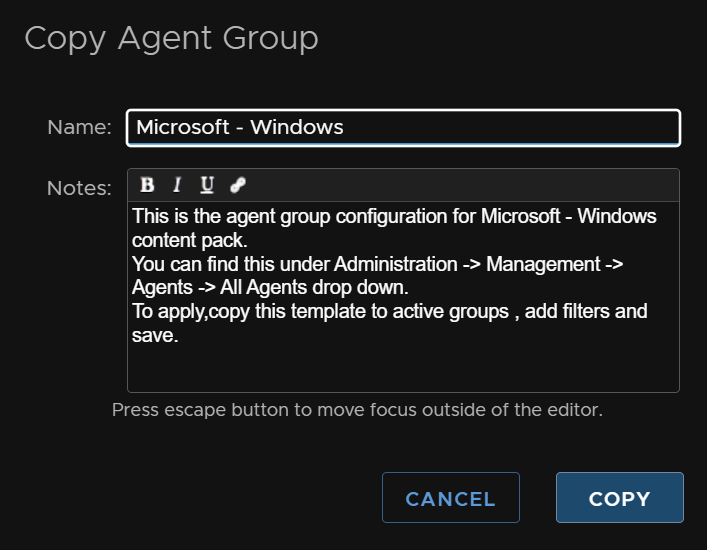
- Select the All Agentsdrop-down at the top of the window and select the Copy Templatebutton to the right of the Microsoft – Windows agent group
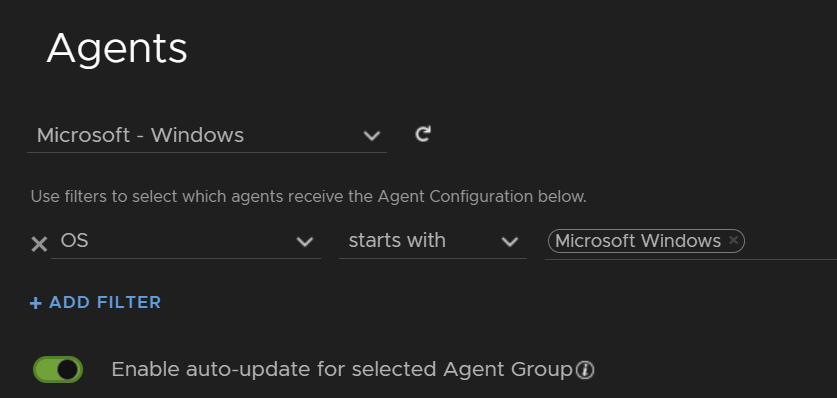
- Add the desired filters to restrict which agent receive the configuration (optional)
- Select the Refresh button at the top of the page
- Select the Save Configuration button at the bottom of the page
Windows Configuration (optional):
For the Security – Object Auditing dashboard to work in the Microsoft – Windows content pack, Object Access Auditing must be enabled on all Windows clients sending events
To enable object auditing you need to alter the local security policy and enable auditing on the desired object. To alter the local security policy
- Open up Administrative Tools > Local Security Policy, or run secpol.msc
- Open Local Policies > Audit Policy
- Right-click on Object Access Audit and select Properties
- Ensure “Success” and “Failure” are checked
- Click on OK, and then close the Local Security Policy window
Note: You can also create Group Policy to enable object access auditing on multiple systems easily
Once object auditing is enabled, you need to enable auditing for a specific folder (and all its sub-folders and files)
- Open up the File Explorer by right-clicking and selecting Run as Administrator
- Browse to the folder you want to turn auditing on
- Right-click on the folder and select Properties
- Select the Security tab
- Click on Advanced, then Auditing
- Click on Add
- Enter the name of the users you wish auditing, click on Find Now to ensure it is registered, and then click on OK
- Check the Successful and Failed boxes, and then click on OK
- Close the windows by clicking OK
Note: You should only do this for a select few objects, since the information generated is very chatty
3.1.6.1.2 – Linux Instructions
The Linux content pack requires the use of *either* a third party syslog agent such as Rsyslog or Syslog-NG *or* the VMware Aria Operations for Logs Agent with the cfapi protocol (default) and the included agent group configuration
To apply the agent group configuration
• Go to the Administration > Agents page (requires Super Admin privileges)
• Select the All Agents drop-down at the top of the window and select the Copy Template button to the right of the Linux and Linux – SLES (warn) / Linux – Ubuntu (kern) agent groups
• Add the desired filters to restrict which agent receive the configuration (optional)
• Select the Refresh button at the top of the page
• Select the Save Configuration button at the bottom of the page
3.1.6.1.3 – AD Instructions
The Microsoft – Active Directory content pack requires the use of the Operations for Logs Agent with the cfapi protocol (default) and the included agent group configuration
To apply the agent group configuration
- Go to the Administration > Agentspage (requires Super Admin privileges)
- Select theAll Agentsdrop-down at the top of the window and select the Copy Templatebutton to the right of the Microsoft – Active Directory 2008 or Microsoft – Active Directory 2012+ agent group
- (depend on your AD version). Add the desired filters to restrict which agent receive the configuration (optional)
- Select the Refresh button at the top of the page
- Select the Save Configuration button at the bottom of the page
Active Directory Configuration:
Enable Audit Policy for AD Change Audit
To enable Audit Policy settings in every Domain Controller, we need to configure audit settings in Default Domain Controllers Policy
Follow the below steps to enable change auditing via Default Domain Controllers Policy
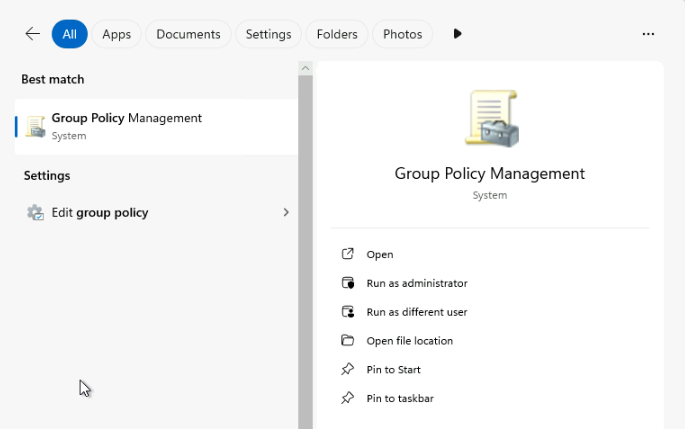
- Go to Start –> Administrative Tools –> Group Policy Management
- Right-click the Default Domain Controllers Policy, and click Edit
- Navigate to the node Audit Policy (Computer Configuration –> Policies –> Windows Settings –> Security Settings –> Local Policies –> Audit Policy)
- Now edit the policies under it by right clicking on the respective policy –> Properties –> Security Policy Setting –> Check Define these Policy Settings –> Success/Failure
- Run the command gpupdate /force from command prompt to update group policy settings
Audit Directory Service Changes
This step is required for all of the Directory Service dashboards to return results
Follow the below steps to configure Directory Service auditing
- Go to the node DS Access (Computer Configuration –> Policies –> Windows Settings –> Security Settings –> Advanced Audit Policy Configuration –> DS Access)
- Now edit Audit directory service changes
Note: Advanced Audit Policy comes under the subcategory of DS Access which will log extra fields like old and new values
Other categories under Advanced Audit Policy Configuration can be configured likewise as per the requirement
Enable Object Level Security Audit
This step is required for the Security dashboards to return results
You can enable auditing on single object, or OU level, or Domain level
Follow the below steps to enable Domain level auditing
- Start –> Administrative Tools –> Active Directory Users and Computers
- Right-click the Domain object, and click the Properties
- Click the Security tab
- Click the button Advanced, and select the tab Auditing
- Click the button Add, find the user Everyone, and click OK
- Check the Successful and failed auditing you can configure these settings as per your requirement
- Click the button OK, and click Apply
DNS Server Configuration
This step is required for all of the DNS dashboards to return results
Follow the below steps to configure DNS logging
- Log into the Windows Server running DNS
- Open DNS Manager
- Windows Server 2008+: Start –> Administrative Tools –> DNS
- Windows Server 2012+: Server Manager –> Tools –> DNS
- Right-click the DNS server you wish to configure and click Properties
- Click the Debug Logging tab
- Click Log packets for debugging
- Under Packet Direction, uncheck Outgoing
- Under Packet contents, uncheck Updates and Notifications
- Click OK to save the configuration
Note: You can enable as many options as you desire for logging
However, the more options enabled, the more resources consumed by the DNS server and data sent to Operations for Logs
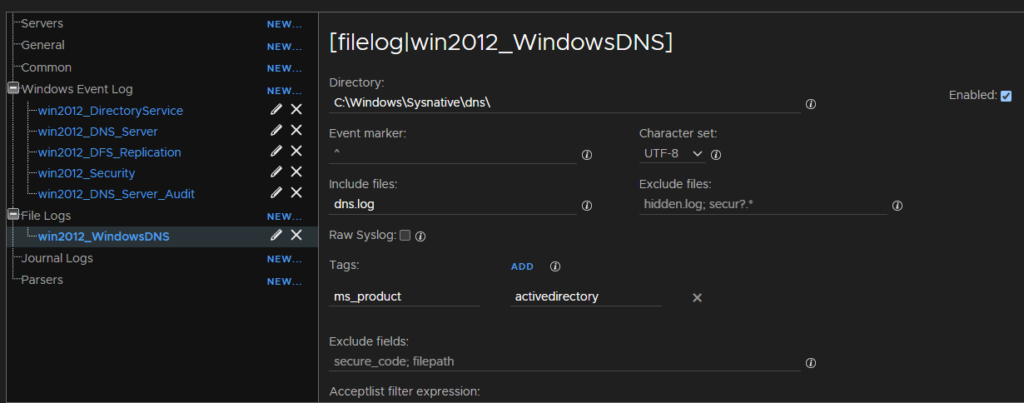
You can also change the file path for the “dns.log” file but ensure the correct file path is set in the “[filelog|WindowsDNS]–> directory” section of the log insight agent configuration
Be sure to open %Windir%\System32\DNS\dns.log and verify log entries are being generated
Track Logon Events
To track logon events you must enable both the “Success” and “Failure” Security Settings of the following policies in Group Policy
- Audit account logon events
- Audit account management
- Audit directory service access
- Audit logon events
- Audit object access
- Audit policy change
- Audit privilege use
- Audit process tracking
- Audit system events
3.2.6.2 – Linux – Ubuntu
3.1.6.2.1 – Configuring The Agent
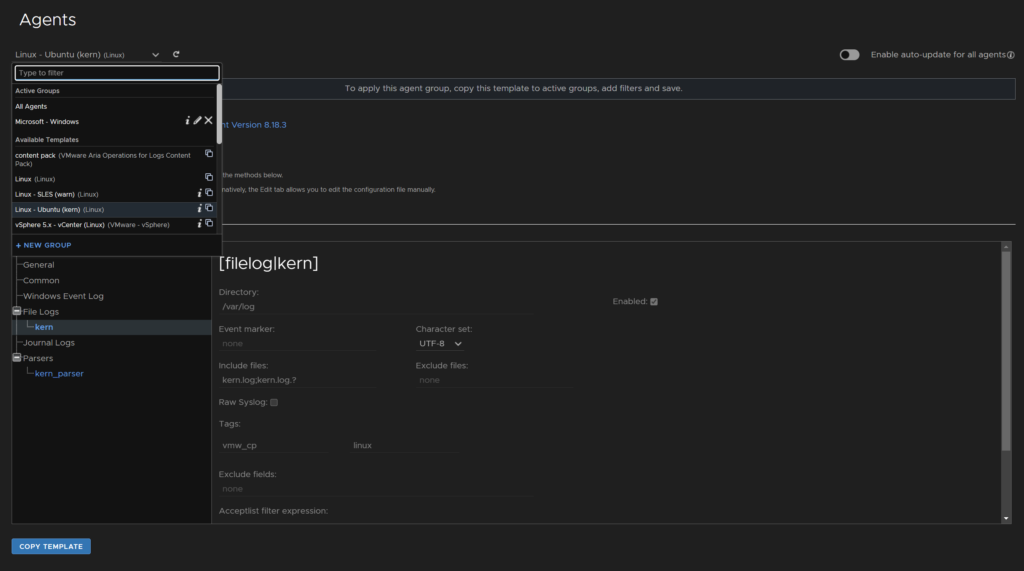
Click Management/Agents

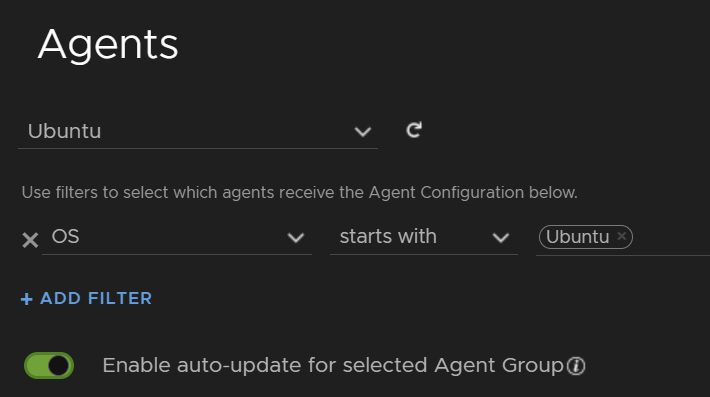
Click the drop down, select Linux – Ubuntu and click Copy Template at the bottom
Give it a name, then click Copy

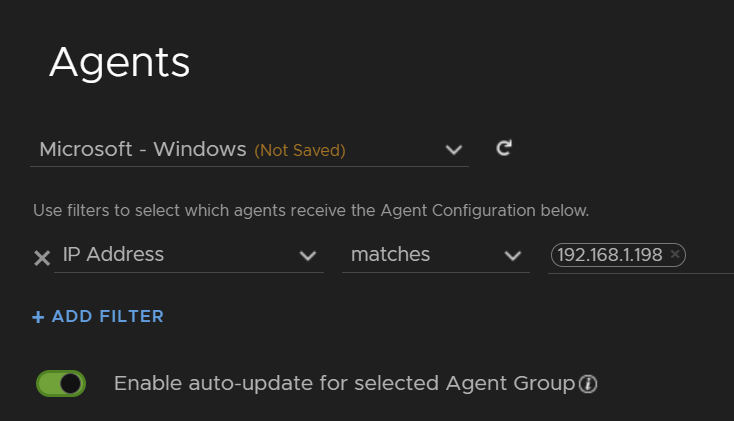
At the top, add a filter for servers OS starting with Ubuntu and enable auto update
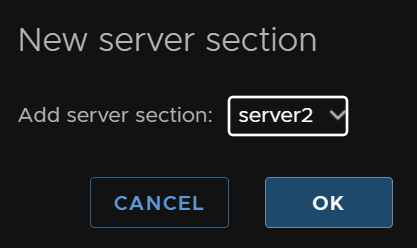
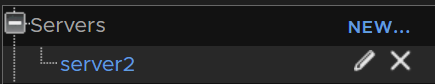
Click Servers then New at the bottom
Select Server 2

Then ok
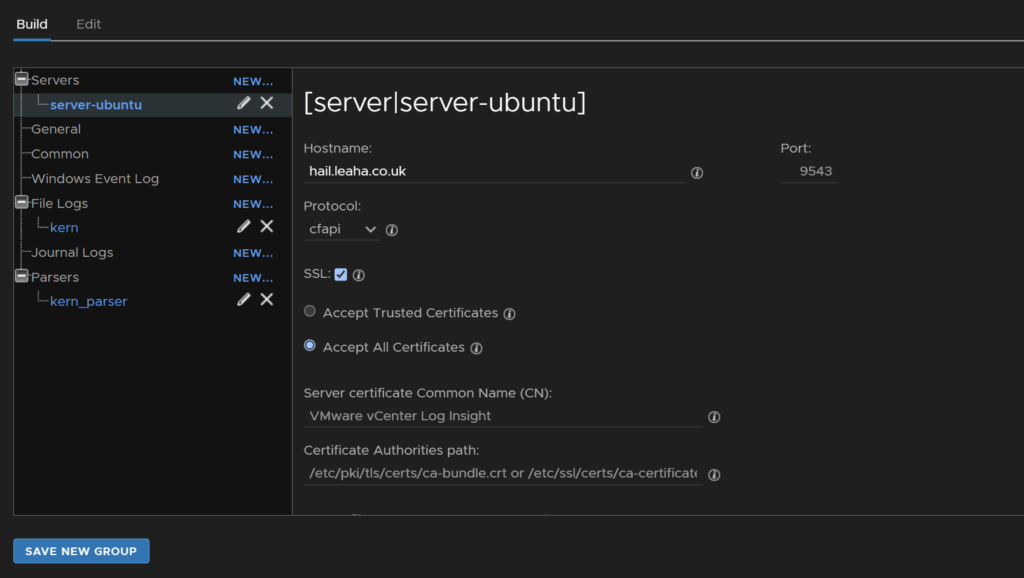
Add the fqdn, enable SSL and select Accept All Certificates

Then click the Pencil
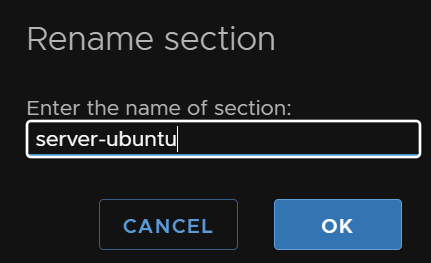
Give it a unique name, this can conflict with other log templates, eg Windows, and click ok
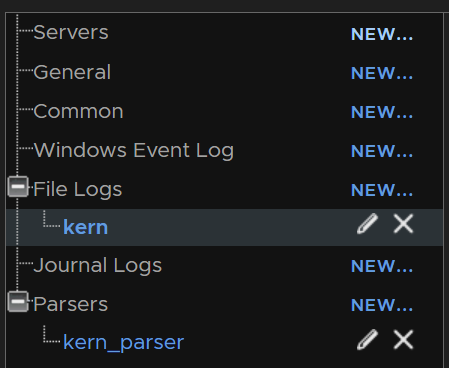
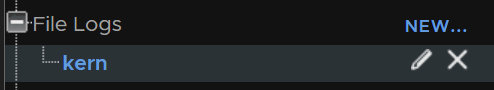
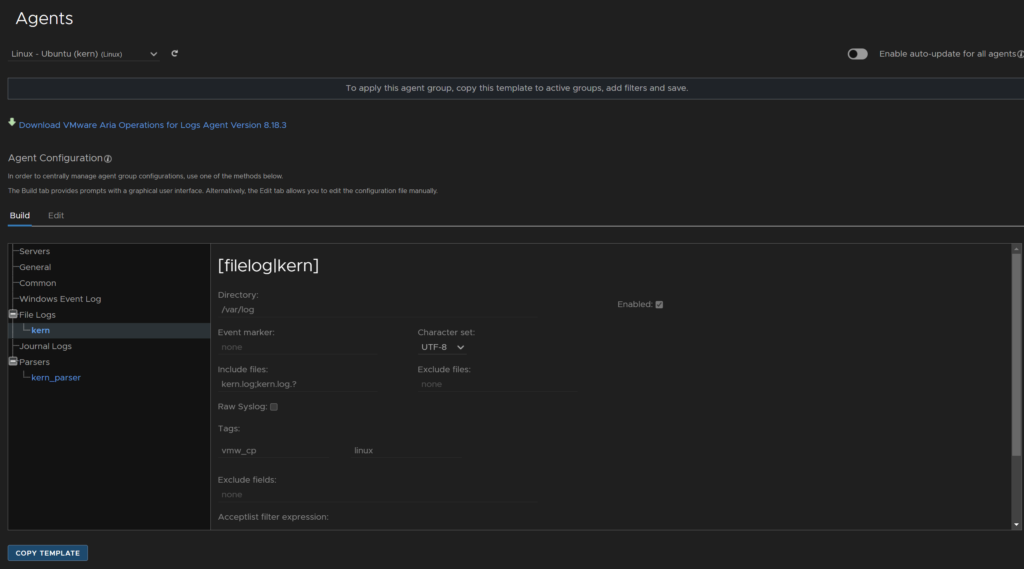
By default, it only picks up on the kernel log file, kern.log
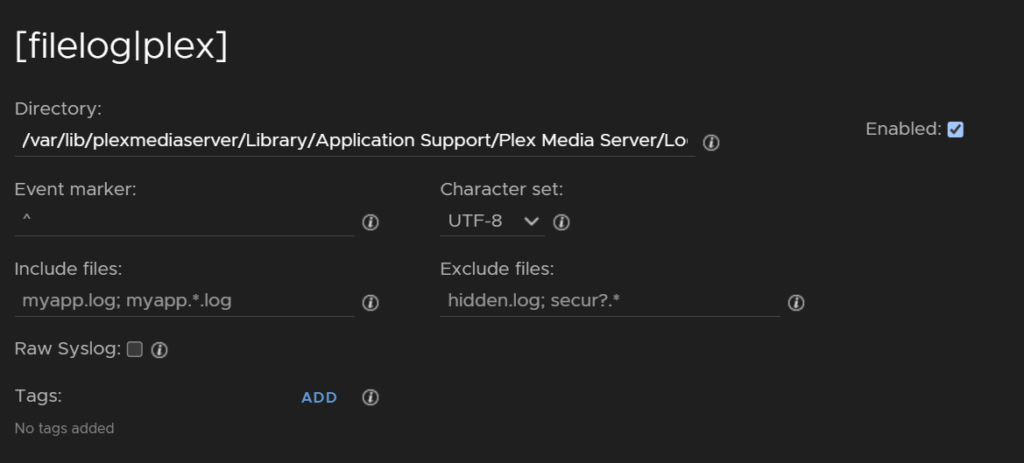
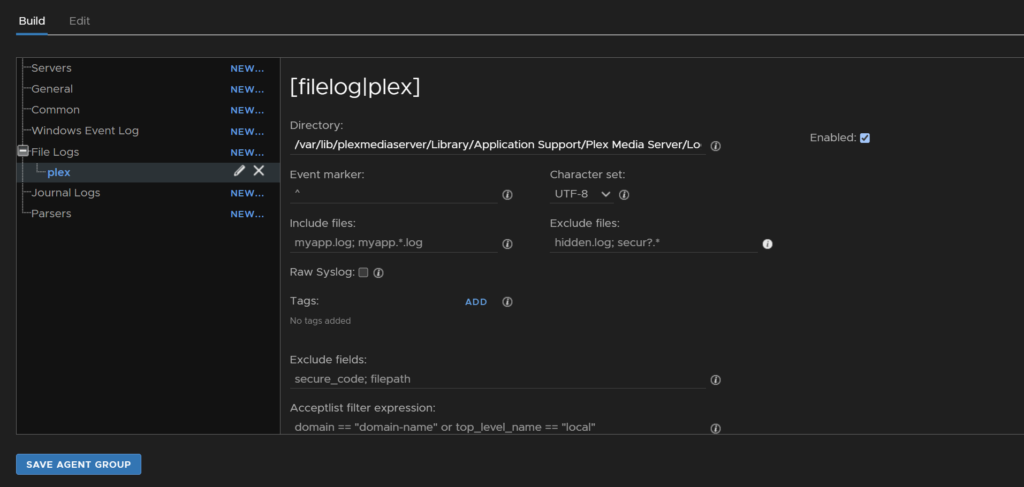
We can click New under File Logs, to add more
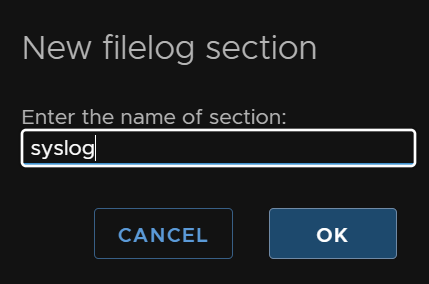
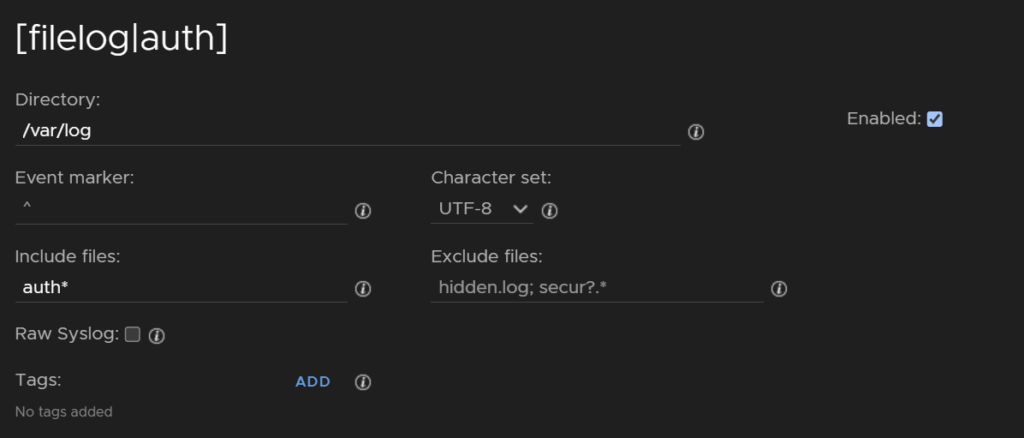
Lets add one for syslog
Add the directory
/var/log
Make sure Enabled it checked
For Include Files, add syslog*
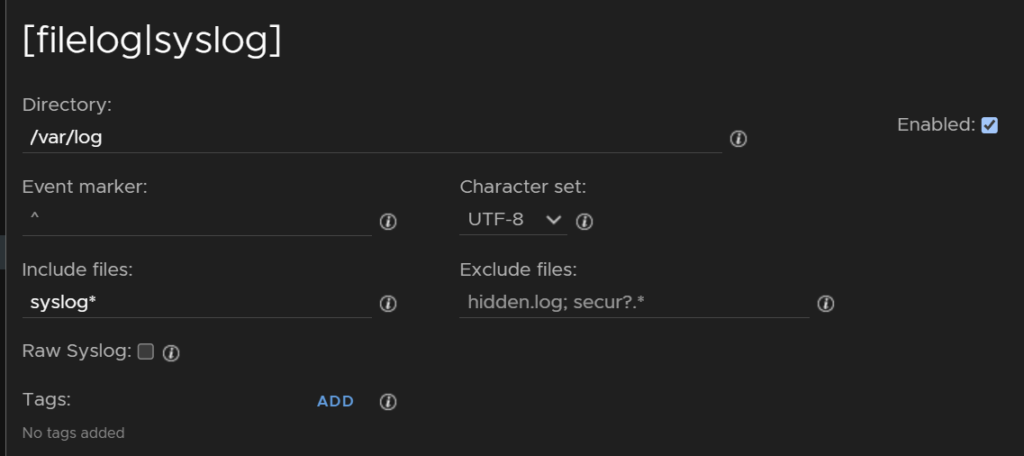
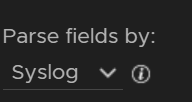
And at the bottom, set parse field by syslog
I added another for auth
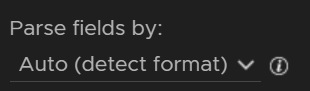
With the parser on auto
Another for dpkg
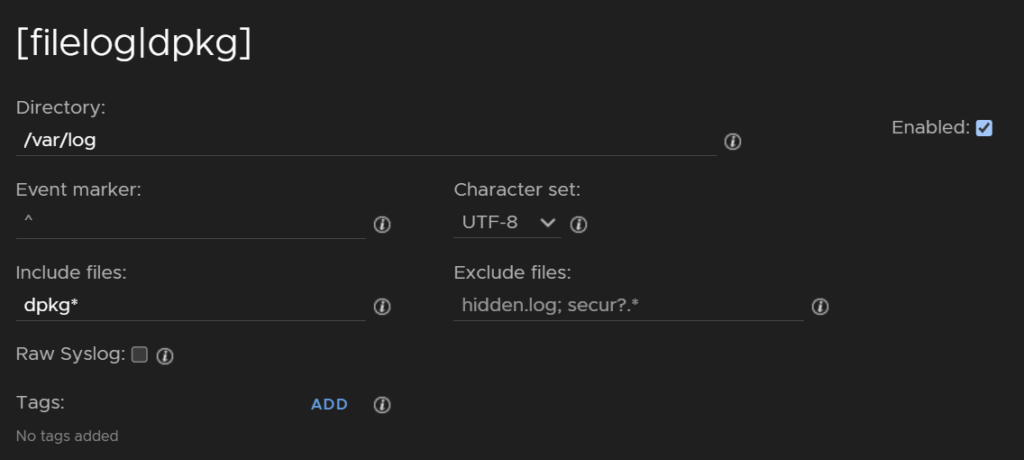
Which looked like this at the end
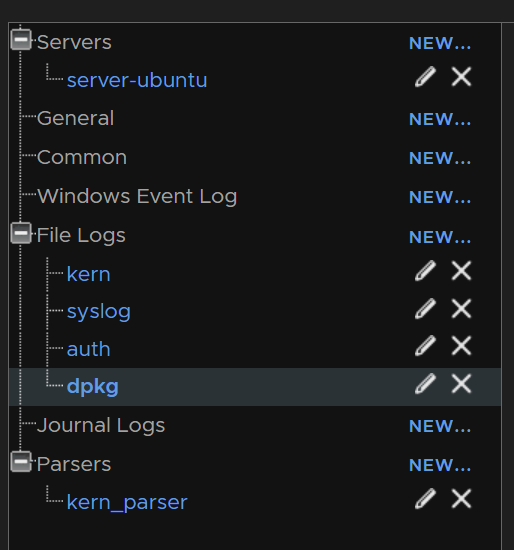
Then click Save New Group
3.1.6.2.2 – Ubuntu Install
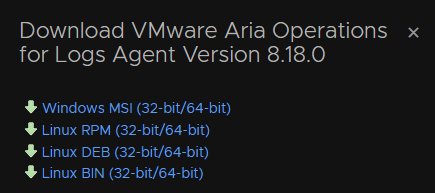
Head to Management/Agents and download the Aria agent for Linux DEB

We can then put it on the server with WinSCP, I am putting it in the ~ directory
To install it run
sudo dpkg -i ~/vmware-log-insight-agent_8.18.3-24507632_all_192.168.1.39.debNow its installed, and the server is managing the config, they dont immediately talk to each other, since its all using SSL, we want SSL so everything is encrypted, but for me, I am not so bothered about a trusted certificate, so as its not on the server by default, we need to edit the config file, this will then pull what the server has and override the local config anyway
Edit the config file with
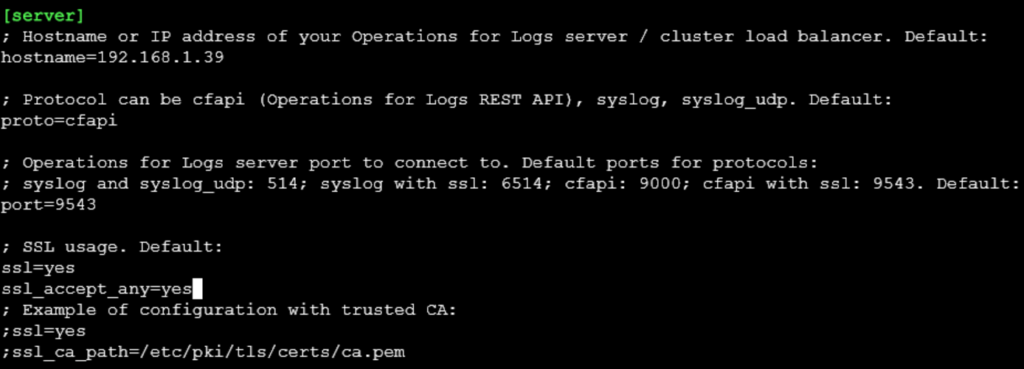
sudo nano /var/lib/loginsight-agent/liagent.iniThe config file user semi colons for comments, so make sure, hostname, proto, port and ssl are uncommented with no ;
The hostname should be the FQDN/IP of the aria log server
Proto should be cfapi and port 9543
SSL needs to be yes, and add the line
ssl_accept_any=yes
Then press Ctrl + X, then Y then Enter to save and exit nano
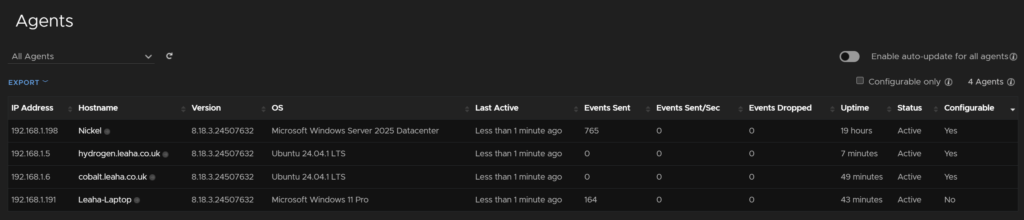
Refreshing the agent, we can see its been detected
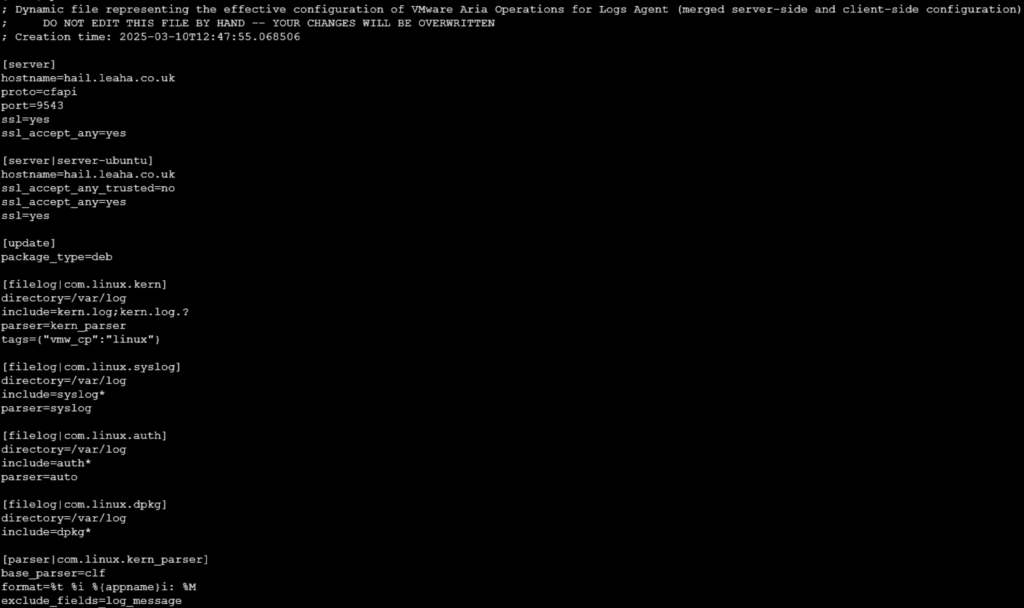
And if you check the active server side merged config file with
sudo cat /var/lib/loginsight-agent/liagent-effective.iniWe can see our config has been pulled over
3.2.6.2.3 – Custom Server Logs
Another good use for the log groups is app logs, we already setup the Ubuntu base, so what about an app on some servers
Lets take Plex for example, I have a single server, and I dont want to define this on the base Ubuntu server targeting all Ubuntu servers
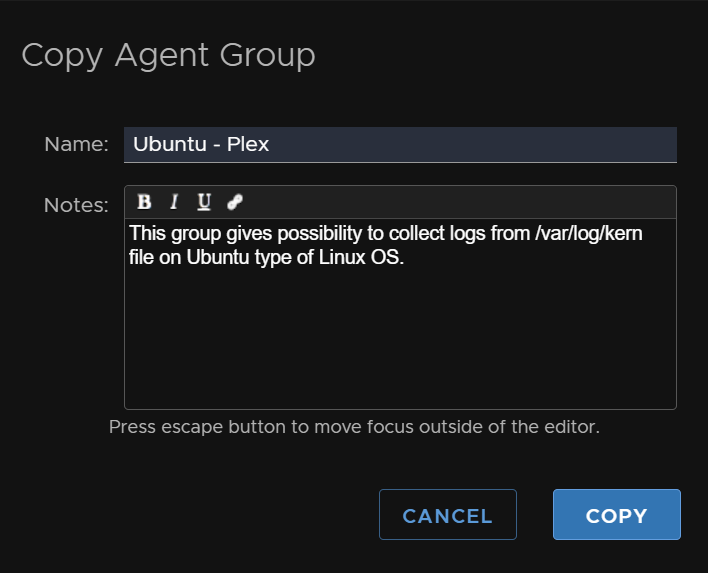
Lets create another group, same as before, click the Ubuntu template, then Copy Template
Lets give it a name, eg Ubuntu – Plex, then click copy
In this case, lets use an IP filter, we can also do hostname contains if your naming scheme has the app name, but I went for IP, and added my Plex server
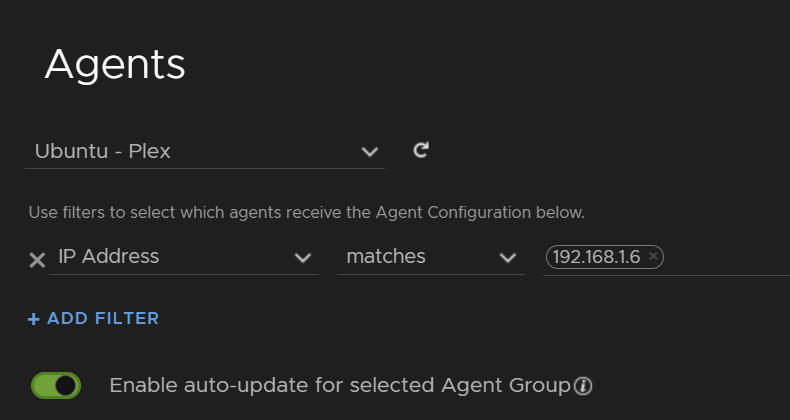
All I added was the Plex log directory
/var/lib/plexmediaserver/Library/Application Support/Plex Media Server/Logs
Make sure Enabled it also ticked
And have the parser on auto

This will grab everything in that directory
Then click Update Agent Group at the bottom
If we then check the server merged config on the client with
cat /var/lib/loginsight-agent/liagent-effective.ini
We can see its been added, on top of the Ubuntu base
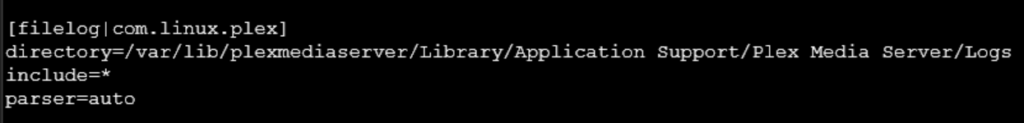
And if we check any other Ubuntu machine, it doesnt have this
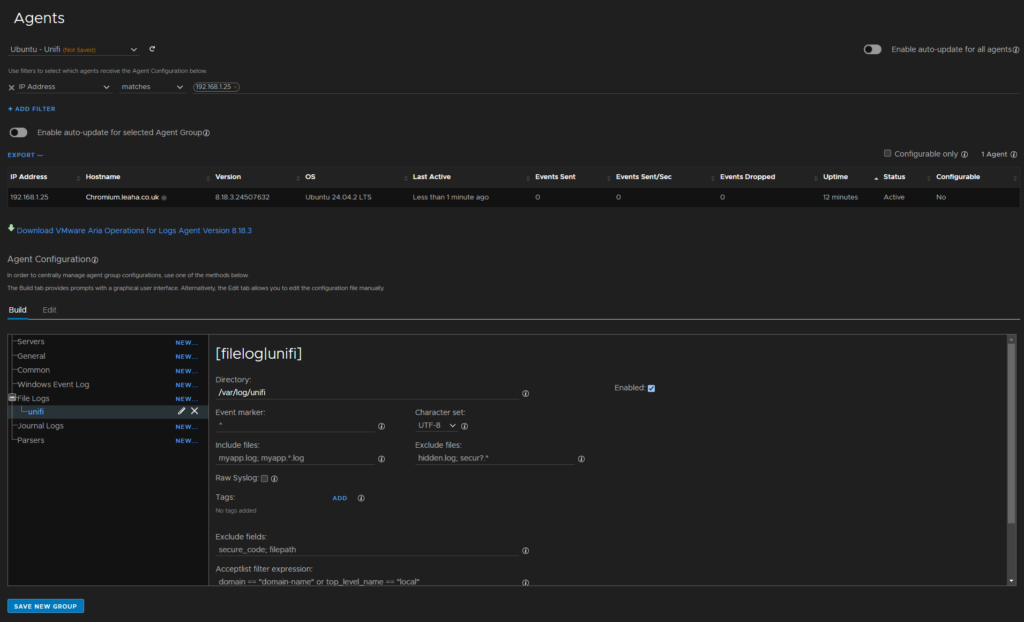
I repeated again for Unifi logs located at
/var/log/unifi
For just my Unifi Controller server, with the parser on Auto
3.2.6.3 – Windows
3.2.6.3.1 – Configuring The Agent
Click Management/Agents
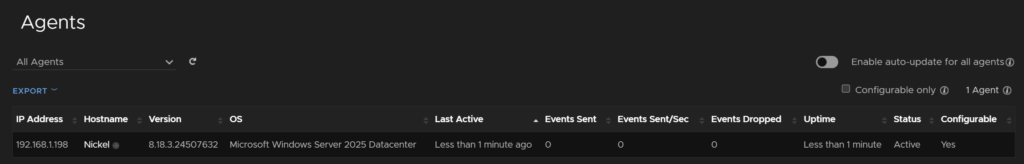
Select the All Agents filter, and click Windows
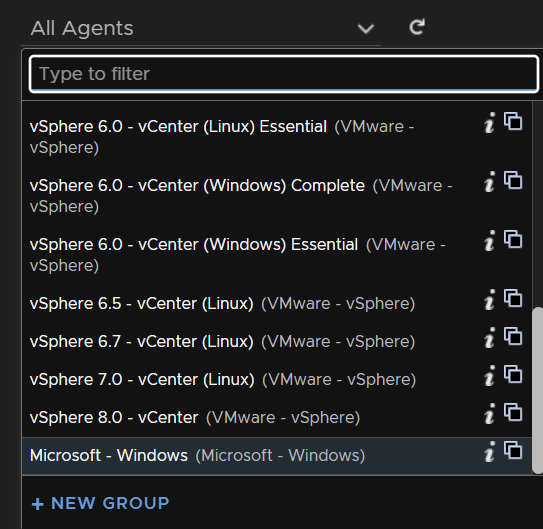
This will generate a config, click Copy Template
And click Copy
Then add the windows servers by using the OS starts with Microsoft Windows and enable auto update
And at the bottom, click Save New Group
Now, there are a few bits we want to add, on the same Windows group, ensure auto update is enabled
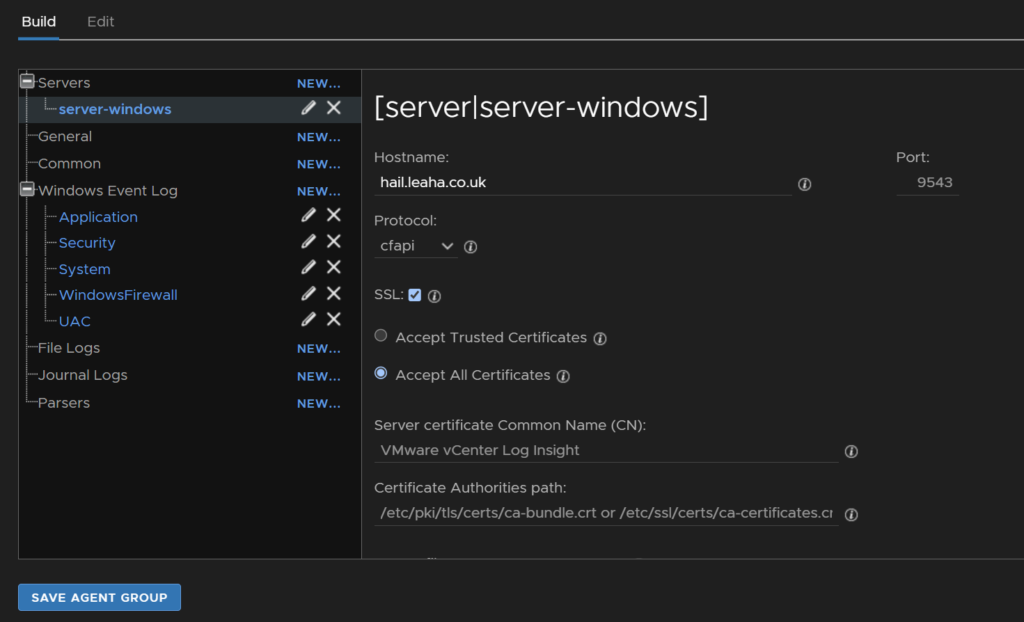
In the build tag, under Servers, click New
Select Server 2
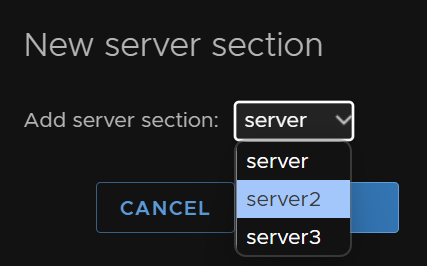
Then ok

And add the hostname for the Aria Logs server, enable SSL, set the port to 9543 and protocol to cfapi, accept the all certificates and click the pencil on server2
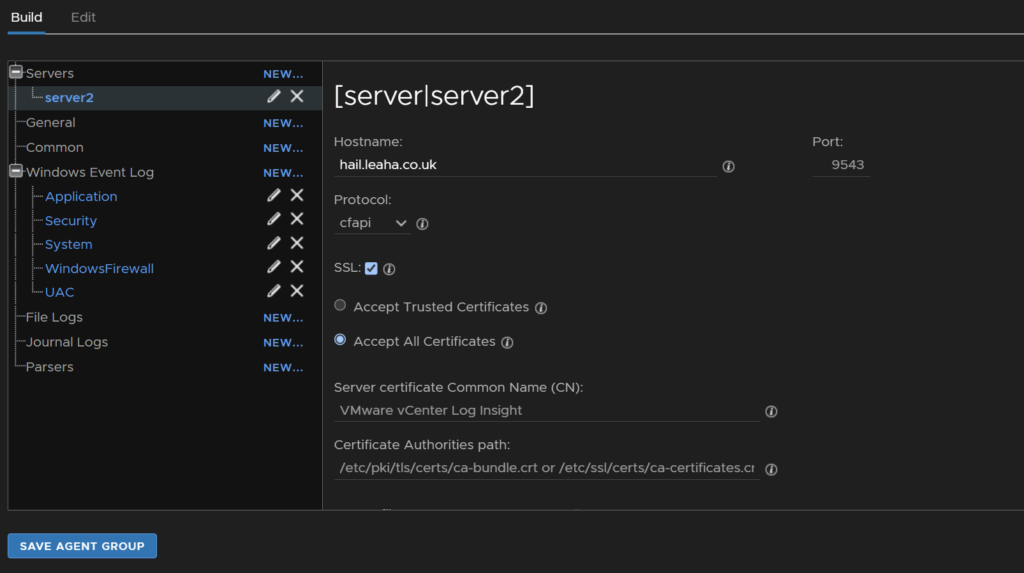
Then rename it and click ok

Then click Save Agent Group
3.2.6.3.2 – Windows Install
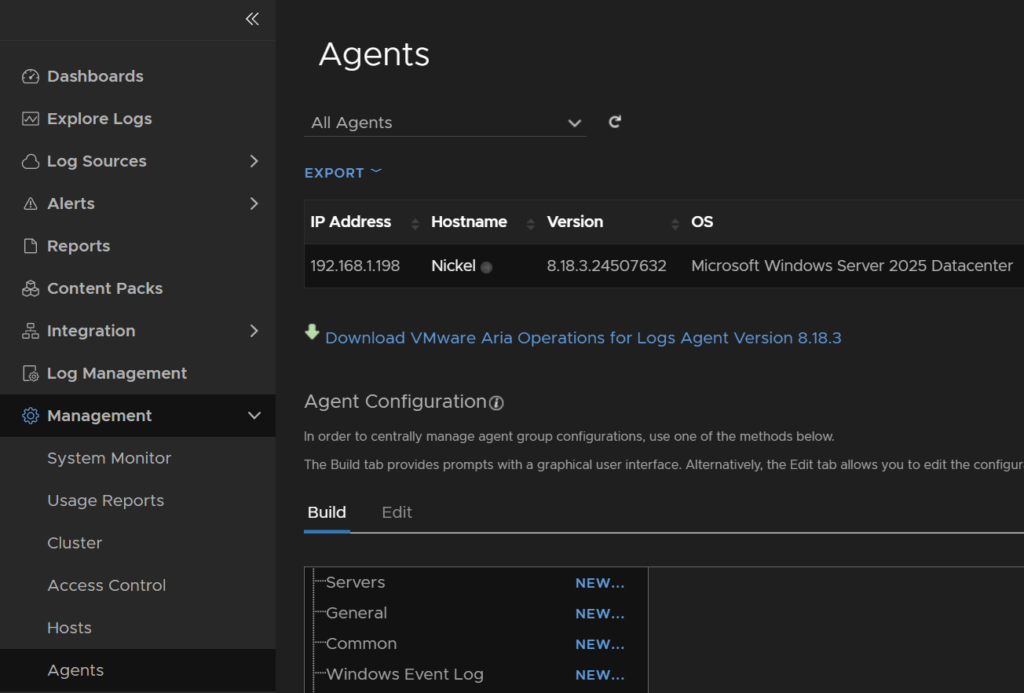
Head to Management/Agents and download the Aria agent for Windows

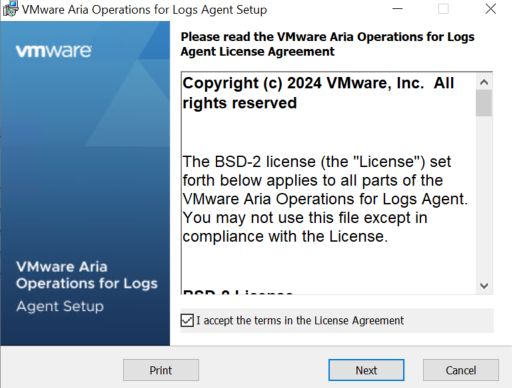
Put the file on your Windows server and run the executable by double clicking it

Accept the EULA
Set the host, this should be auto populated
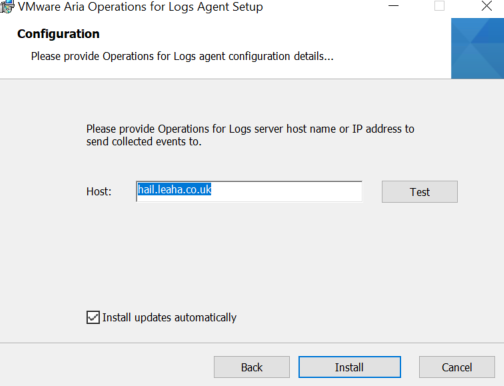
Then click finish
Now we need to edit the config file, so it pulls the server side conf, open
C:\ProgramData\VMware\Log Insight Agent\liagent.ini
I did have to open notepad as an administrator, then click File/Open and open the ini file that way on some servers else it wouldnt save changes and dont forget to change this to All Files, else notepad wont see the ini file
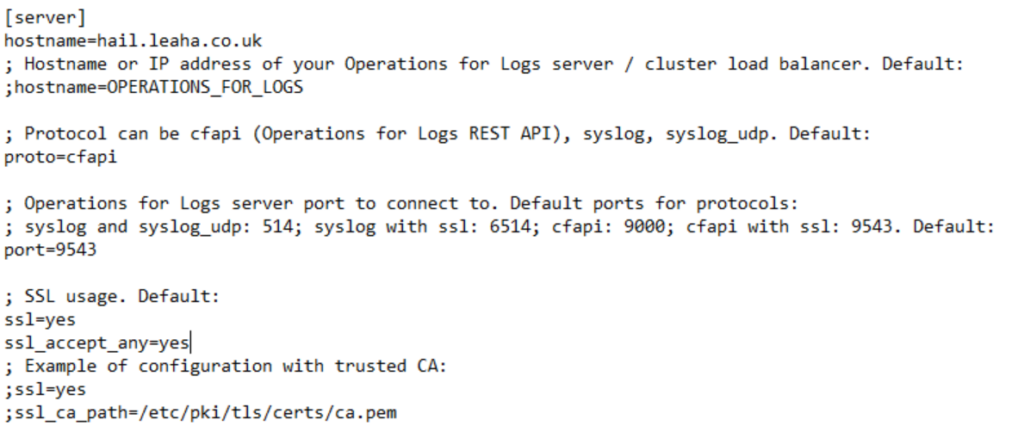
The config file user semi colons for comments, so make sure, hostname, proto, port and ssl are uncommented with no ;
The hostname should be the FQDN/IP of the aria log server
Proto should be cfapi and port 9543
SSL needs to be yes, and add the line
ssl_accept_any=yes
Then press Ctrl + S and close the file
Back in Aria Logs, we can see our host has pulled through
Its worth noting, this also works on Windows 11, so you can use this for client machines, not just servers

3.2.6.3.3 – AD Logs
The first thing you will want to do is enable advanced logging for your DCs, this can be done via GPO
Open Group Policy Editor as an administrator on a DC, or remotely via RSAT
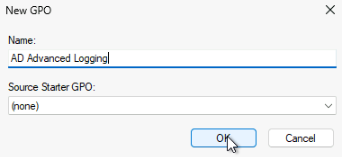
Expand your forest and domain, right click Group Policy Objects then click New

Give it a name, like AD Advanced Logging and click ok
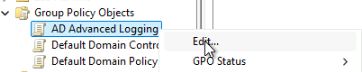
Right click the new policy and click Edit
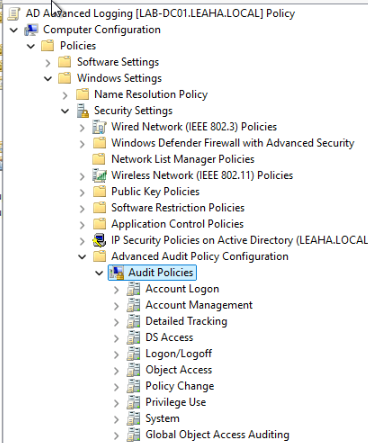
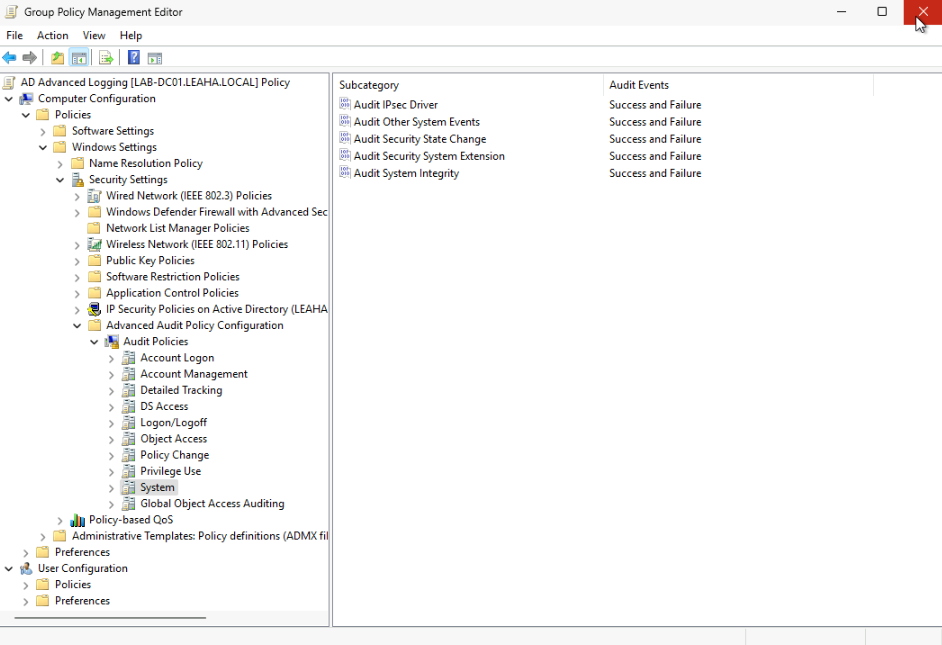
What we are looking for is under Computer Configuration/Policies/Windows Settings/Security Settings/Advanced Audit Policy Configuration/Audit Policies and there are a lot under here
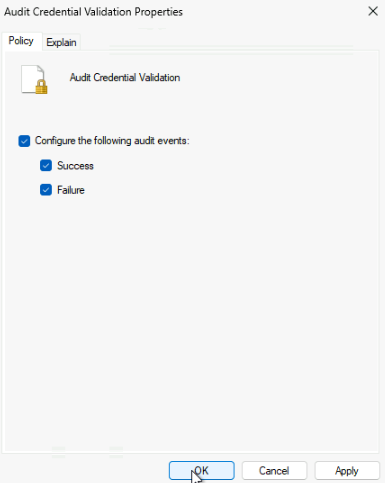
You can choose though what to enable, but they will give you a lot more logs, we can then double click a policy to configure it, for example, Audit Credential Validation
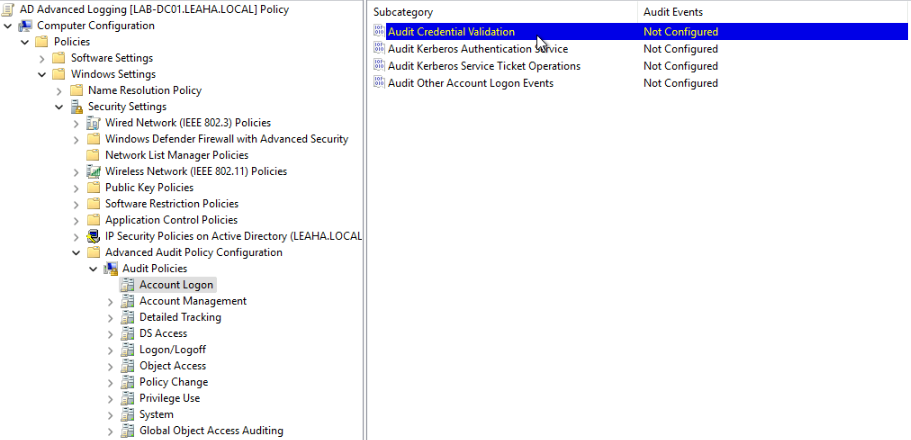
And we can configure the events
I went through all the policies and enabled everything, except for the Global Object Access Auditing, I have a tiny lab and I dont really use the domain, so its not too bad, but this could get very noisy in a large production environment, so if you dont care about a certain type of log you may want to leave it disabled, but this can easily be tweaked as you go
Once you have enabled what you need, click the X in the top right to close the window
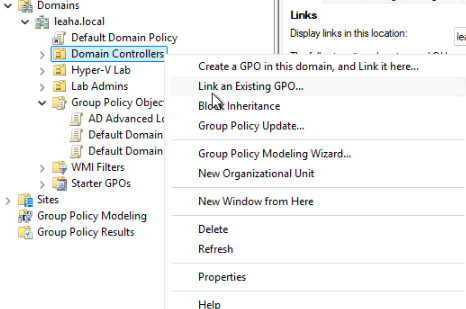
Now to ling the GPO, right click the OU with your DCs in, and click Link An Existing GPO
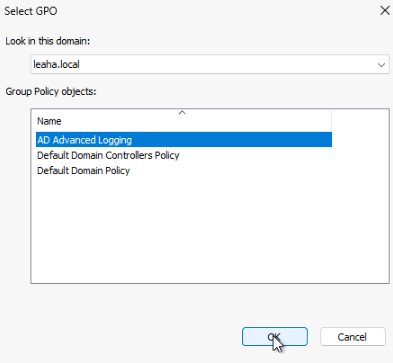
Select the Advanced Logging GPO and click ok
Lets head back to Aria Logs, agent groups are additive, so we have our Windows base policy for all Windows Servers, we can add another for DCs, and add our DCs, and they will have the log collection of a DC group plus the base Windows logs
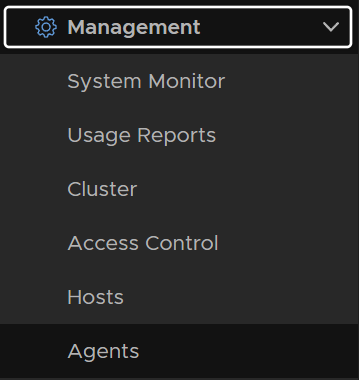
Head to Management/Agents
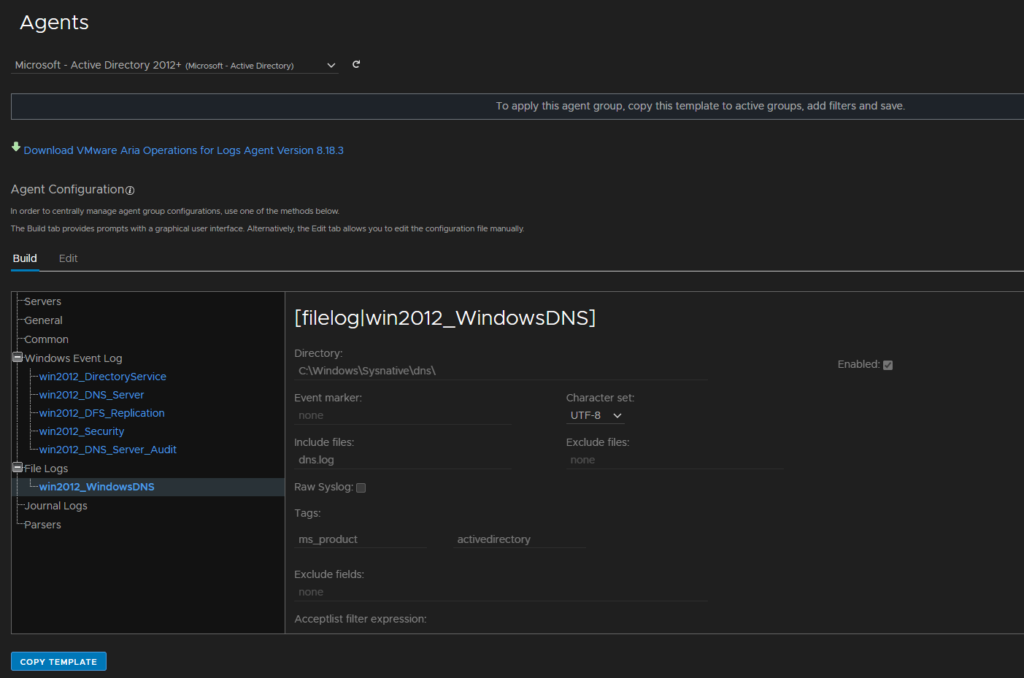
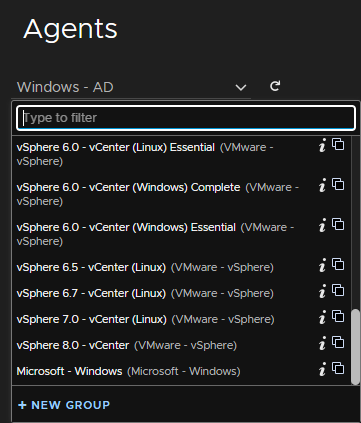
Click the All Agents drop down and click Microsoft – Active Directory 2012+

Click Copy Template
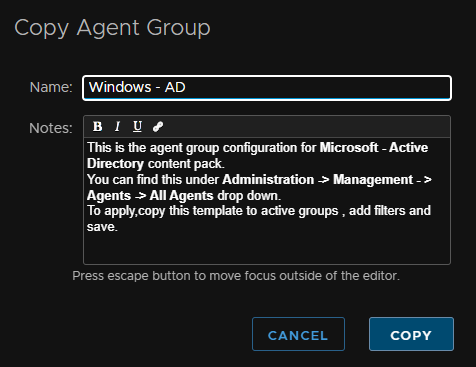
Give it a name and click Copy
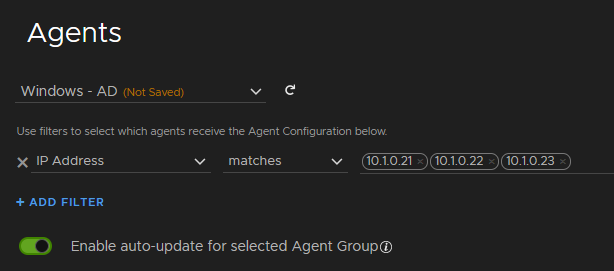
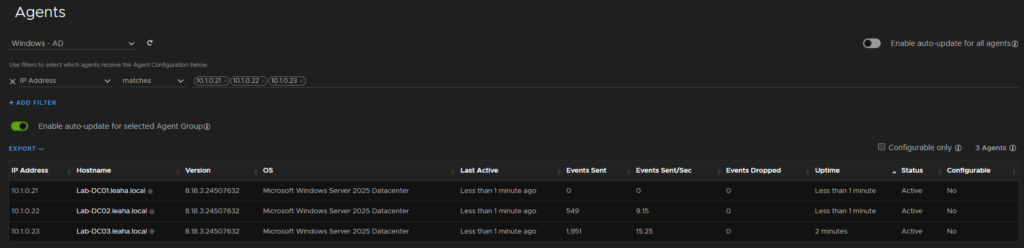
Add an IP filter for your DCs and enable the auto update toggle
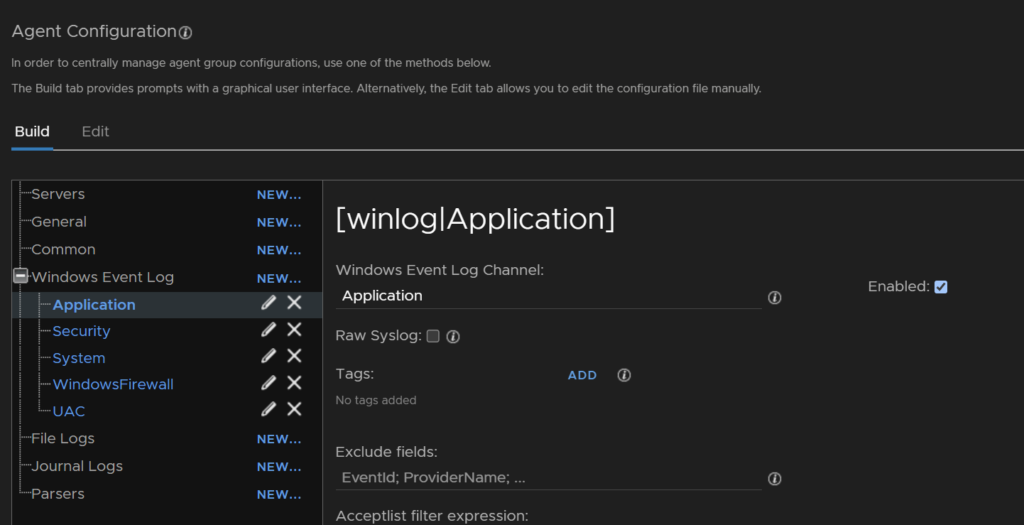
And we can see the event viewer logs it grabs, click Save new group
We then need to install the agent, this is the same as before
Once thats done, they show up in the group
3.2.6.3.4 – Veeam Logs
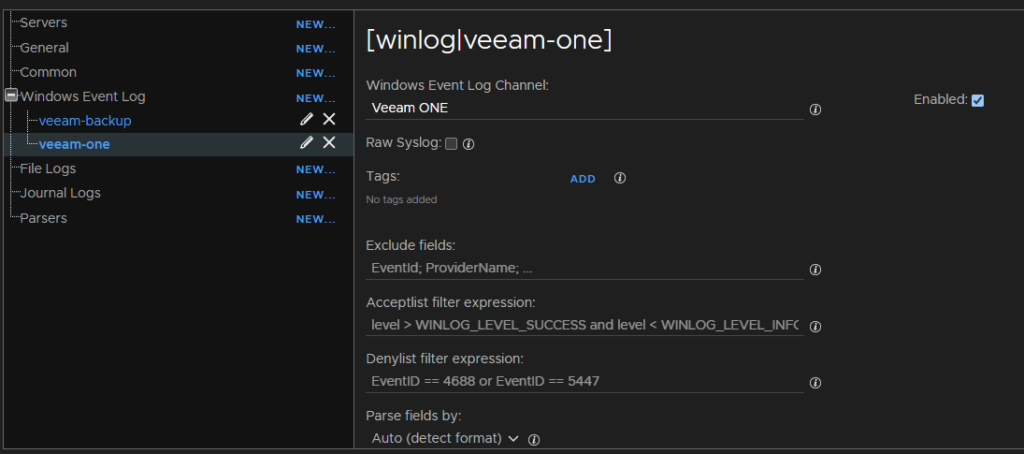
While there is a content pack for Veeam, it doesnt provide a template sadly, but we have two options, we can either add a syslog server using UDP 514 in the Veeam Console, which is what we used for the dashboard earlier, or we can grab the events from Event Viewer, which also allows us to get Veeam ONE
Veeam ONE is also in event viewer, though not Enterprise Manager, so using this seems pretty good, we dont need to do anything on the repositories or proxies
Lets go to Management/Agents, click the drop down, then + New Group
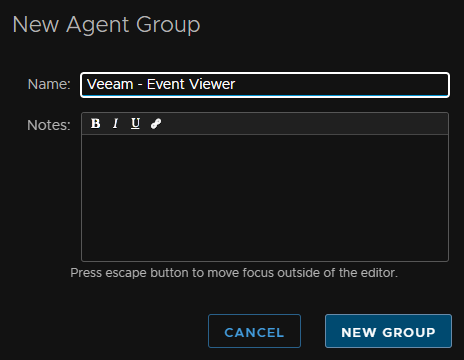
Give it a name then click New Group
Add your VBR server, I also added my Recovery Orchestrator server and enable the toggle for auto update
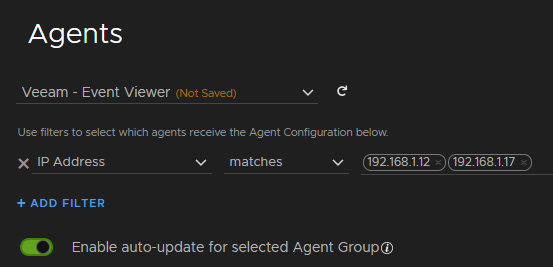
At the bottom click New under Windows Event Log
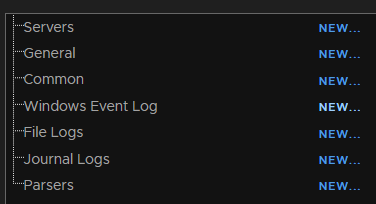
Give it a name and click ok
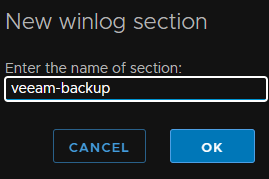
In event viewer the path is Applications And Services Logs/Veeam Backup
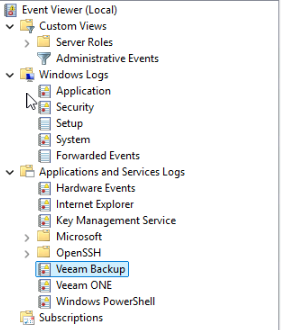
Now we dont need the applications and services folder, so we should just need Veeam Backup and set the parser to auto

We’ll add another for Veeam ONE
Then click Save Group at the bottom
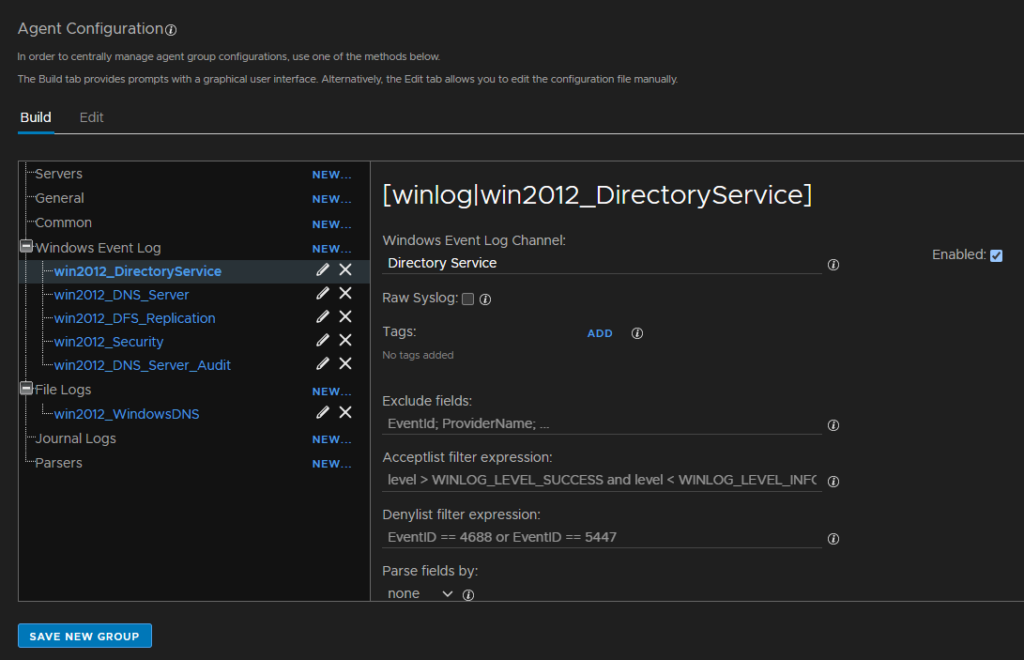
3.2.6.3.5 – Custom Windows Logs
I didnt have any servers with custom application logs except for Veeam above, but, for getting the correct log channel we can right click the log file, the AD DNS-Server/Audit is a good example as we can compare and see it matches, and click Properties
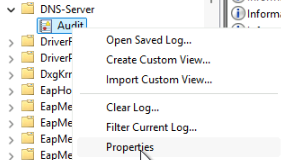
We can see the Full Name here
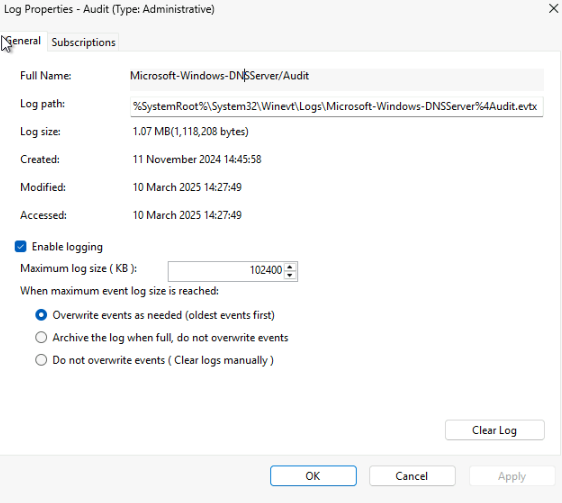
Which is what goes in Windows Event Log Channel Aria uses
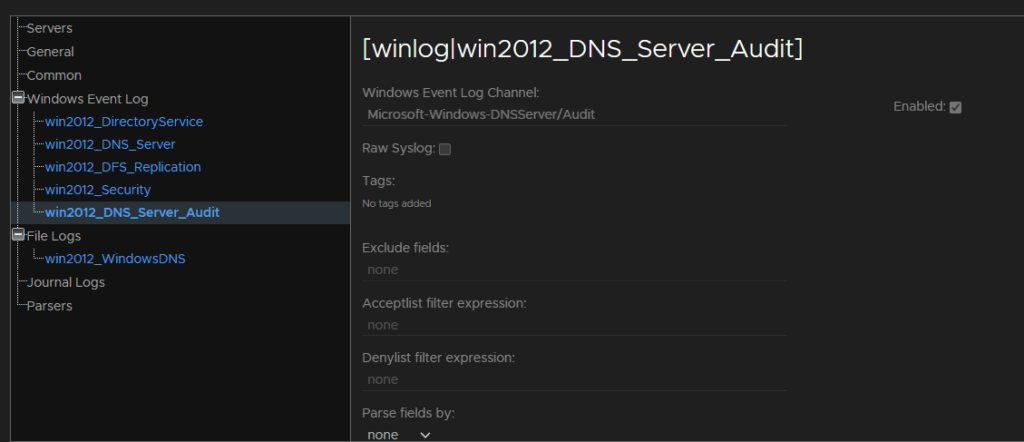
So with this information, you can inject thing in event viewer into Aria for better management, which is helpful when you have applications logging elsewhere
As the AD content pack also shows, you can inject a log file like with Linux, which some applications also use
3.2 – Aria Operations
This is by far the biggest section for the Aria deep dive, as there is so much the Operations Manager can do, but we will touch on the most helpful bits that can give you a lot back for the management of your VMware environment
3.2.1 – Setting Up The Base
3.2.1.1 – Adding vCenter
From the appliance UI go to Home/vCenter and click add account
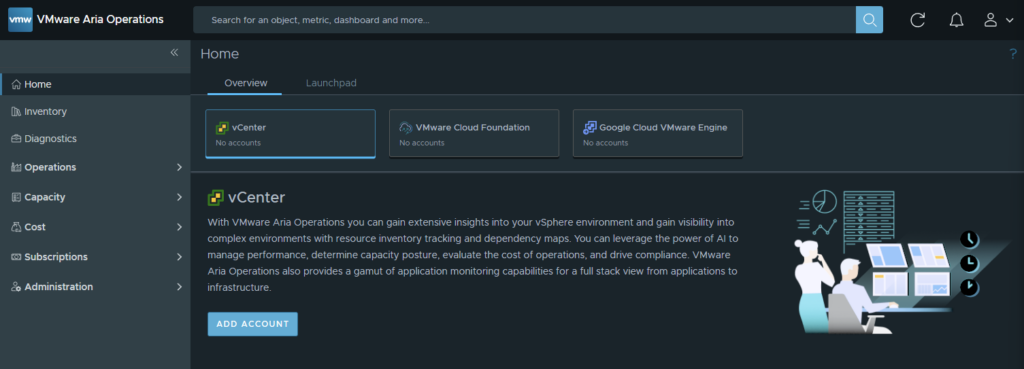
Then click vCenter
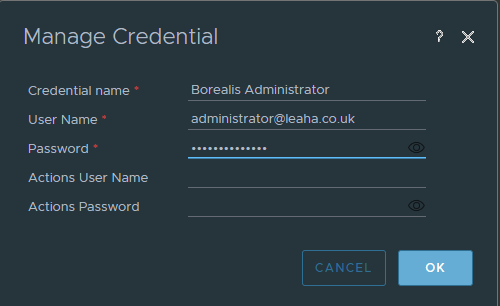
First, name the vCenter, I have used the appliance name, then add the fqdn of your vCenter, click the Plus to add a credential
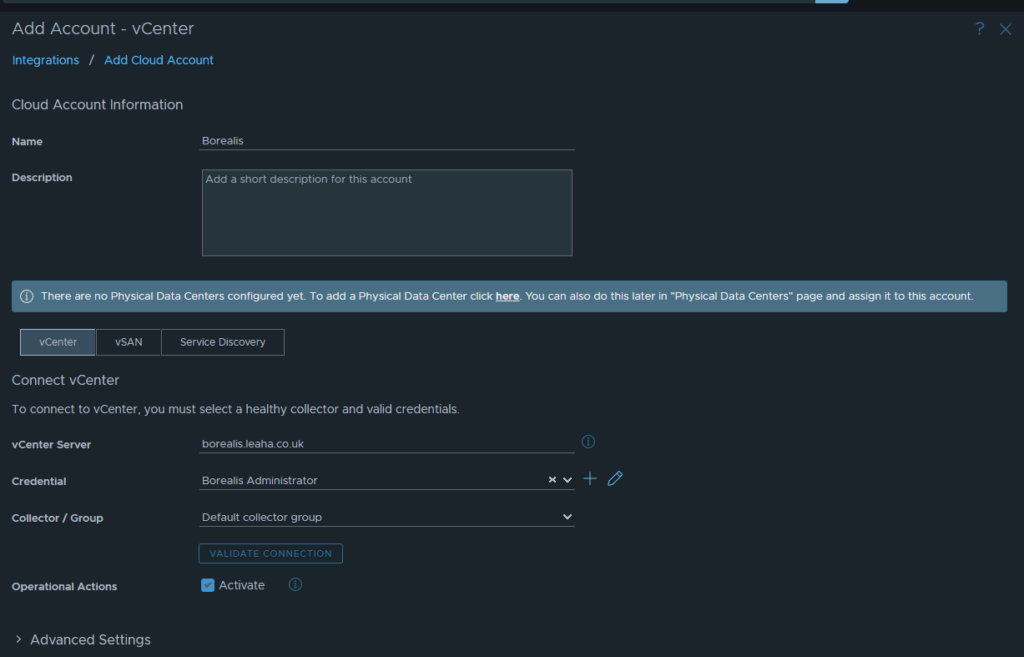
Add your vCenter login, my vSphere domain is leaha.co.uk, but I have just used the admin account
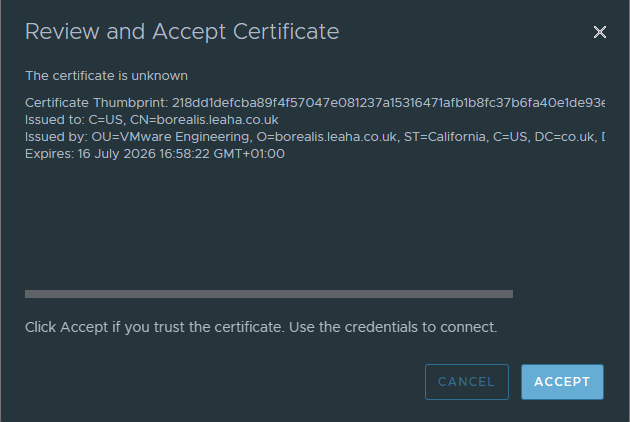
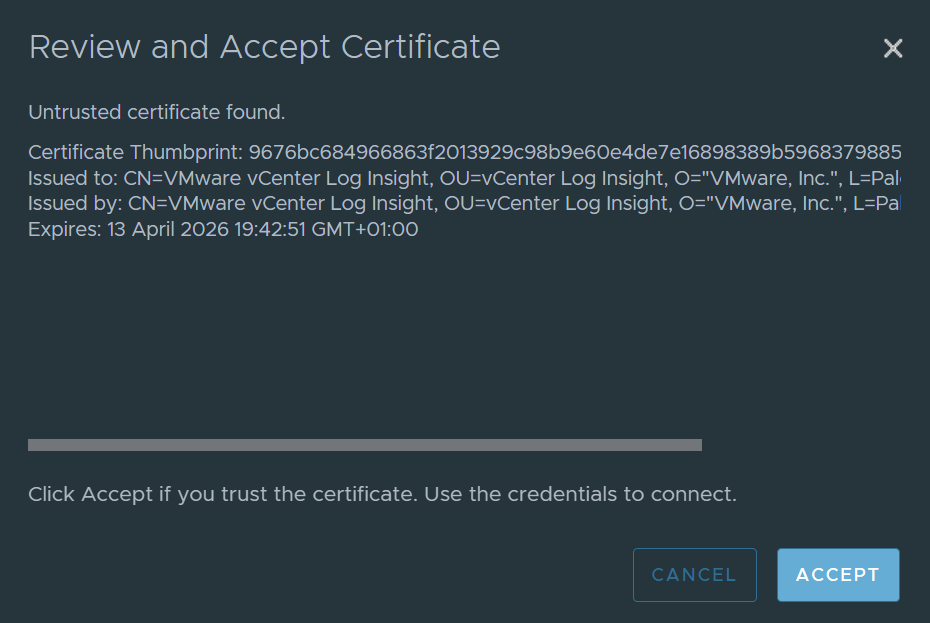
Once thats added, validate the connection and accept the certificate
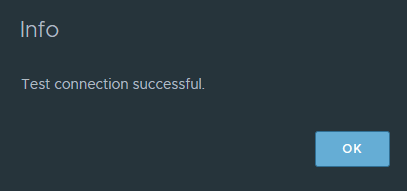
And make sure you get this to ensure its all working
If you have vSAN, enable this part here for data collection, I dont so its staying disabled
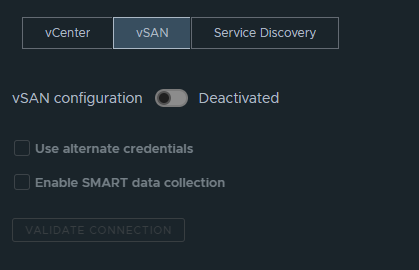
Under Service Discovery, you can provide OS credentials to gather more info, I will be enabling this and adding credentials, but its not mandatory, I am using the Windows/Linux credentials, I dont have SRM
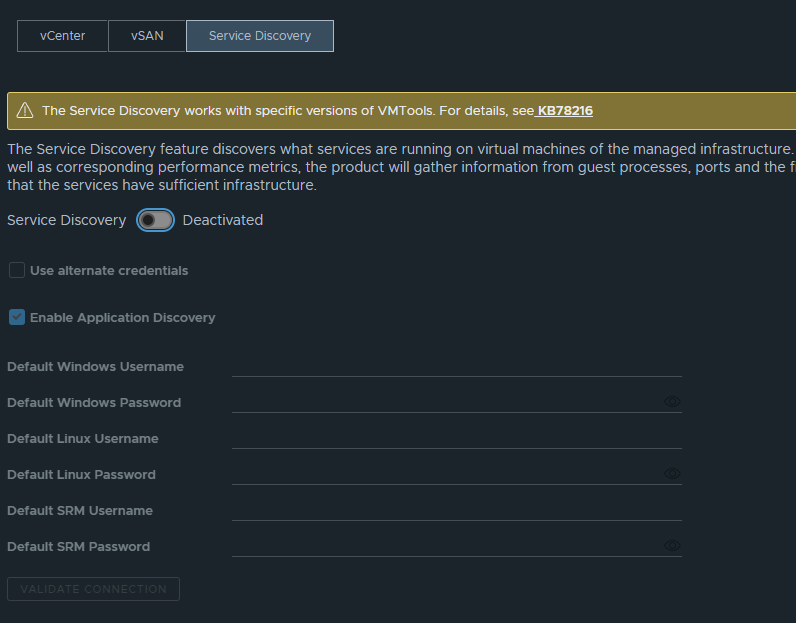
Now I have filled out everything I need, we can click Add at the bottom, ignore the banner for the physical data centres, we can sort that later
3.2.1.2 – Adding Aria Operations For Logs
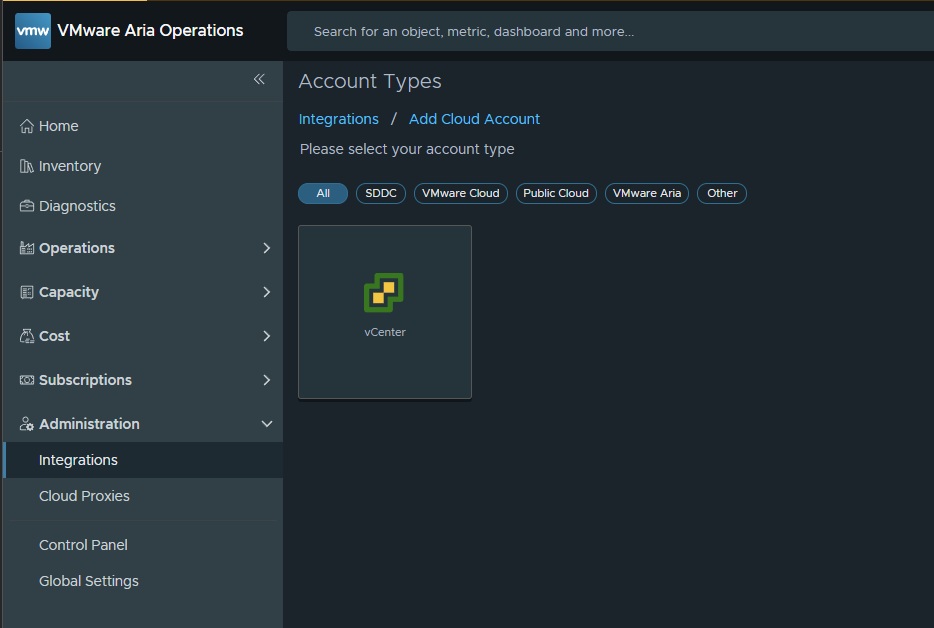
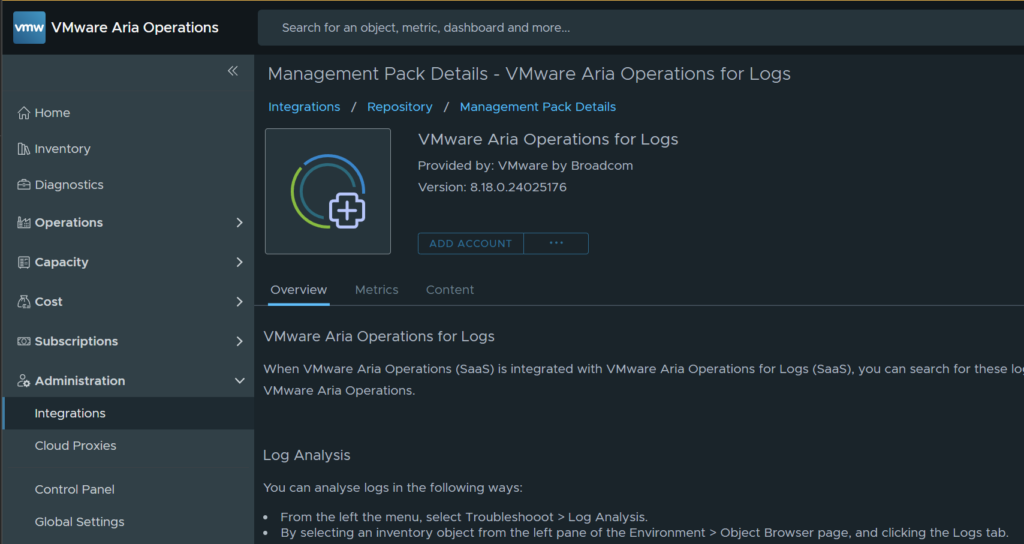
Go to Administration/Integrations and select Aria Operations For Logs
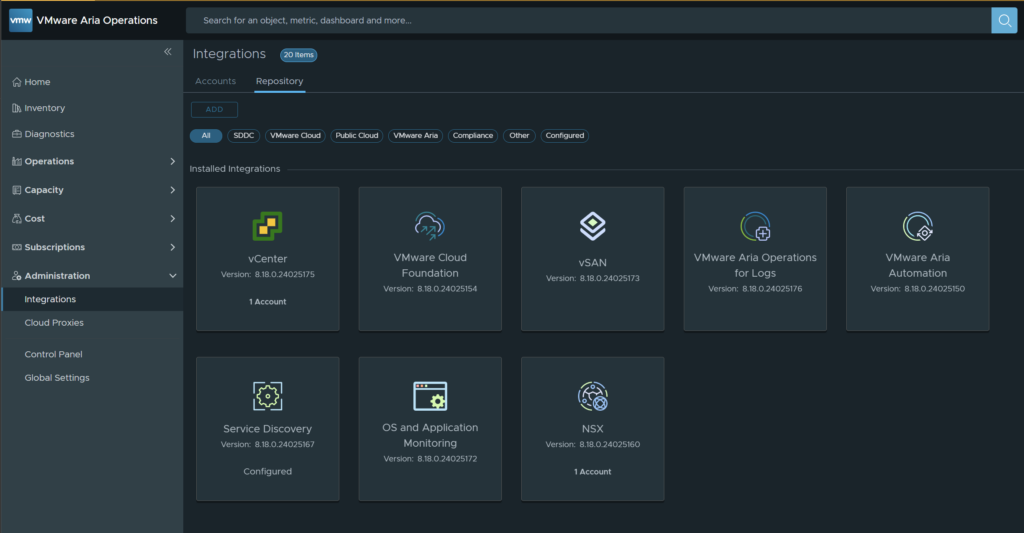
Click add account
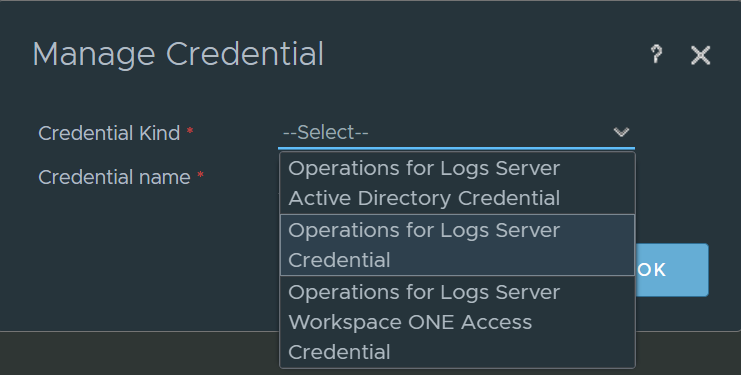
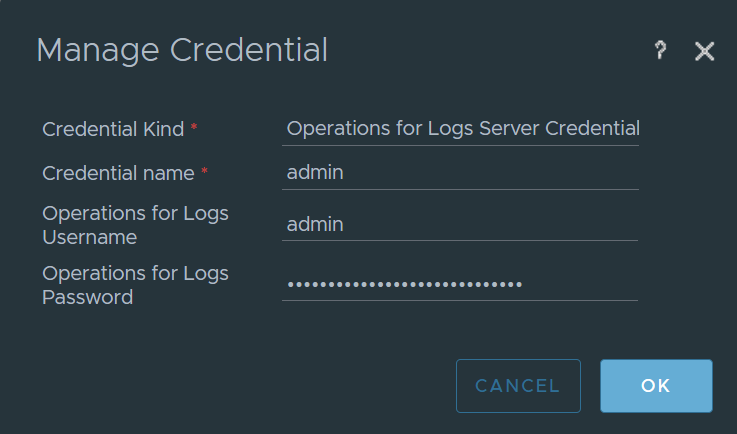
Fill out a server name, log server fqdn/ip, click the plus to add a credential

For the built in credentials on the Aria Log server select the middle option
Once you add that validate the connection and accept the SSL certificate
Then click add in the bottom left
3.2.1.3 – Configuring A Physical Data Centre
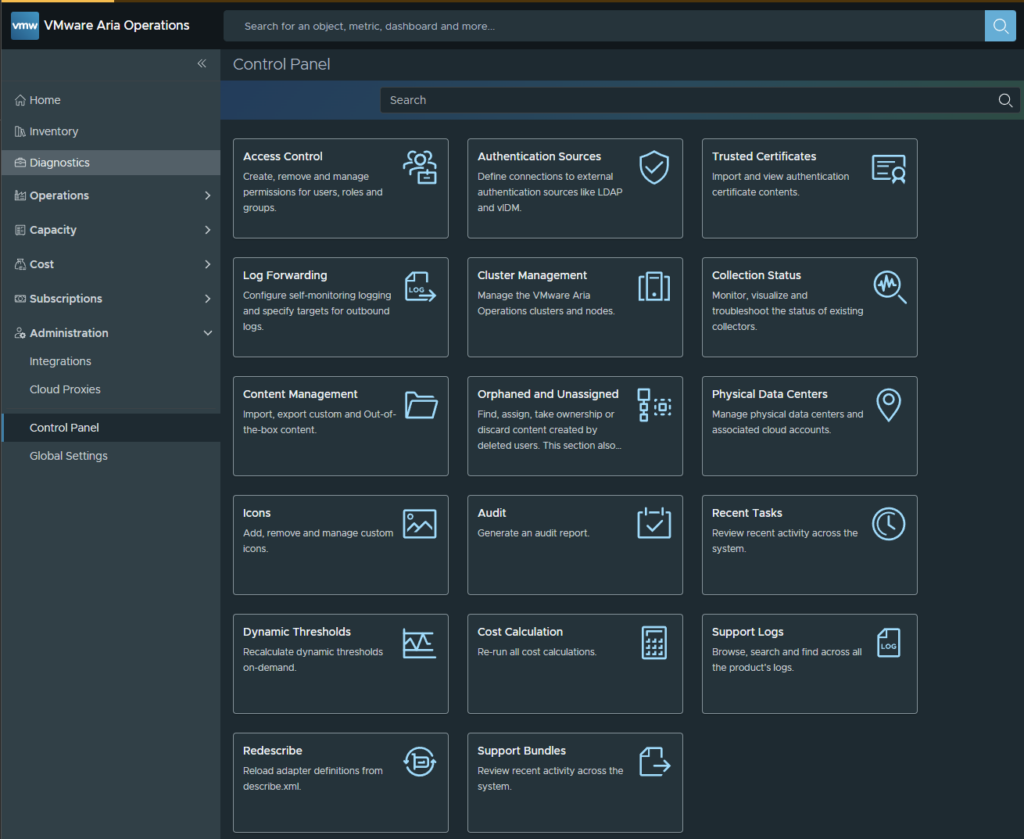
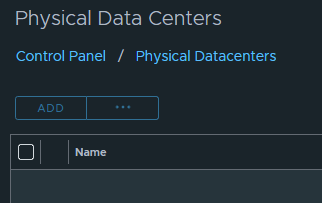
To set this up go to Administration/Control Panel/Physical Data Centres
Click Add
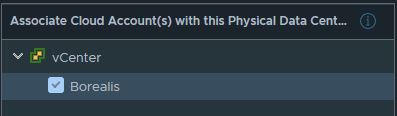
Double click on the map where you want it, add a name, and associate cloud accounts with it, then hit add, now we have a physical Data Centre

3.2.2 – Capacity Management
This is the part where I mentioned before you want to leave it a couple of weeks to build information up, as the following will be inaccurate or not populated if you just added the vCenter and Aria Operations For Logs in
3.2.2.1 – Right Sizing VMs
Aria Operations can see the VMs in your environment and is able to suggest changing VM sizes to better fit their use, its not a perfect size, so I would keep appliances the same and ignore those
Too see this go to Capacity/Rightsize, from here you can see over sized and under sized machine
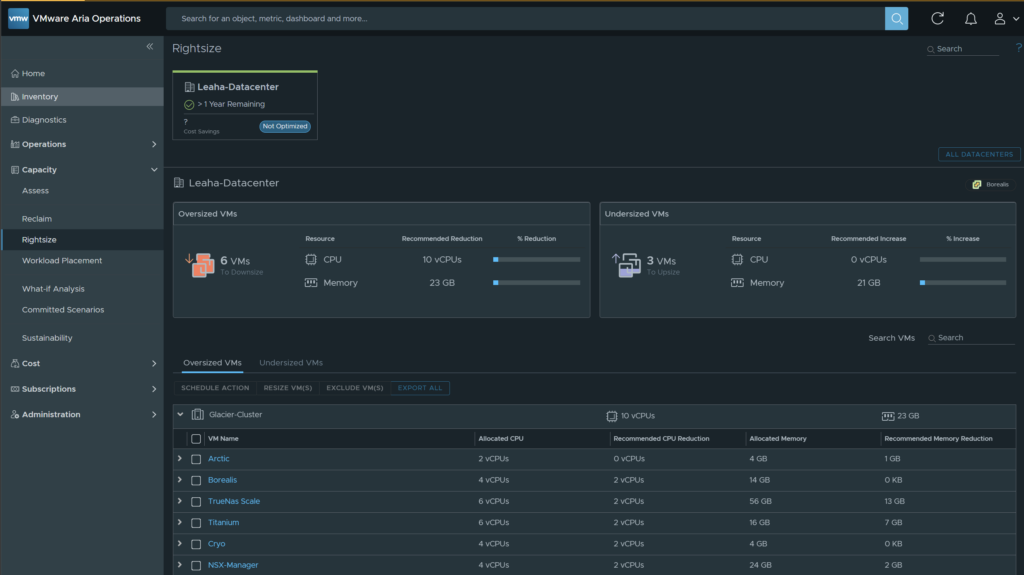
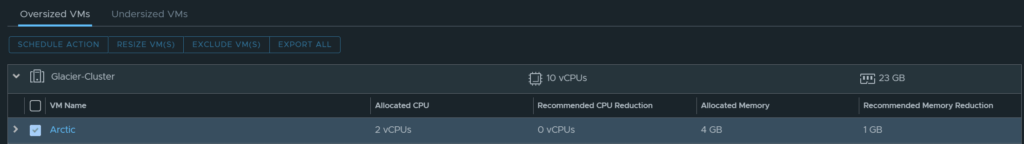
If you want to make the suggestion you can click the check box on the machine and click resize
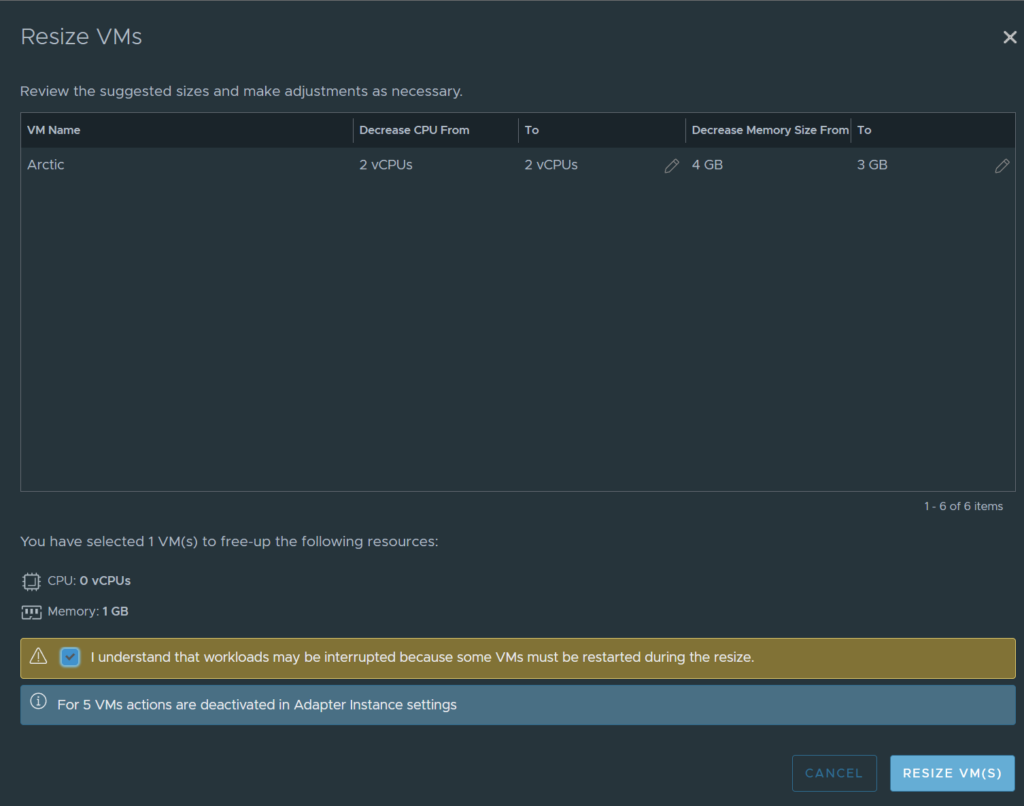
Here this VM will have its memory reduced to 3GB
Clicking resize will do it immediately, or you can schedule it at a particular time, like over night, as this will reboot the machine
For an immediate rightsize
For a scheduled one
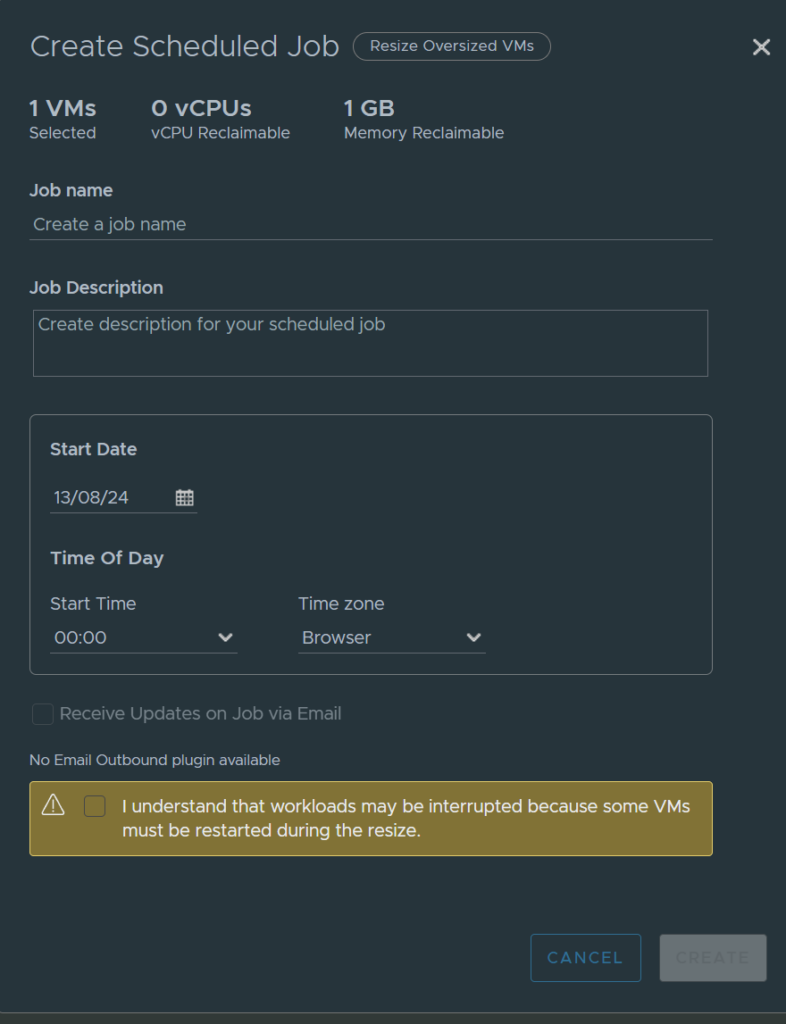
Aria will then auto power the machine off and make the adjustments, then power it back on, no further action needed
3.2.2.2 – Reclaim Resources
You can reclaim resources from Capacity/Reclaim
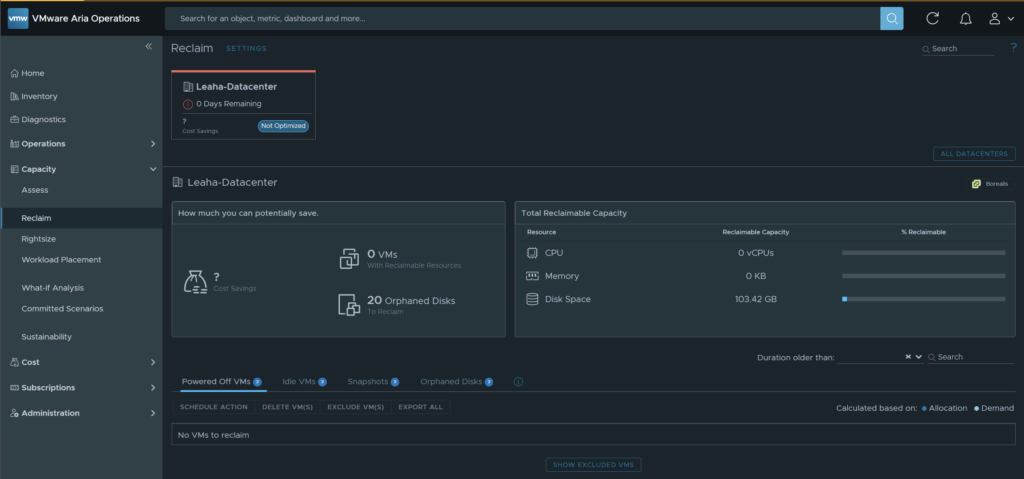
The info here is a little vague as its an on prem environment so I dont have costing setup, this would be better for VMware cloud, eg AVS
But it does show ~100GB of potentially orphaned disks that could have the space reclaimed
Here under orphaned disks it shows where on the datastores you have potential disk space to reclaim
Its worth noting these are potentially orphaned, so you need to check this manually and be very careful not to remove something you may need

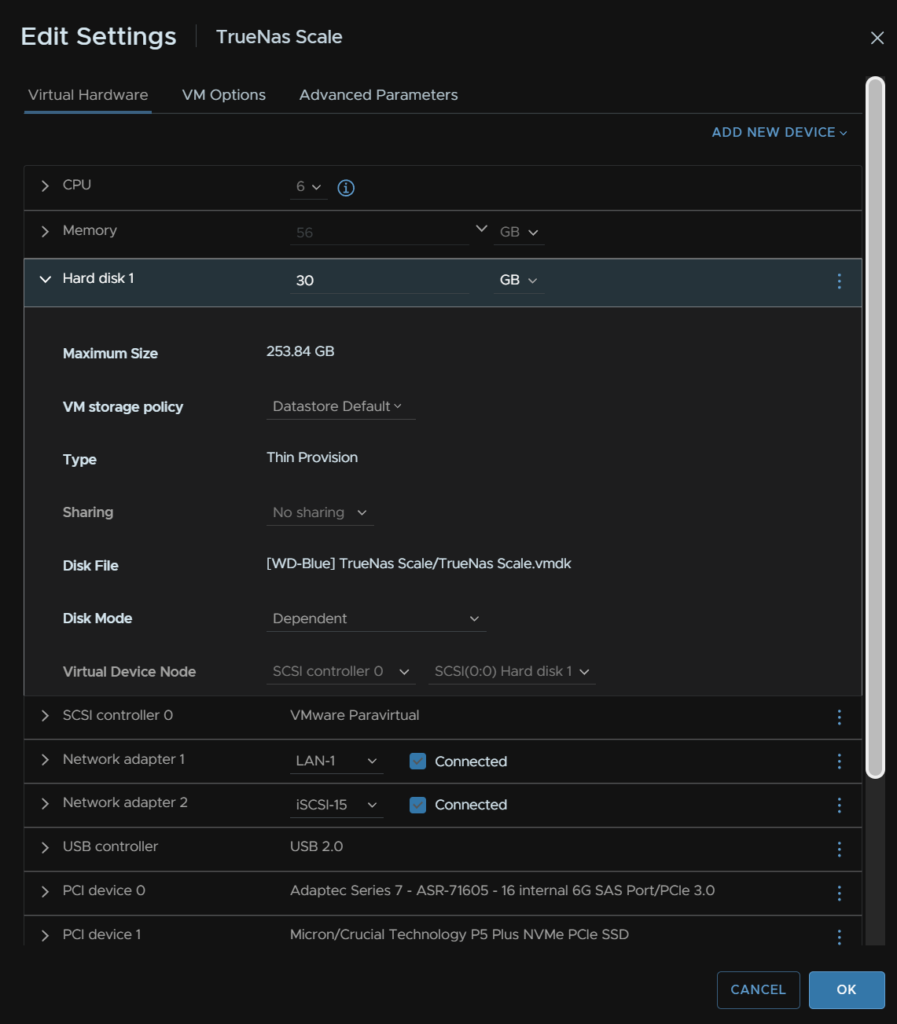
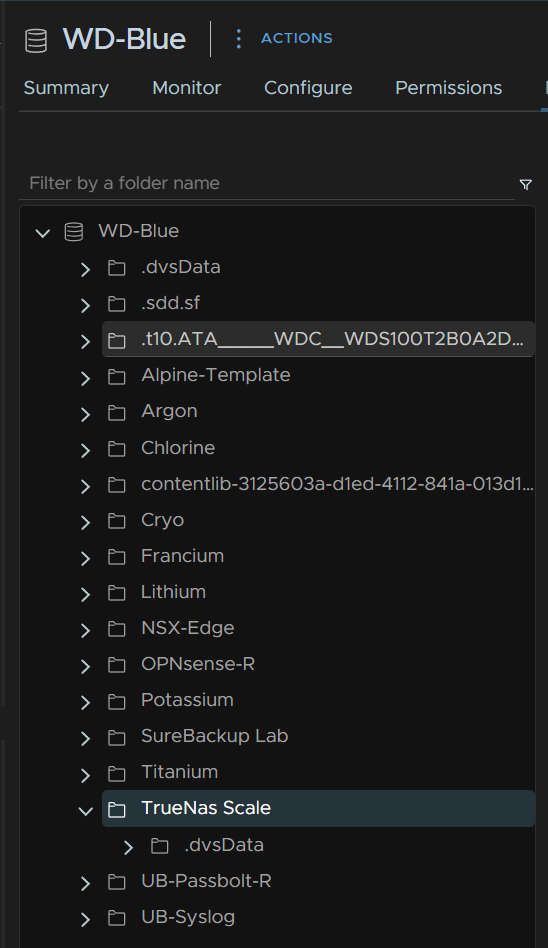
Lets look at TrueNas, thats easting up 40GB on my WD-Blue local SSD, which is odd as its just got a boot virtual disk at 30GB
The disk listed here is under TrueNas Scale/TrueNas Scale_1.vmdk
Where the VM is called TrueNas Scale
Checking in vSphere the active disk is TruenNas Scale.vmdk, so this could be an orphaned disk
As this looked orphaned, I have exported a config of the TrueNas server on the off chance and went to the datastore and removed that file from here
This also flagged 46+15GB on my TrueNas Datastores for the Lab VMs for stuff that was orphaned out of old labs, so there was about the full 100GB that could be removed
3.2.3 – Capacity Expansion
3.2.3.1 – Workload Planning
Aria Operations can plan for what adding certain workloads might look like in your environment, lets run through some testing here for adding some VMs that are coming in a future project to see how the cluster handles them, as an example
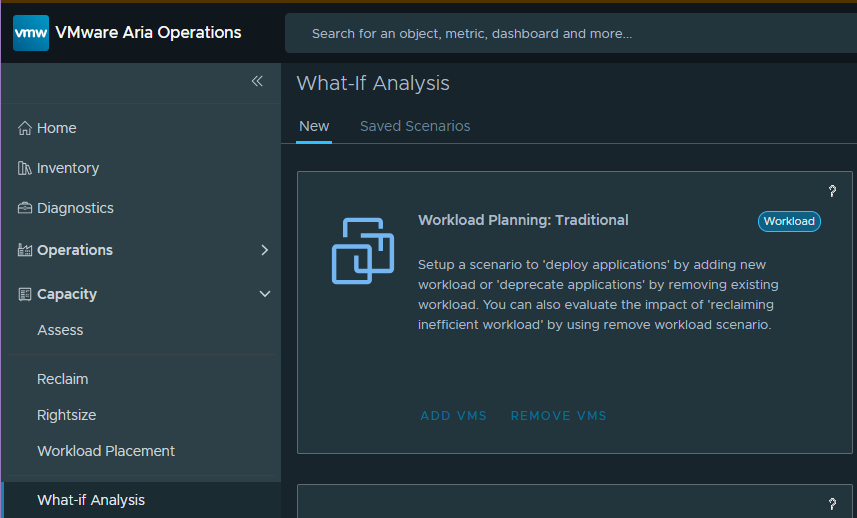
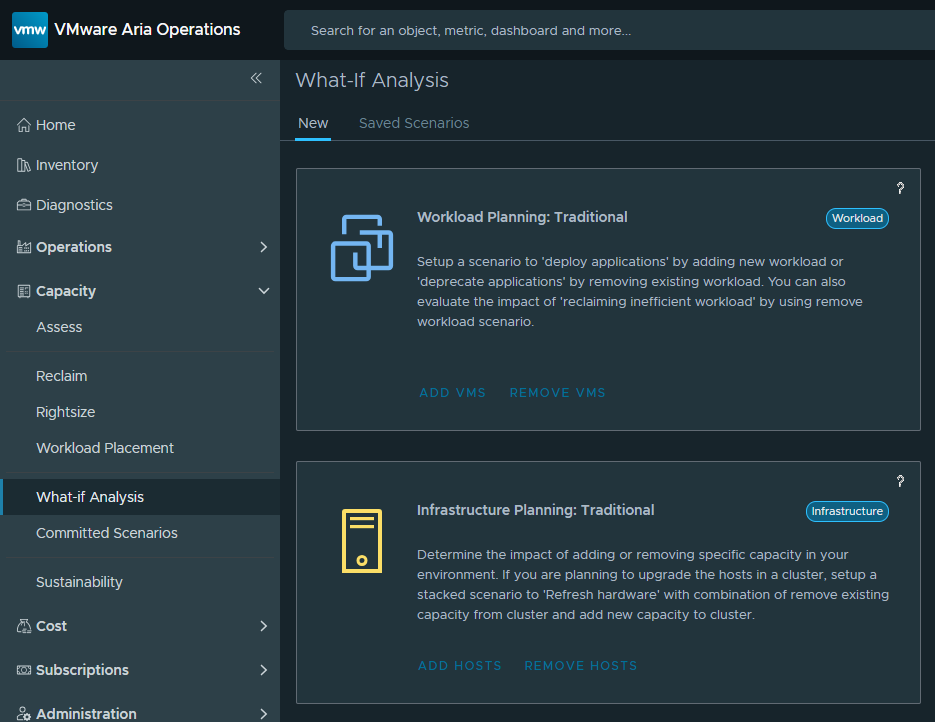
Under Capacity/What-If Analysis we can click Add VMs under Workload Planning
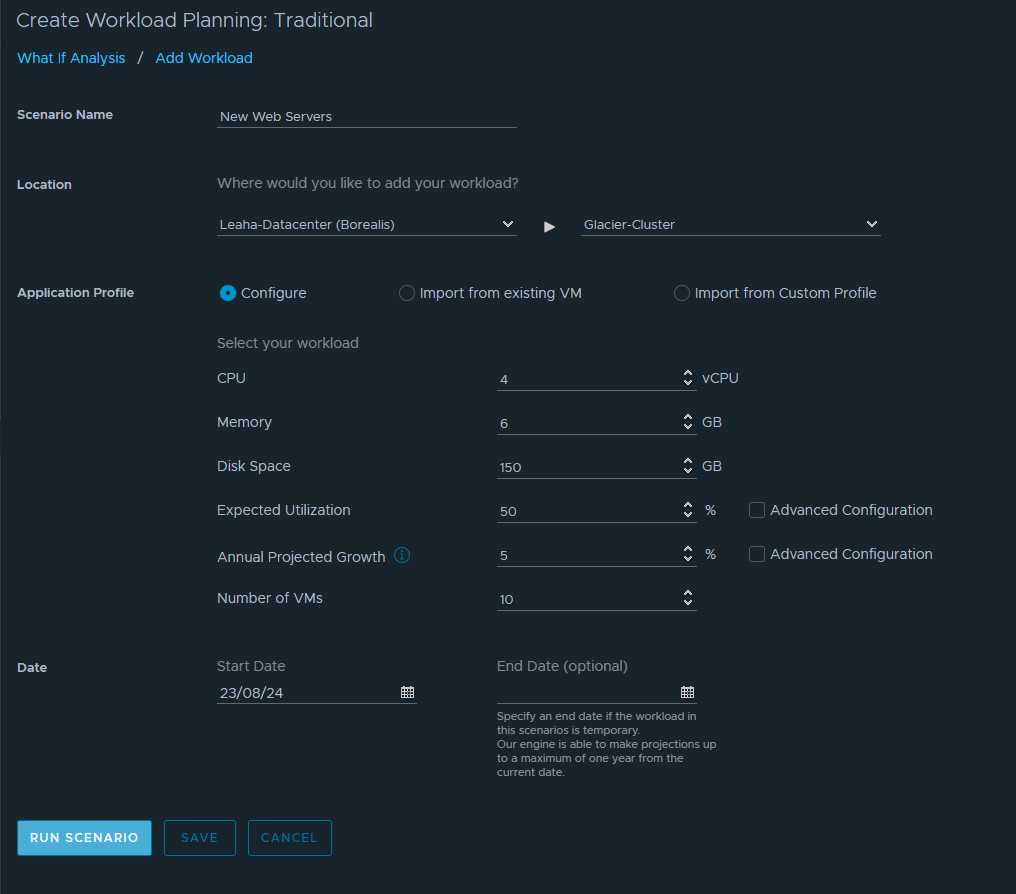
Lets suppose I am planning to do some web hosting for some customers, I have a lot of websites to host, so i think 10 VMs with the following are needed
- 4 vCPU
- 6GB RAM
- 150GB Disk
- 50% Expected utilisation
- 5% Annual Growth
- No end date
We can run this scenario to see how my host with the following can handle it on top of its current workload with the rough host specs
- AMD Epyc 7402P
- 384GB RAM
- ~4TB Disk
Here I can see that I dont have enough CPU to run this, I need ~17.8GHz more
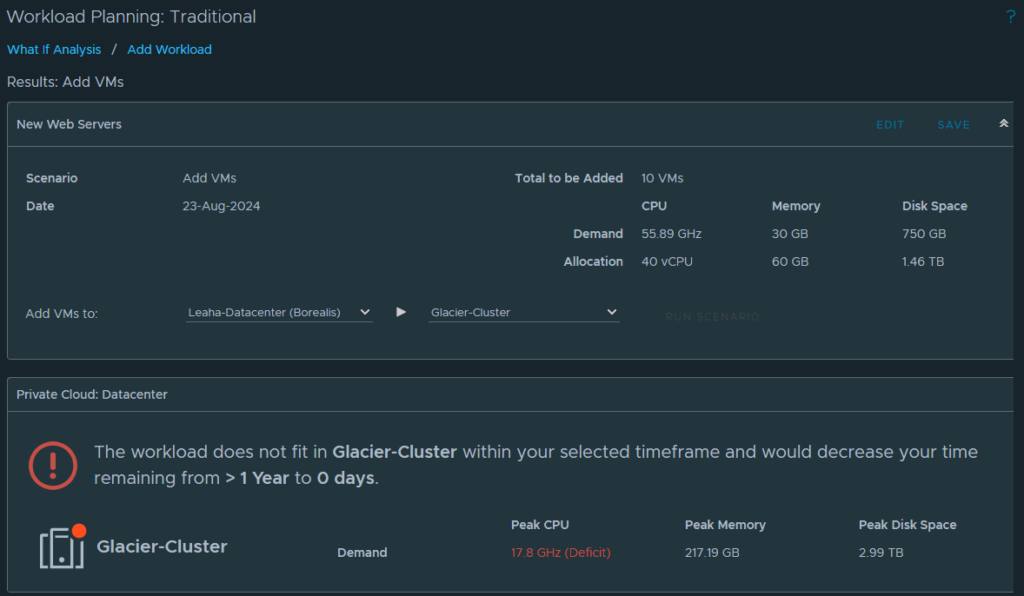
So this helps with planning for future workloads, now if I want to go hosting websites for customers with the expected spec, I need more CPU
I am going to save this workload for now to continue the planning
I can now look into Infrastructure Planning, as I dont have the resources to run whats needed here, which will be shown in the next section, 3.2.3.2
But, coming back to this after adding a host and committing this in 3.2.3.2, the workload now fits
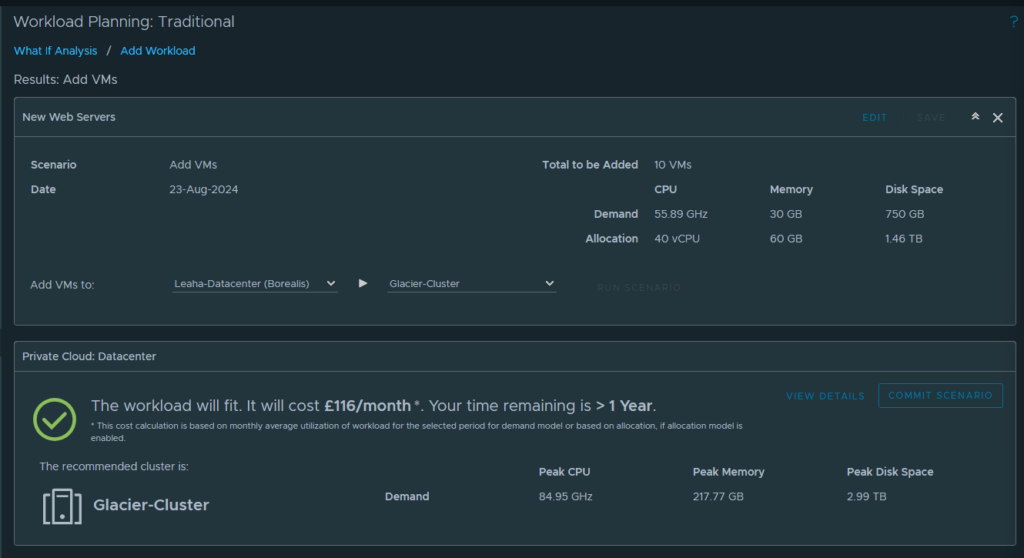
So this can help put cases forward to management about ordering new kit and speccing the environment better when projects are coming
3.2.3.2 – Infrastructure Planning
Aria Operations can plan for what adding certain infrastructure might look like in your environment, lets run through some testing here for adding another host as addming some Vmware for web hosting showed I need more compute
Under Capacity/What-If Analysis we can click Add Hosts under Infrastructure Planning
First lets name the scenario, and select a datacentre and cluster, then we need to select server
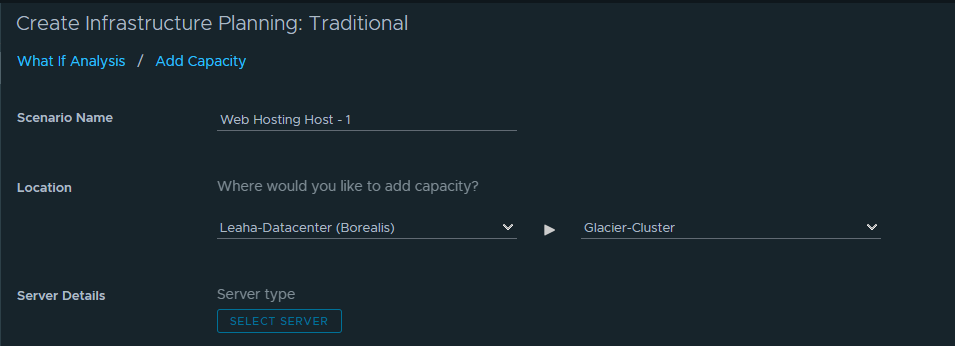
By default it will show you servers in the cluster
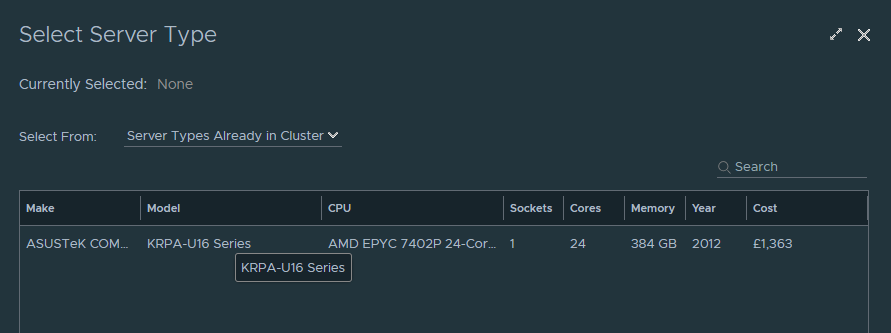
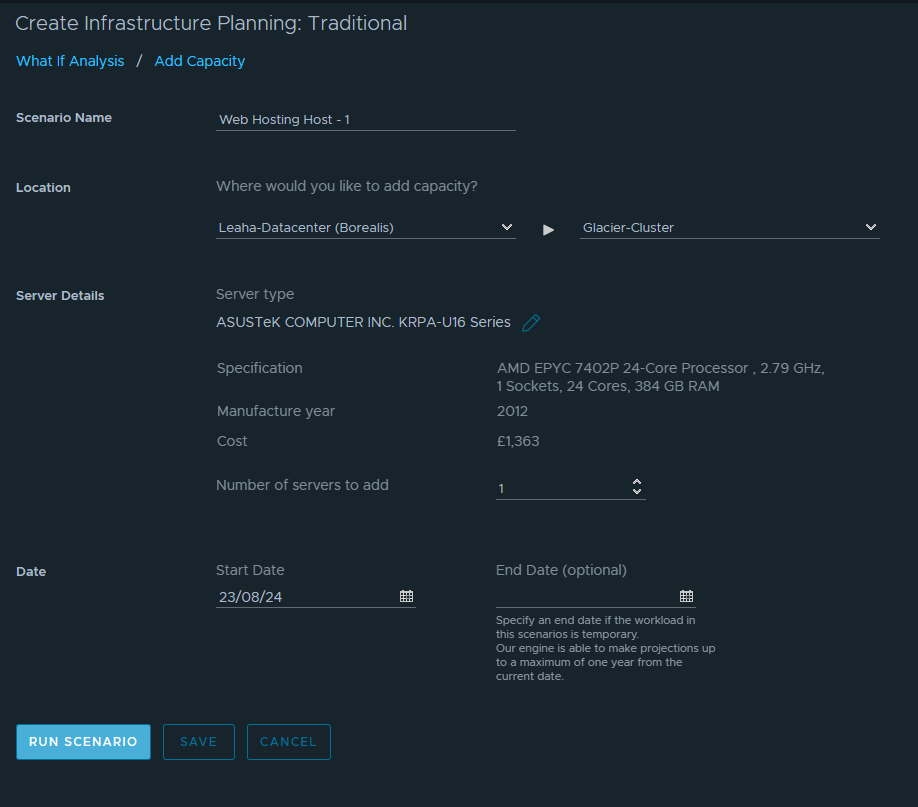
But you can change that to search for anything, you can even add a custom server spec, while you can search for servers, the list of really out of date, so either add another host matching yours or setup a custom spec, I am going to add another of the same spec
And run the scenario
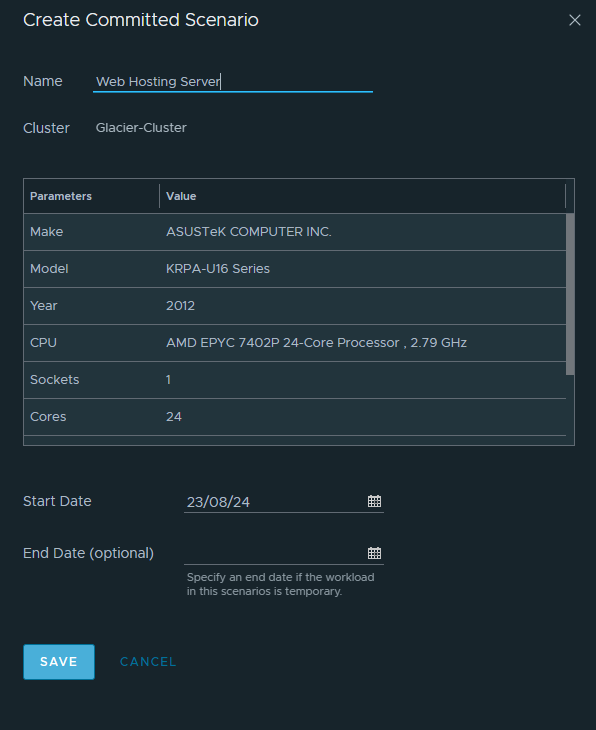
Here we can see what that would look like, in this case, it double my capacity, so if I click commit scenario, it will apply this for future testing
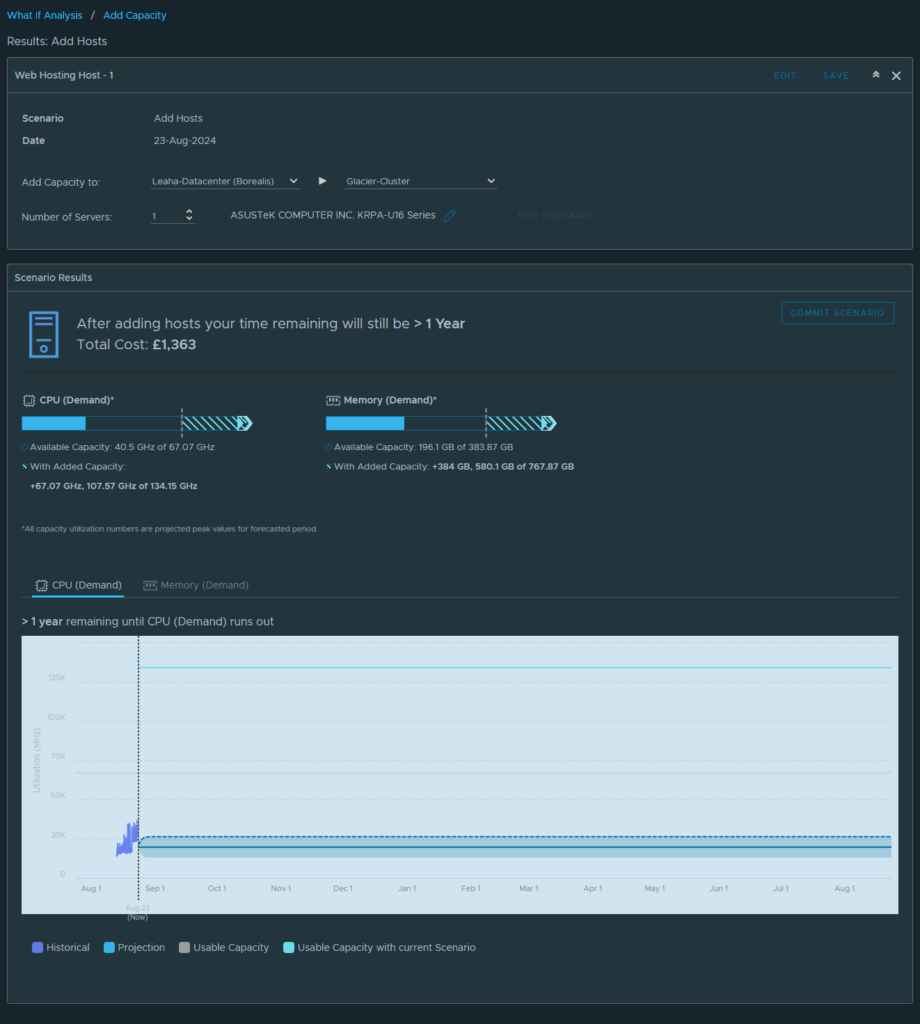
Add a name and commit
3.2.4 – Alerts
3.2.4.1 – Alerts Hub
We can see alerts under Operations/Alerts, and here we can see potential issues with an environment, some of this stuff isnt very helpful though, but you can silence things that arent important to your environment
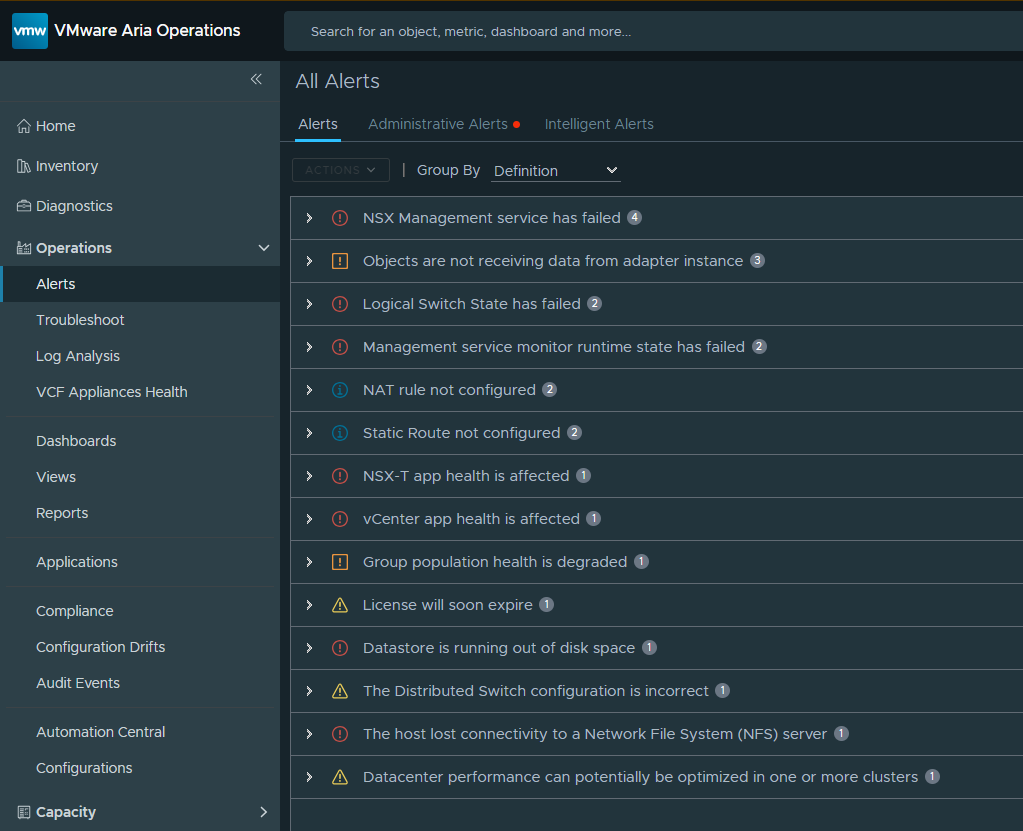
NSX manager alerts like these for example in my environment, arent important, these services either arent in use are arent needed for me
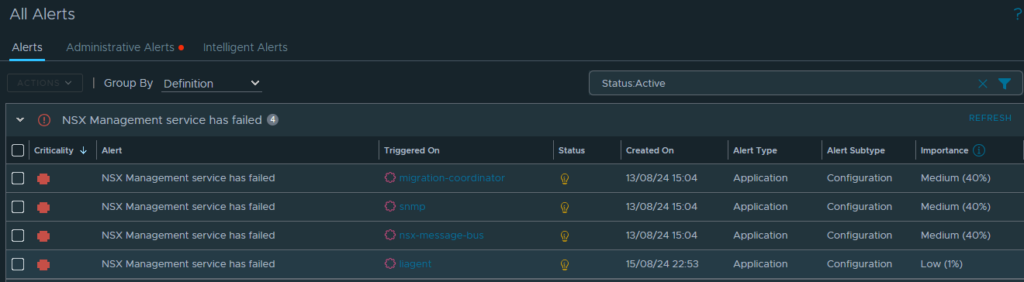
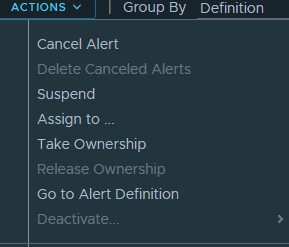
So I can select them and cancel/suspend them from actions, however, they may pop back

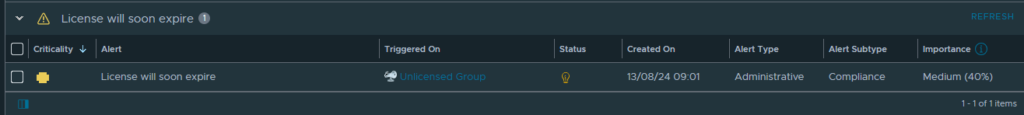
More important ones are the licenses expiring soon
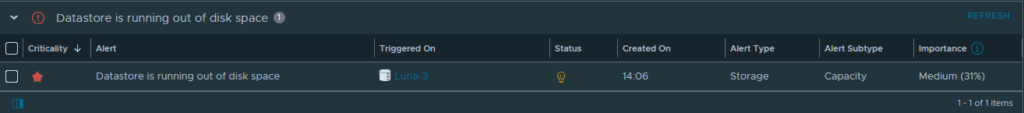
Datastore out of space
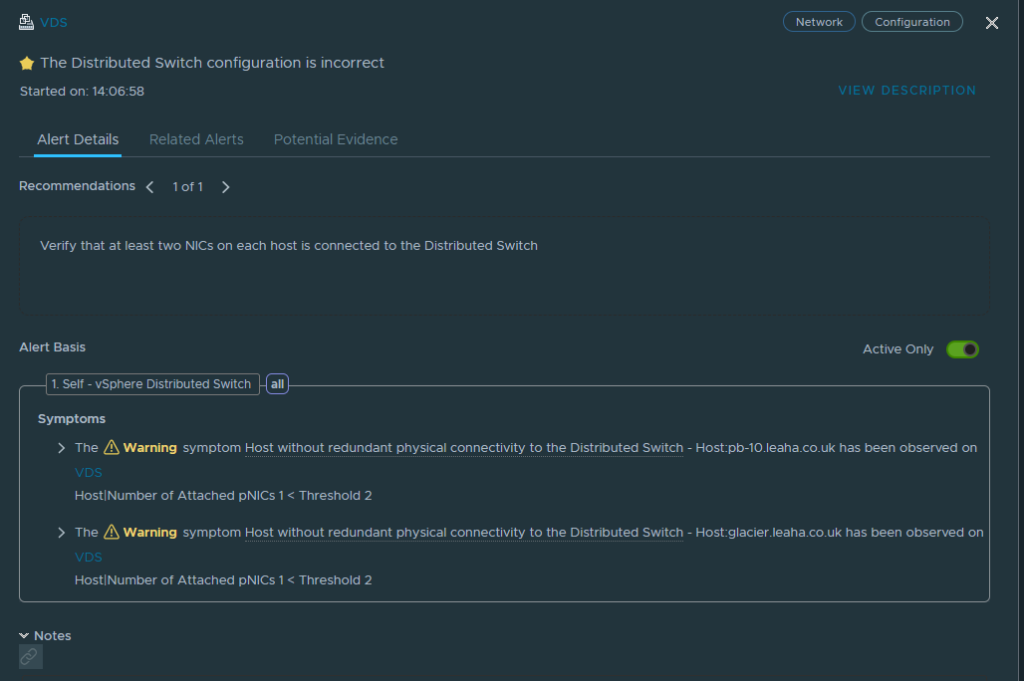
Distributed vSwitch configuration issues

If we click into this we can see why, this tells me the hosts have only one uplink, not two, so thats something I can look to sort
Under actions, you can also go to the alarm definitions if you want to delete an alert, or tweak it
Then from here you have some options, delete will remove it, you will never get that alert again, unless you manually set it back up
Click next at the bottom and head to the second tab for Symptoms/Conditions

Find the condition you want to remove, and click the ‘x’ to remove it
Then click Update at the bottom

Its also worth noting, by default, Aria keeps alerts that are inactive, where the problem has sorted its self, for 45 days, so you may find a flood of inactive alerts piling up
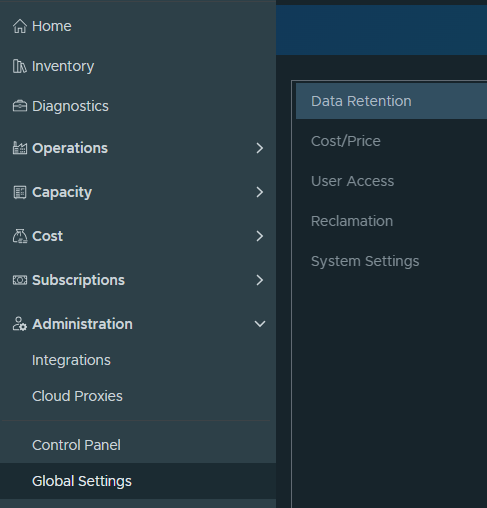
To change this go to Administration/Global Settings/Data Retention
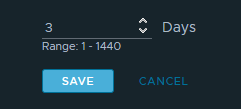
You’ll then see this, you can change this to a number of days you would like

Then hit save
It will take a while for this to apply and clear alerts, so give it 24 hours and it should sort the rest of the stale alerts out
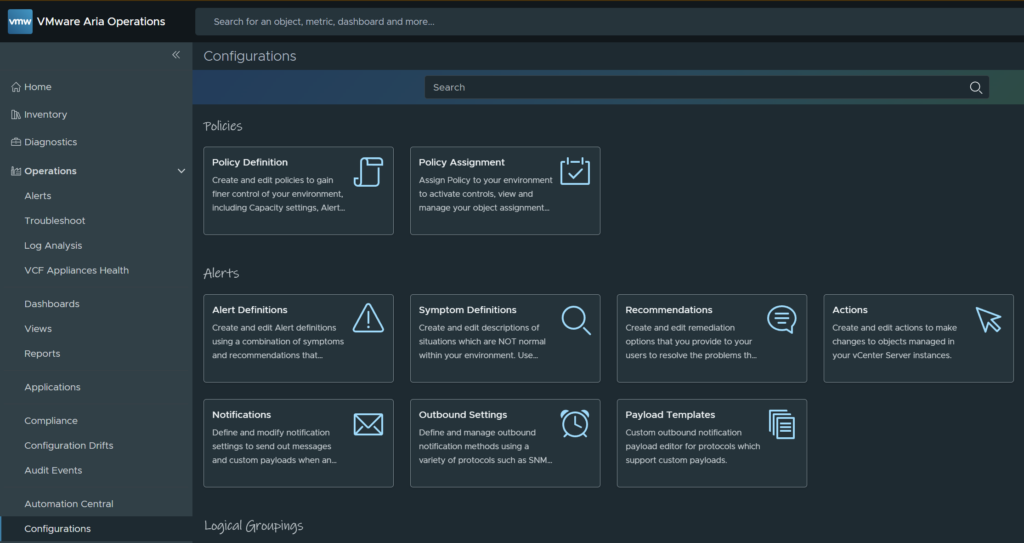
3.2.4.2 – Setup SMTP
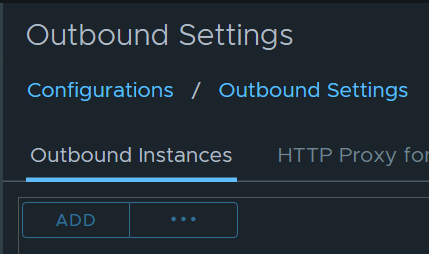
You can setup SMTP alerts in Aria Operations by heading to Operations/Configurations and clicking outbound settings
Click add to add a new instance
Select Standard Email Plugin, and name the instance
Set your SMTP host and the port, its normally 25 or 587, set the secure connection type, if you are using SSL/TLS, add the sender email of what you want the notification to show, add a sender name, and specify the credentials, you’ll likely need them and it support basic auth for a username/password, in my instance there is no authentication needed so No Credential was selected and add a receiver email to send the notification too for a test, this is not saved, and recipient is defined in a notification, not here
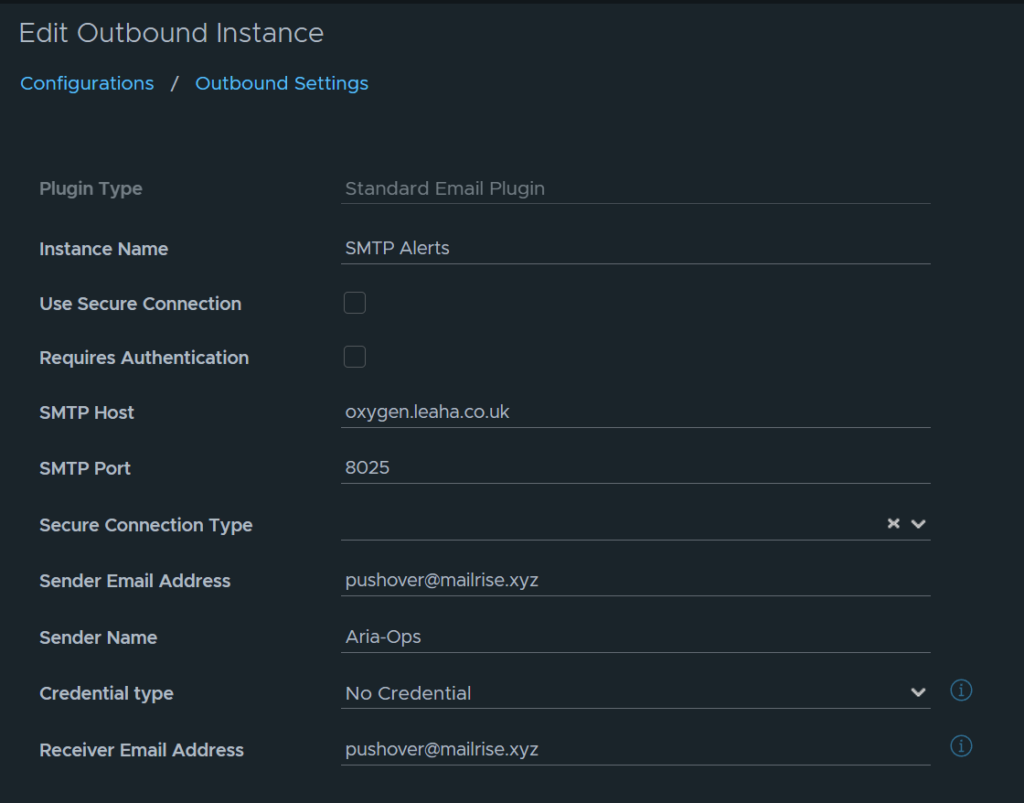
And when I then click test at the bottom, I get my email through and I can click save, the receiver email is not retained
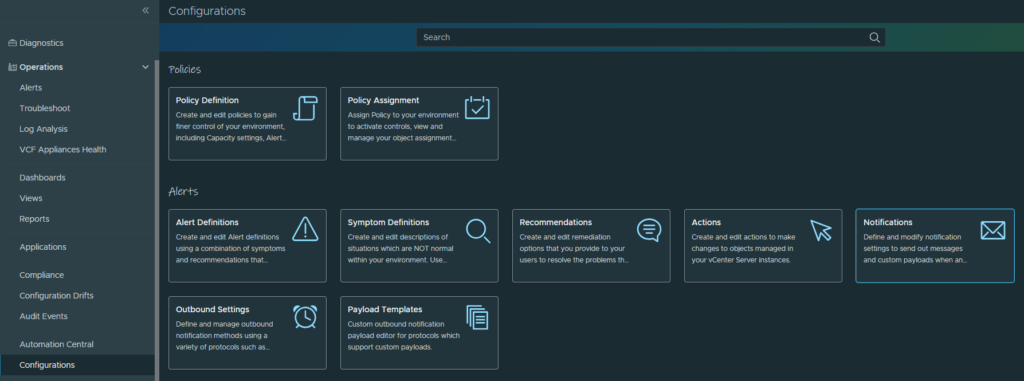
3.2.4.3 – Email Notifications
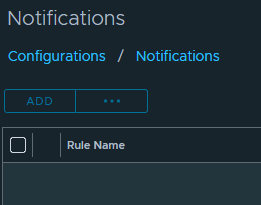
To set up email notification rules, head to Operations/Configurations/notifications
Click add
Add a name for the type of notification you want, eg critical alerts and click next at the bottom
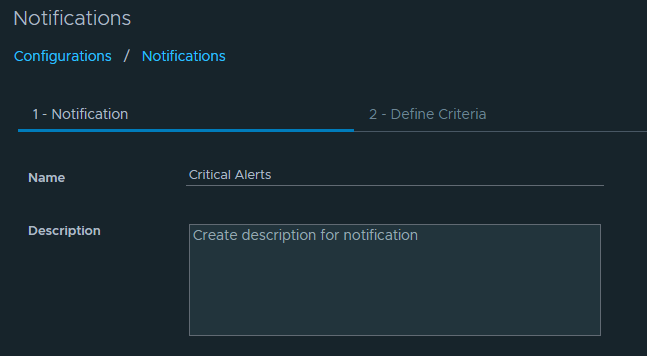
Set the criteria for Object Type leave this blank, it will do every object this way

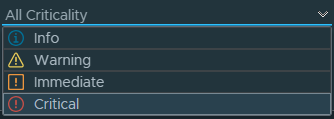
Now we need an alert scope, keep Category to All Alerts, under Criticality, select the alert critically, eg critical for my alert
Under control state, click open
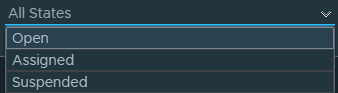
It should look like this
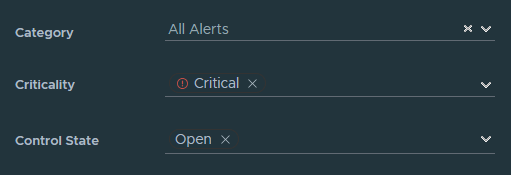
For Notify On, look at Status and select New and Updated
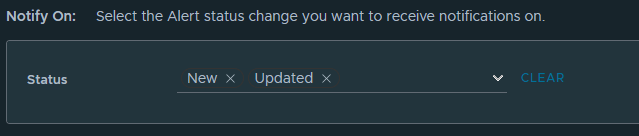
Then click next at the bottom
For Outbound Method, select the Standard Email Plugin
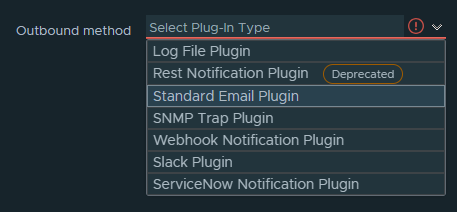
Then set the instance, this will be from the SMTP setup done earlier
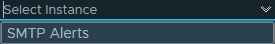
Which should look something like this

Then click next
Now you need to add your recipients, for example, a group, or the email for your ticketing system, you can also add CC and BCC addresses
Then you have notify again, the time in minutes for the system to notify you again if the alert hasnt been resolved, you can leave it blank
There is max notifications, how many time as a max you want to be notified
And lastly, delay to notify, this is the time an alert is open before it notifies you
I settled on the following, I can leave max times notified as no other setting causes it to re email for the same alert

Notify again I left blank, as I dont want to get spammed, 1 email will create a ticket
Max notifications, again, I only want 1
Deplay to notify, I set to 10, this means the alert must be open for 10 mins before I get notified, this will remove things that blip or solve them selves in a timely manner, so I dont get emails, only to have the auto resolved as I am checking them up as this is very likely
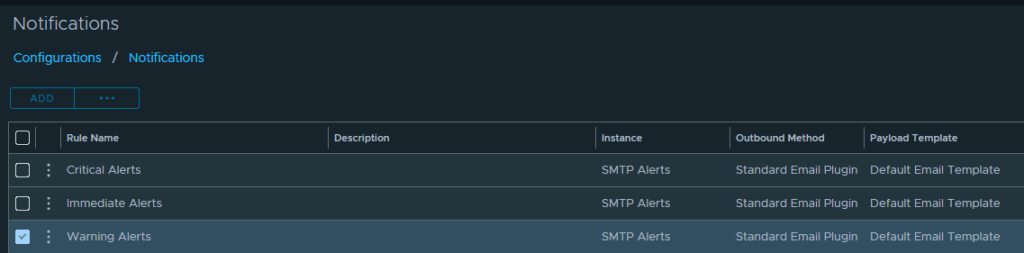
To round it off, I recreated 2 more notifications, one for each type of alert, Critical, Immediate and Warning, and set the delay to what I wanted, 10 mins for critical, 20 mins for immediate and 45 mins for warning
3.2.5 – Automation Central
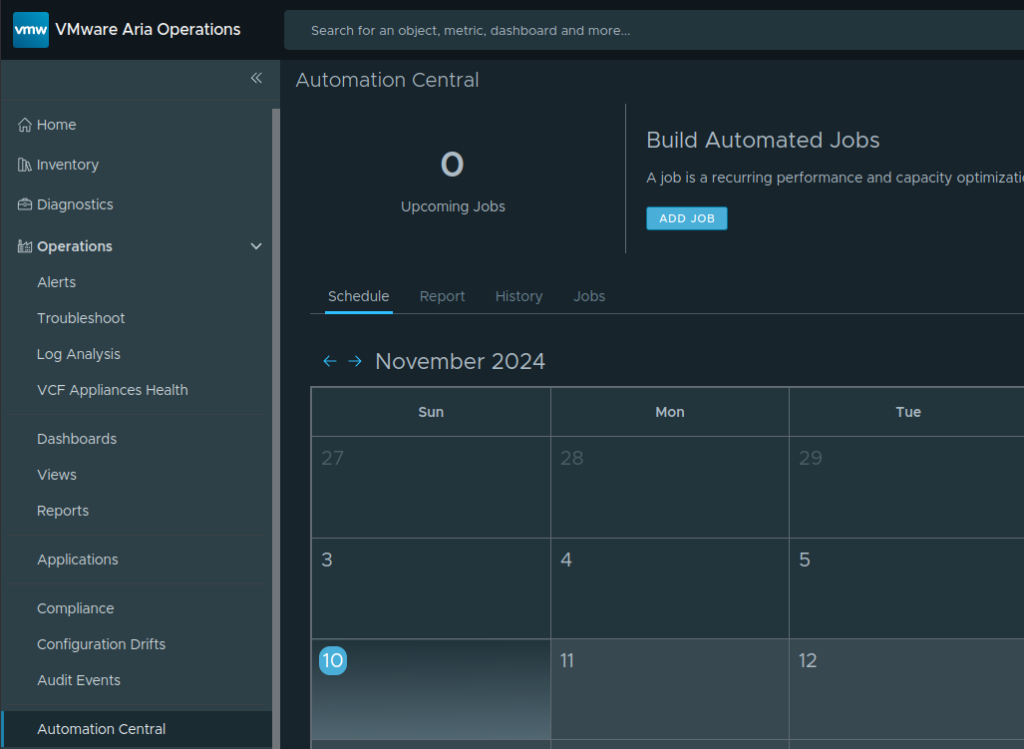
Aria Operations has the ability to automate certain tasks for you, to configure this go to Operations/Automation Central, from here you can click Add Job
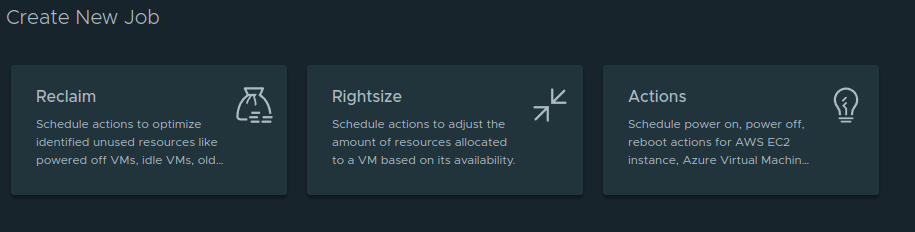
Then you can specify the job, it can right size VMs and claim resources, for powered off VMs that havent been touched in a while, which can be helpful, however you, especially with reclaiming resources, you need to be careful, as this can delete things, rightsizing will reboot VMs to apply the spec change as well
We will be looking at the ability to remove old snapshots from VMs using the Reclaim section, as people often forget about snapshots and end up running them for weeks, months and even years, baring in mind, VMware’s recommendation is no longer than 72 hours, which is a little short, but with this, you can forget about being caught out by old snapshots killing machines with corrupt chains
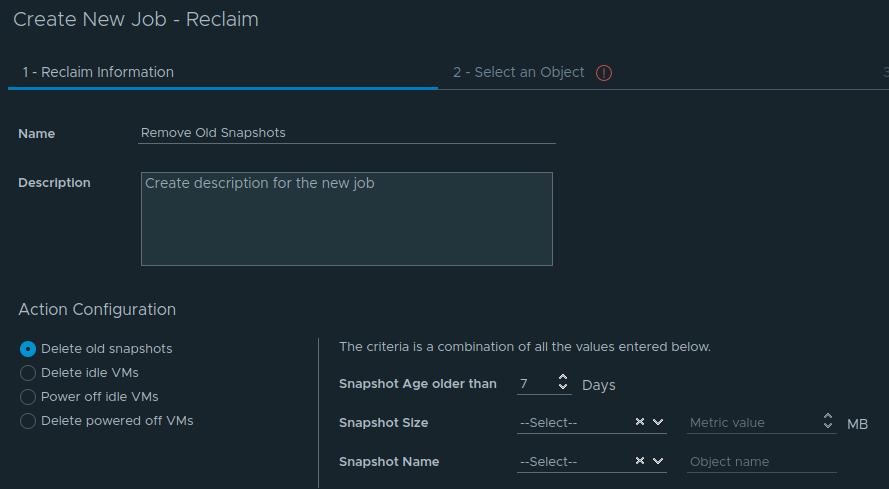
Name the job and select the radio button for Delete Old Snapshots, then set an age older than time, we configured 15 days to set as the red threshold on the dashboard, so something like 21 days might be a good idea, but this should be the time where someone who set a snapshot likely forgot they set it and wont need it, this will be dependent on your environment
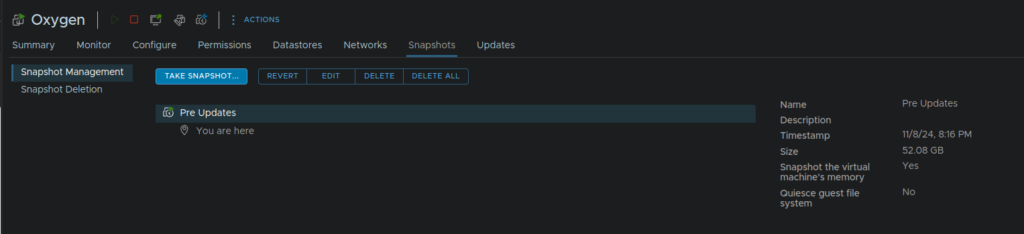
I will be using 7 days, as I have a snapshot at 7 days, so this will be a good test to ensure it works, this is the minimum time it allows as well, once set, click Next at the bottom
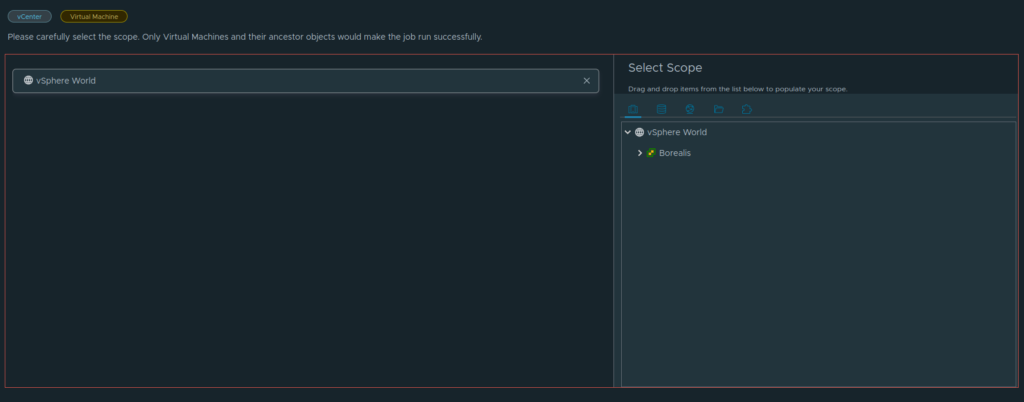
Drag vSphere World from the left, into the right box to add all vSphere VMs, and click Next again
Click next over filter if you want all Vms to be included, or, if there are a few VMs you absolutely dont want this rule running on, you can add a VM filter here

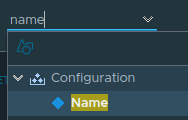
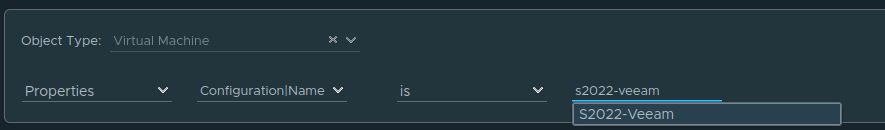
To add a VM filter, set the first drop down to Properties, then the second to name
The third to Is, and lastly search and select the VM you want to exclude
Over on the right, click Add to add more VMs

Once done click next
Now we can set a schedule, select a start date, then a time zone, and a start time, this is also the time it reoccurs at, so something outside of business hours would be ideal, set a recurrence, daily is a good option here, leave run every as 1, and leave End Date as No End Date
Lastly, you can setup email notifications using the SMTP setup we did early and adding a sender address, the click create

Once done, the calendar will reflect this
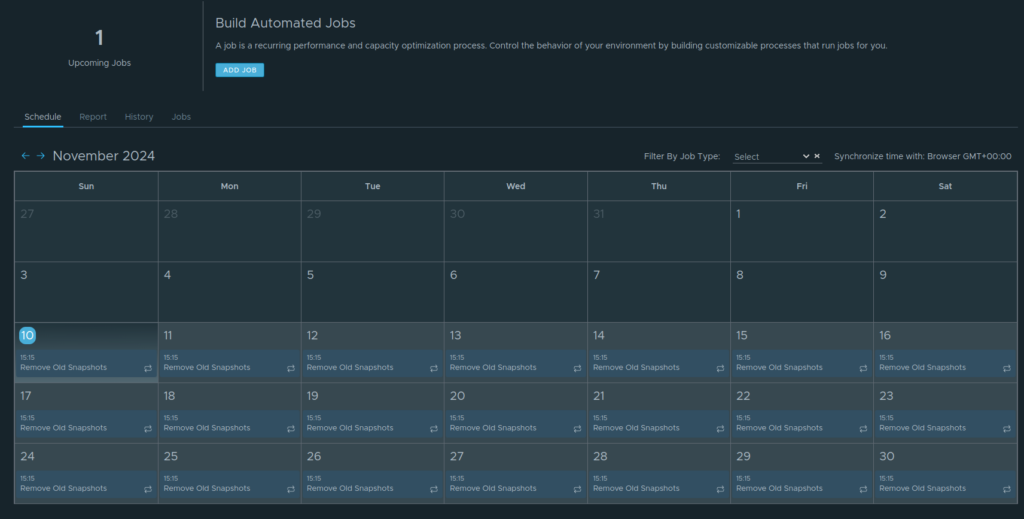
After waiting for my automated test job to run, I can see thats gone ok, and I got an email alert for that, its removed the snapshot I had on a VM for over 7 days, the history also shows this
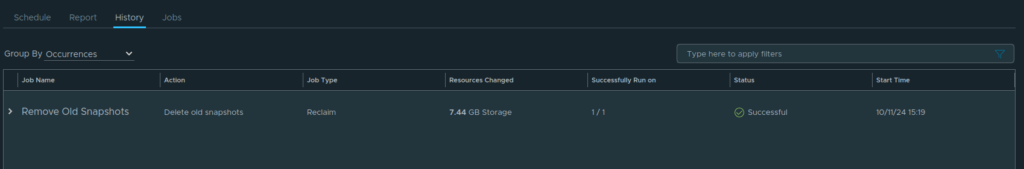
Checking in on that VM, it has removed just the old snapshot, not the newer one I have
3.2.6 – Compliance
Aria Operations is able to report on a variety of regulatory security standards and advise what boxes you tick, and what needs more work
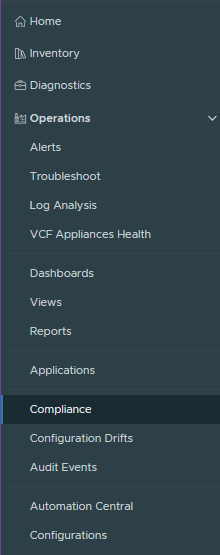
To configure this, head to Operations/Compliance on the left
At the bottom, you’ll have the industry standard benchmarks, for example, ISO and CIS
And at the top you’ll have a few VMware specific ones like vSphere, vSAN or NSX, with NSX being for VCF
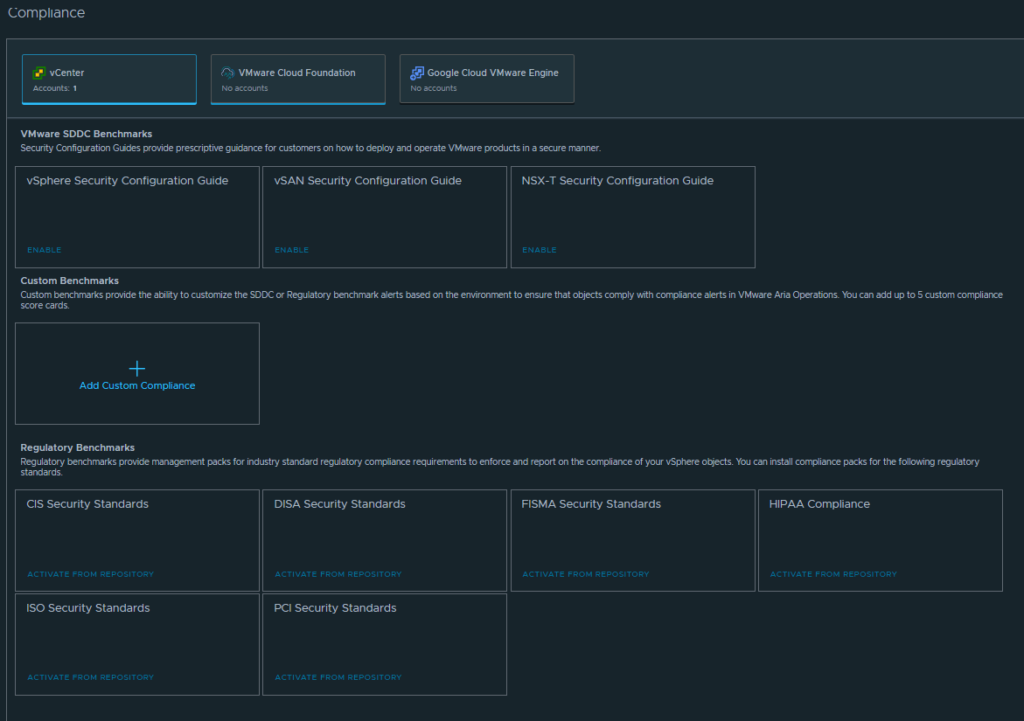
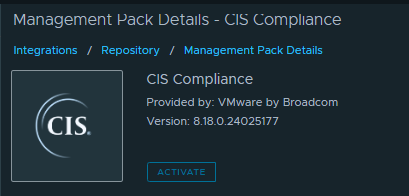
Looking at ISO/CIS, we can click the activate from repository
Then install
Then click yes
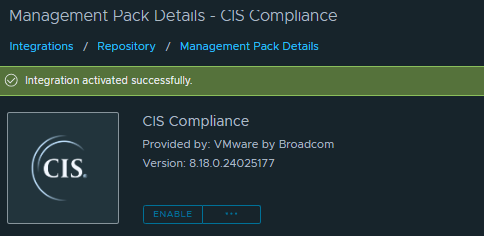
Once installed we can then click enable
We can then repeat for the ISO standards
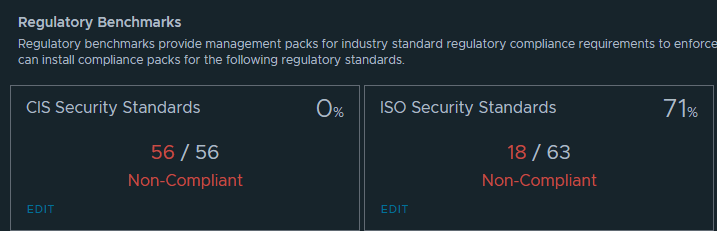
Now we can see how our compliance looks like back in the Operations/Compliance menu
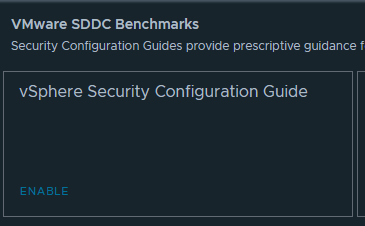
We can also enable the vSphere Security benchmark at the top for an extra baseline, and clicking enable
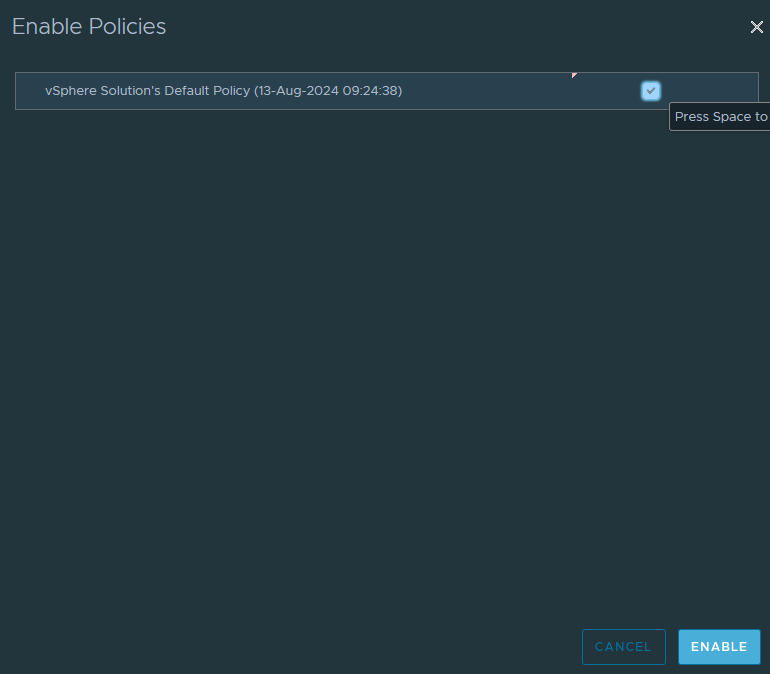
Select the policy and hit enable
It will run an assessment
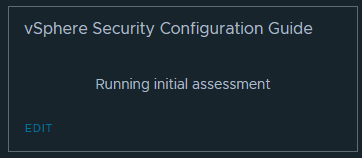
After a while, that will complete
You can click any of the security tabs there to open the guide which will show you where the compliance is failing
For example
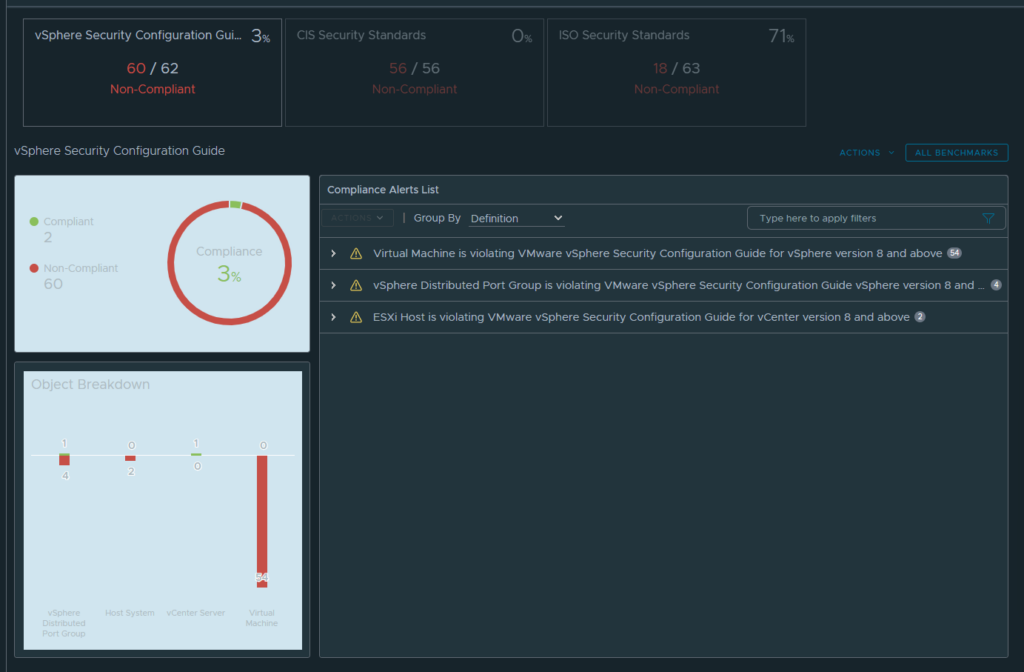
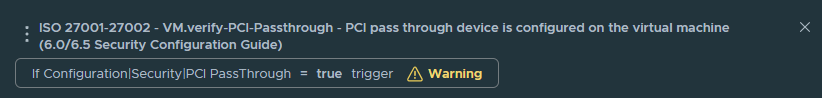
One thing to note, is both vSphere compliance and ISO flag PCIe passthrough as non complaint, but its not exactly an issue either, so its not perfect overall
With ISO, its more a set of considerations you should consider, rather than a black and white list of what you should and shouldnt have set, or at least that is how it was explained to me by someone who has to management organisation compliance
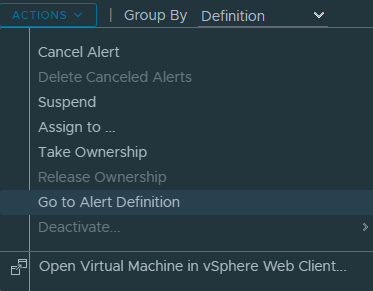
If you find something like this you wont want to count, you can suspend it by selecting the alert, for example, the PCIe passthrough on my TrueNas server
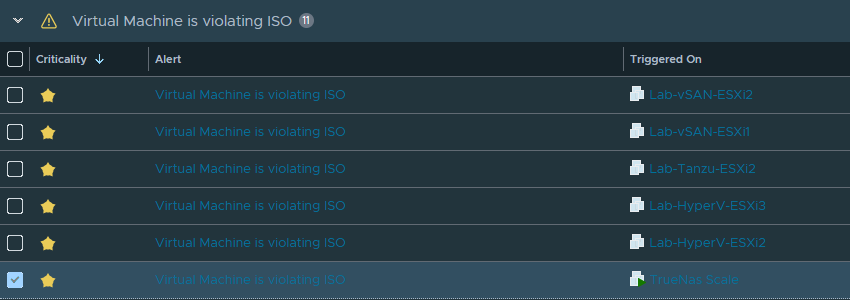
And clicking Go To Alarm Definition
Select the definition here
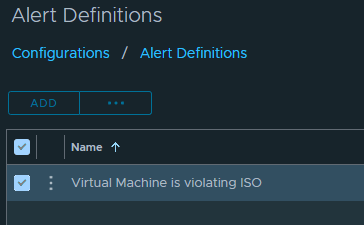
And click the three dots, and edit, the same way we with alerts you want to remove permanently
I removed this from the alerts on this VM for ISO, CIS and vSphere as its not really a security violation
3.2.7 – Dashboards
3.2.7.1 – Overview
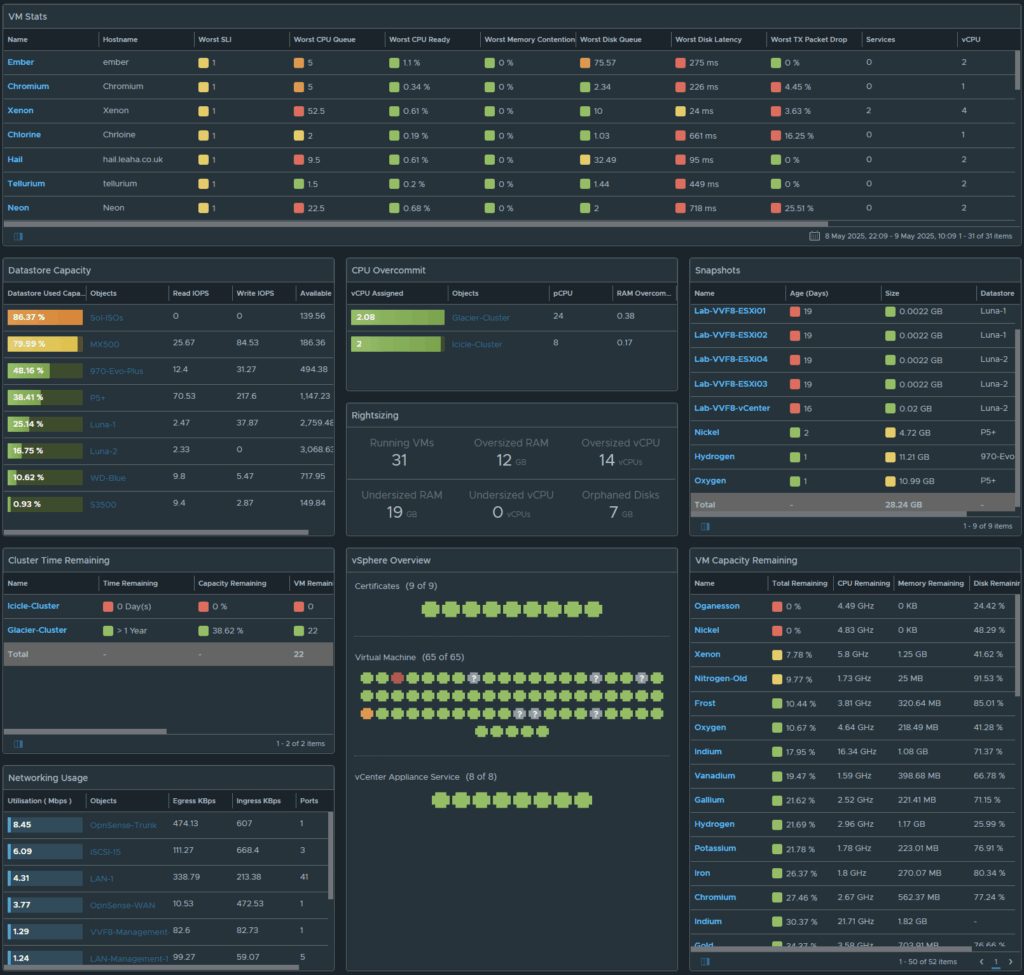
I found the in-built dashboards to be very lacking in what they offer, usually needing me to check multiple dashboards to get some info with a lot of useless bit mixed in, so, as you can create your own dashboard from the 100s of metrics, thats what we are looking at here
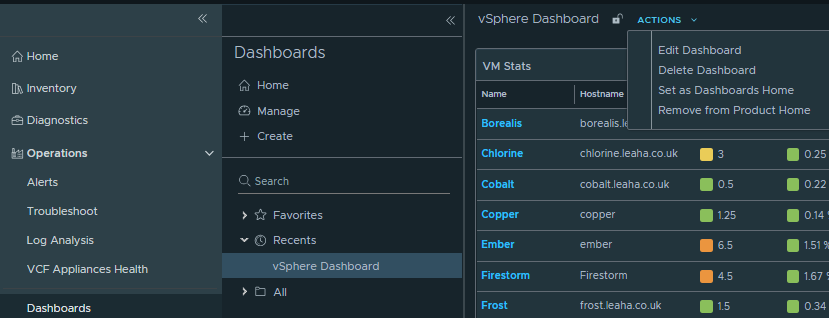
You can add a custom dashboard from Operations/Dashboards/Create
From there you can add all sorted, we will go through an example of some basic vSphere bits for a vSphere Dashboard
You can name this from the top right

And you can favourite this to add it to the home page on the top right with the house icon

After configuring the below, I ended up with this, there is room for more widgets, and you can move everything around from the top bar, or resize from the bottom right of each widget in the edit menu
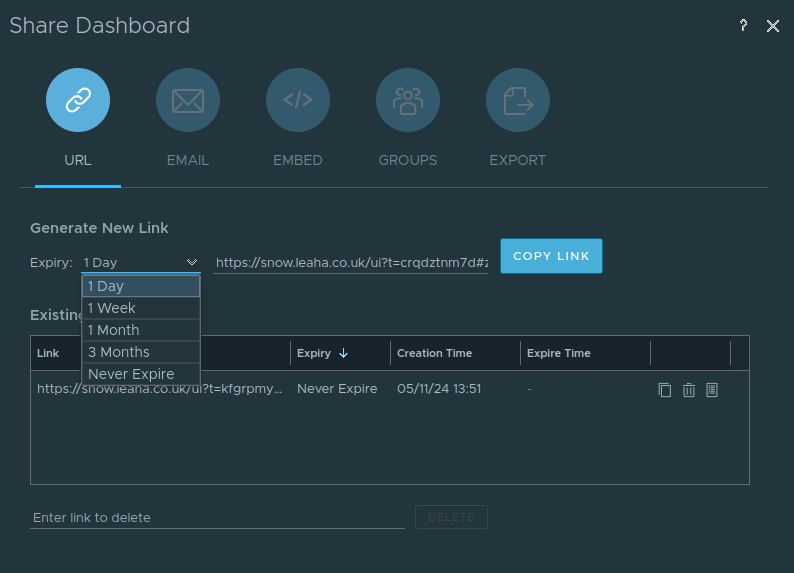
You can then also make it viewable to anyone in your department by sharing it with the right icon on the right of the dashboard with the favourite/home button

You can then copy the link and set an expiry, for example, you might select never if you want this available for the department to view, but without giving permissions to Aria
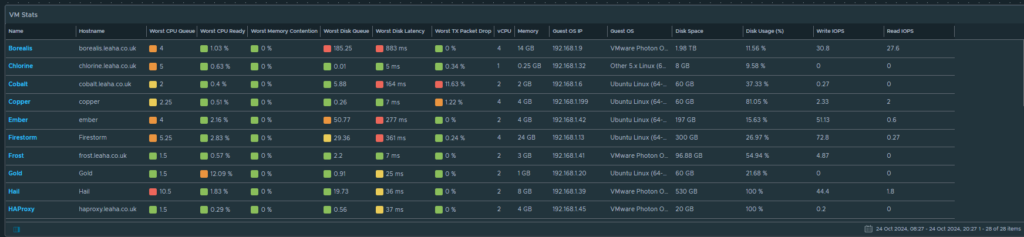
3.2.7.2 – VM Monitoring Widget
Edit your dashboard by clicking into Operations/Dashboards then selecting your dashboard, then Actions and Edit

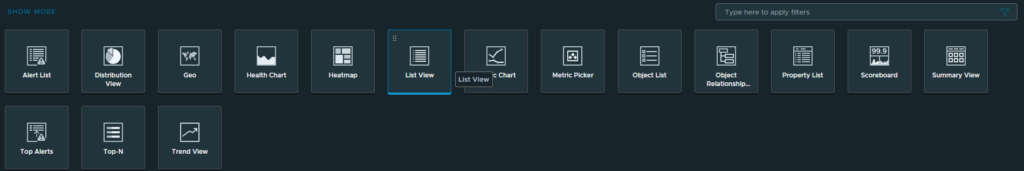
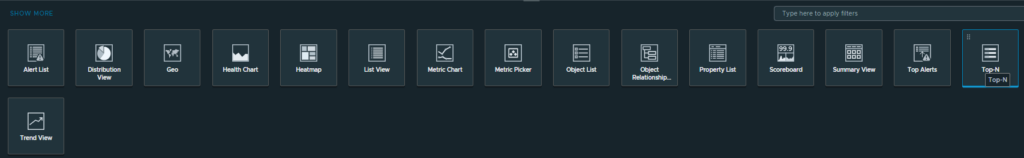
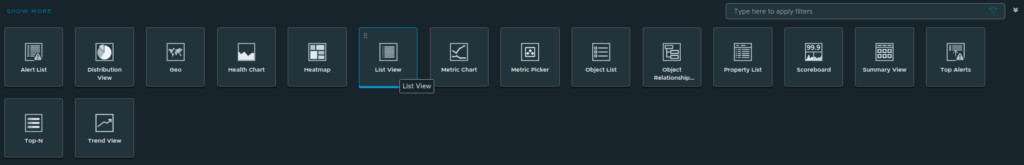
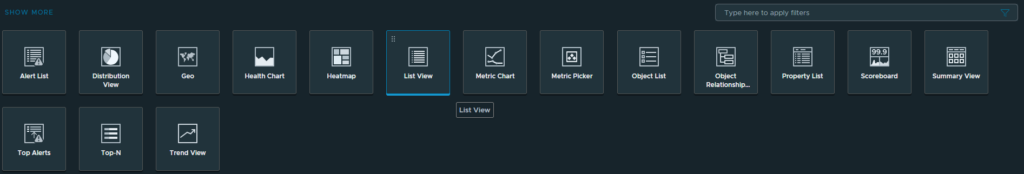
From the bottom lets drag a list view onto the canvas
We can re size it from the bottom right and edit it with the pencil
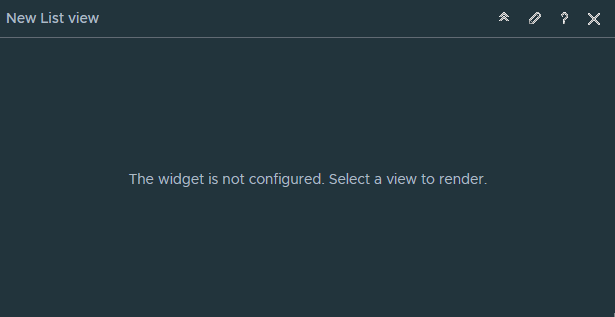
So, I want a widget for my VM stats so I can see VM usage and info, I want this to be wise, so I will grab it over to the right and down then click the pencil on the top right of the widget to edit it, as its currently blank
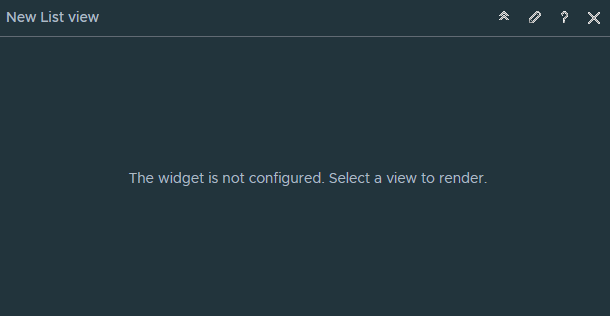
Lets rename the widget and change refresh to On and self provider to On
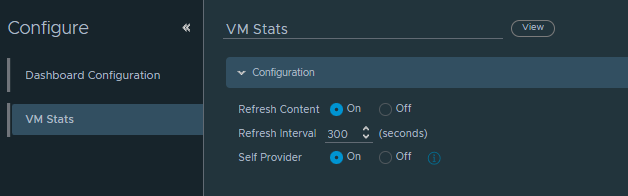
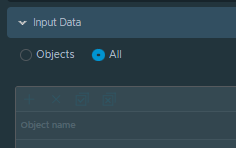
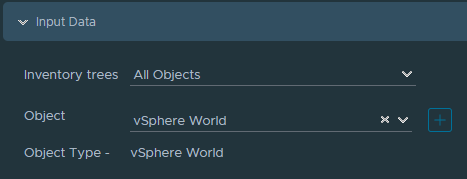
Then click configuration to collapse it, which should auto expand input data
Lets click the plus to add a data object
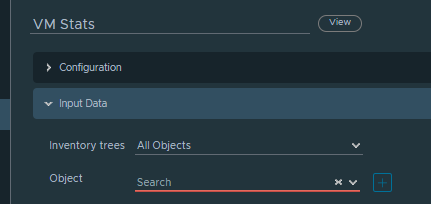
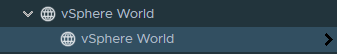
Expand vCenter
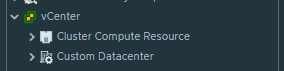
And select vSphere World

Then ok and it should be added
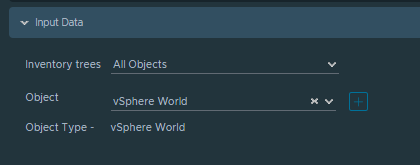
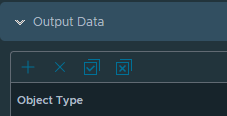
And click the Input Data tab to collapse it bringing up output data
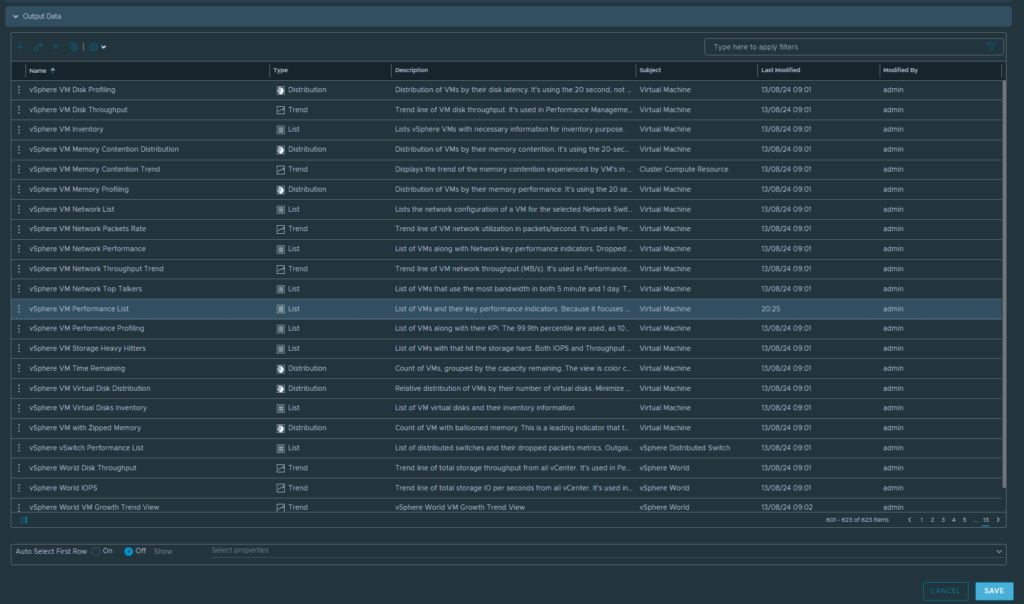
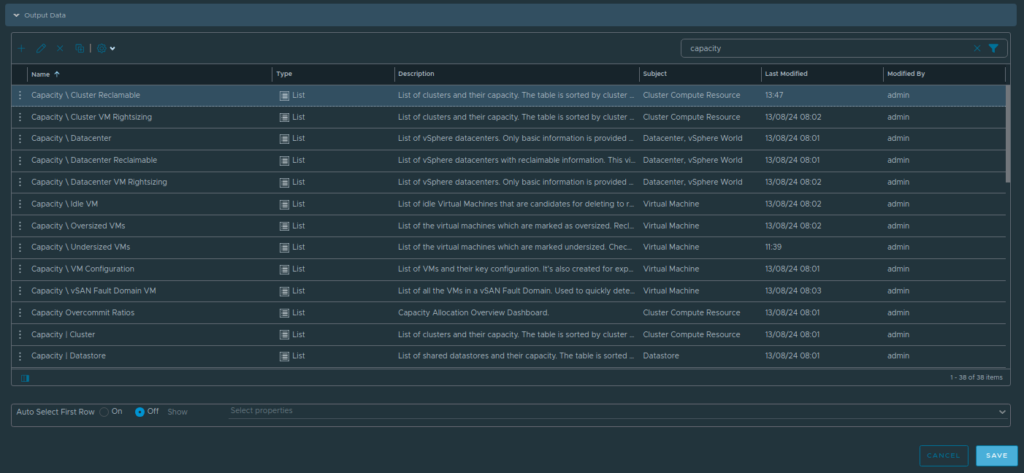
There are lots of objects here
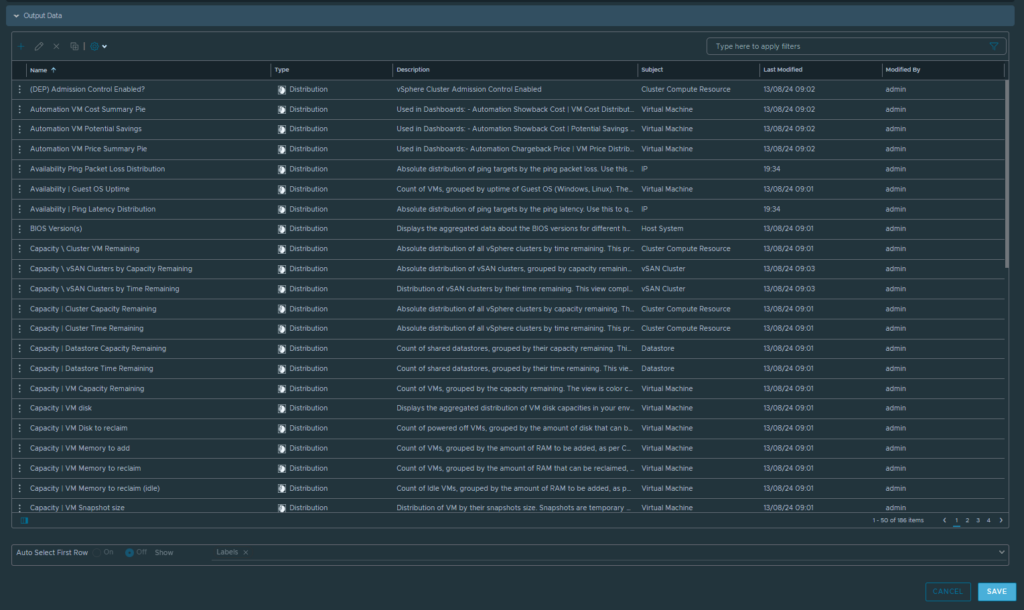
Lets scroll to the end page and click to enable VM performance list

Then hit save in the bottom right
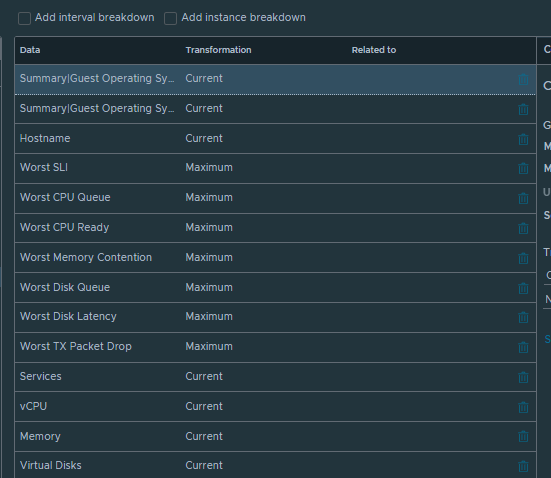
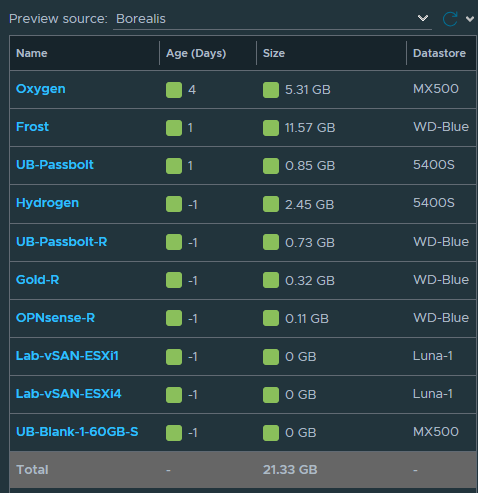
We then get an output like so where we can see the VM and hostname, CPU ready, memory contention disk and network stats

Ok, thats a good start, but I want disk usage and OS type in there too, to add more fields, edit the Widget and under Output data, click the 3 dots on VM Performance List and click edit
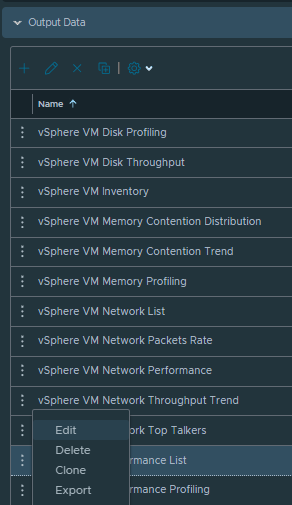
Under the data section I can now add new fields and re arrange things by dragging the data fields
I can search OS to find the OS type and IP to add
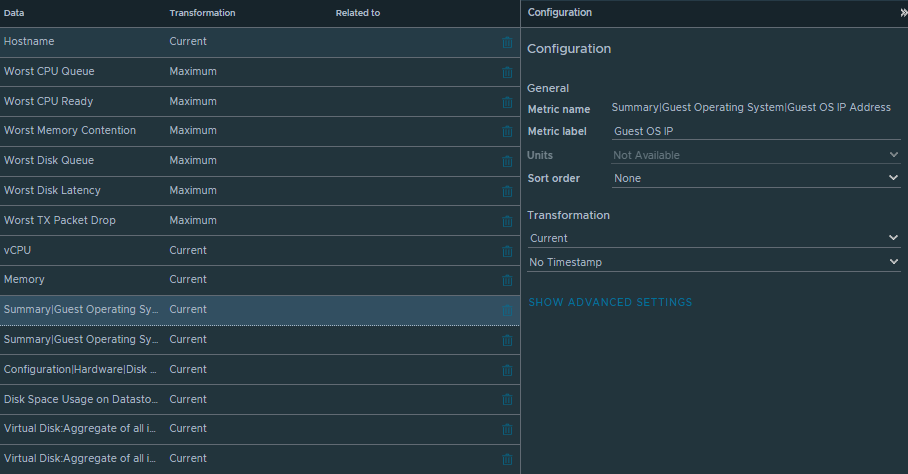
This is under Properties/Summary/Guest Operating System
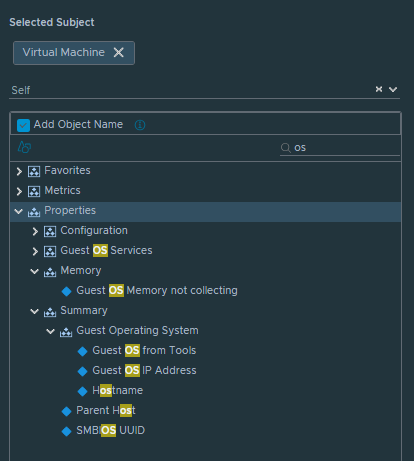
And to add them to the widget, I can drag them to the data section in the middle
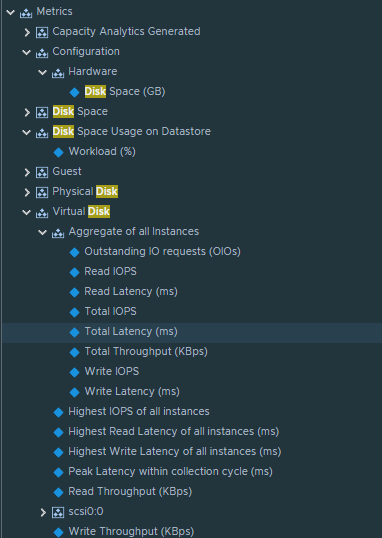
I can add read/write IOPS from Metrics/Virtual Disk/Aggregate Of All instances
I can disk usage % from Metrics/Disk Space Usage On Datastore/Workload %
I can also add configured vDisk size from Metrics/Configuration/Disk Space (GB)
I can also click into the metrics I have added to change the label name, as the default for this, the Metric Name, isnt very helpful
After adding those and removing some bits, I can hit update in the bottom left

Then save from here
Now my dashboard looks something like this
3.2.7.3 – Datastore Widget
Edit your dashboard by clicking into Operations/Dashboards then selecting your dashboard, then Actions and Edit
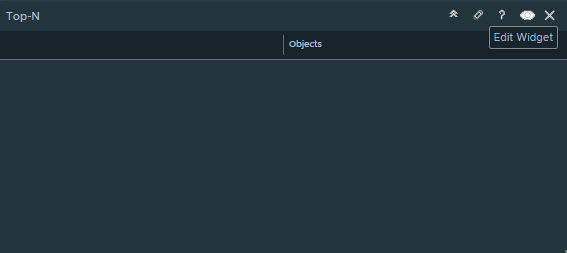
Drag a Top-N graph to the dashboard
Click the pencil to edit it

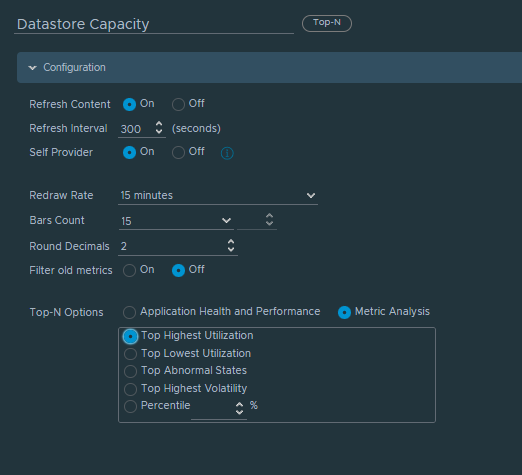
For the configuration tab, we are going to want to change the following
- Give it a name at the top
- Refresh content to yes
- Self provider to yes
- Bars count to user defined and enter a number larger than the number of datastores, if you dont have enough datastores it wont add the bars in and we dont want any left off
- Change round decimals to what ever you like, I prefer 2
- Change Top-N Options to Metric Analysis
- And then select top highest utilisation
It should look like this
Now open up the Input Data tab, make sure this is set to all
Open up the Output Data tab and click the plus to add an object
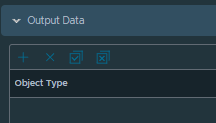
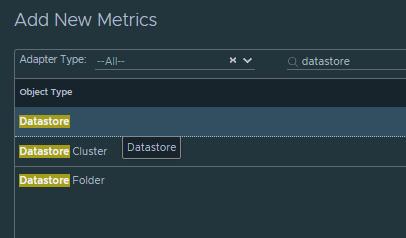
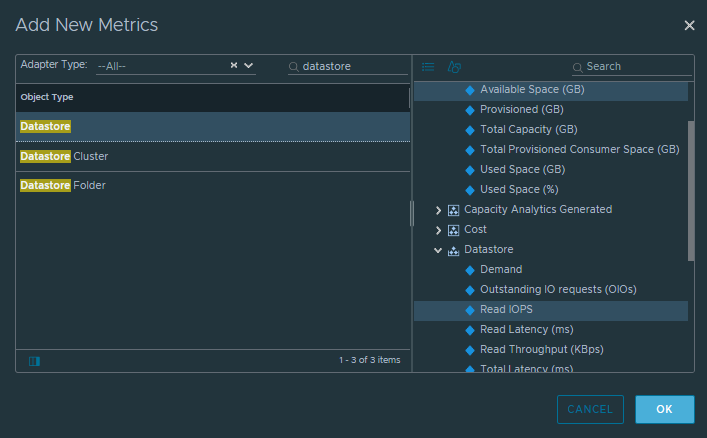
Search for datastore, and add the object called ‘Datastore’ by clicking it, then ok
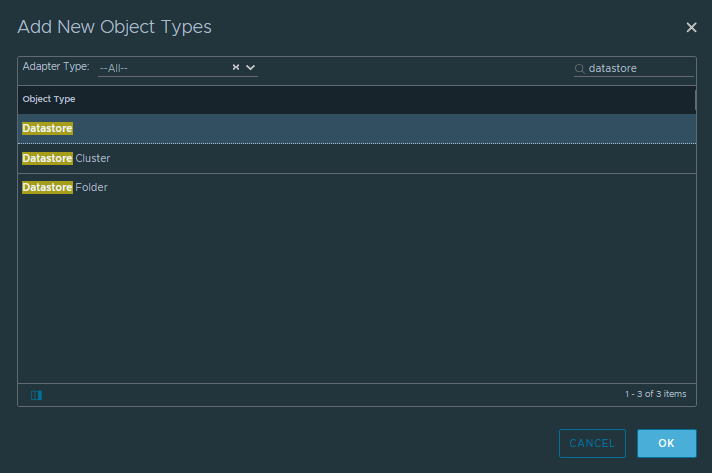
Click the metric drop down, and expand Capacity and select ‘Used Space (%)’ by double clicking it
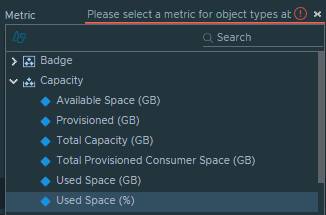
Add a Label, this can be what ever you want
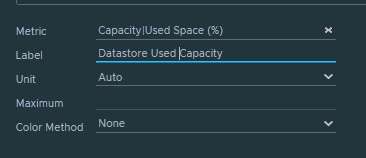
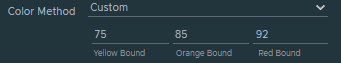
At the bottom we then want to edit colour Method, this will apply a colour depending on capacity levels, set this to custom, then add Yellow, Orange and Red colour bounds to fit your environment, this is what I settled on for my environment
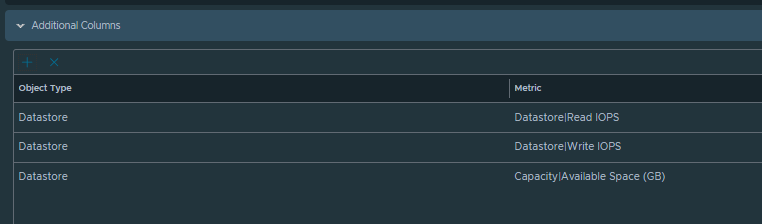
Then expand ‘Additional Columns’ and click the plus sign to add a column
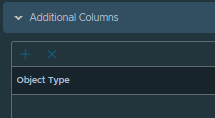
Again, filter by datastore and select ‘Datastore’
Excpand Metrics/Datastore, then hold control and click Read IOPS and Write IOPS
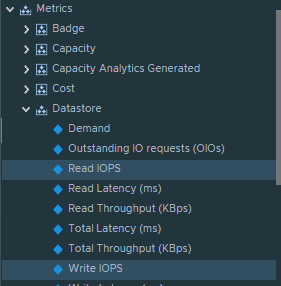
Expand Metrics/Capacity and hold control again and select Available Space
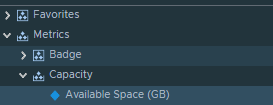
Then click ok
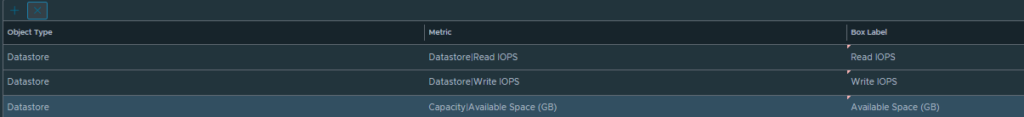
This will add all three metrics as extra columns for more data
We can then double click the first entry to edit fields, the default name on the widget is the metric, and this isnt very helpful, so we can type in the Box label to make it more readable, then click update

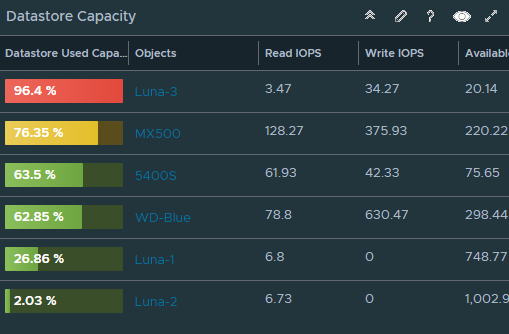
Then repeat for the remaining objects so you get something like this
Then click save in the bottom right
From the dashboard menu you can resize the widget from the bottom right
Then end result should look something like this
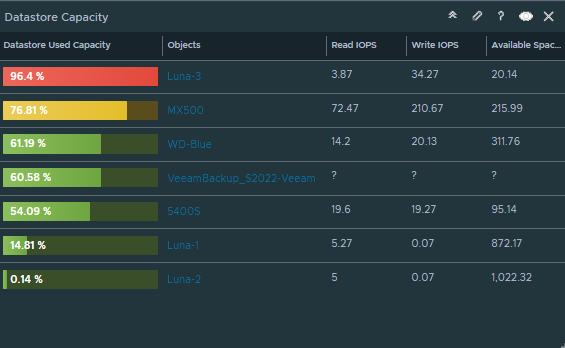
There is only one issue with the widget that would make it a little better, the Veeam Datastore, it just the C Drive of the VBR server used for mounting disks in restores and backups, its not really something I want to monitor, so lets exclude it from this widget
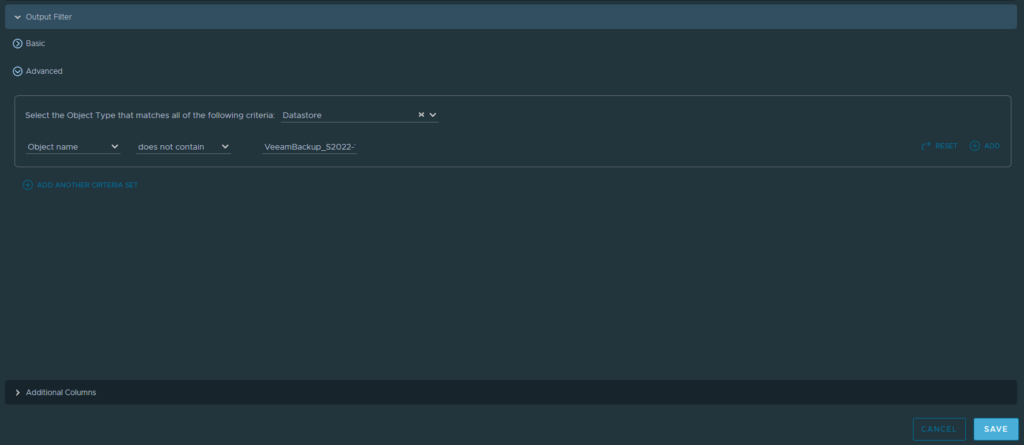
Click the pencil to edit the widget and head to Output Filter and click Advanced at the bottom to expand it
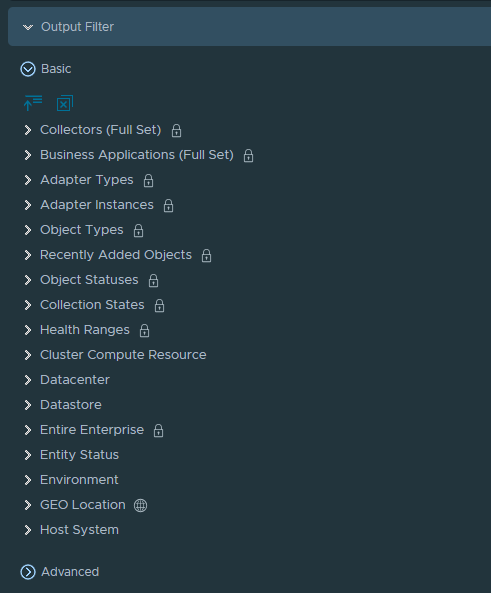
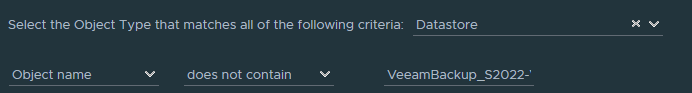
Under criteria at the top, search for Datastore and select the entry ‘Datastore’
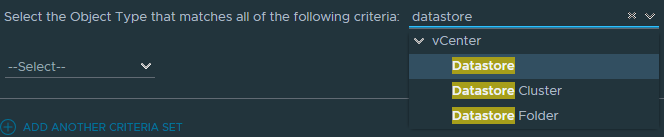
Then we can set the left box to Object Name, and the middle to ‘does not contain’

For the right box, search for that Veeam datastore, you’ll see it listed, click it
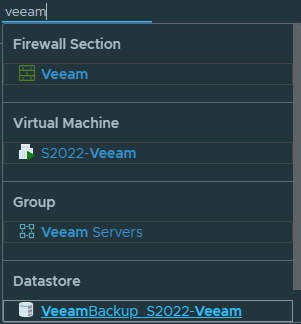
The filter should look like this
Click save in the bottom right
Now the Datastore is gone
3.2.7.4 – CPU Commit Widget
Edit your dashboard by clicking into Operations/Dashboards then selecting your dashboard, then Actions and Edit

Drag a Top-N graph to the dashboard

Click the pencil to edit it
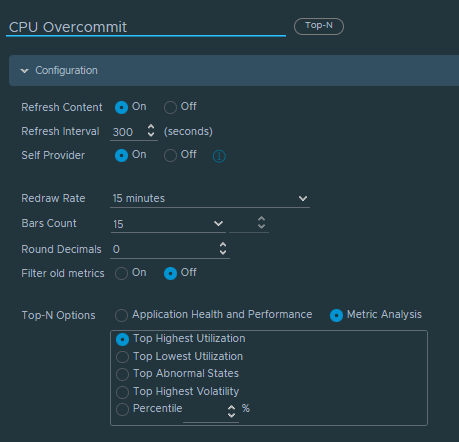
We need to set the following on the Configuration Page
- Give the widget a name
- Refresh count to on
- Self provider to on
- Bars count to 15, this allows more to be displayed as we add clusters, if there are less than 15 it draws only what it needs
- Under Top-N options set the radio button to Metric Analysis
- Then Top Highest Utilisation
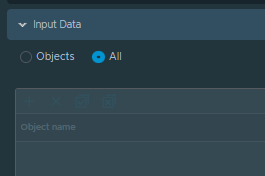
Keep Input Data as All
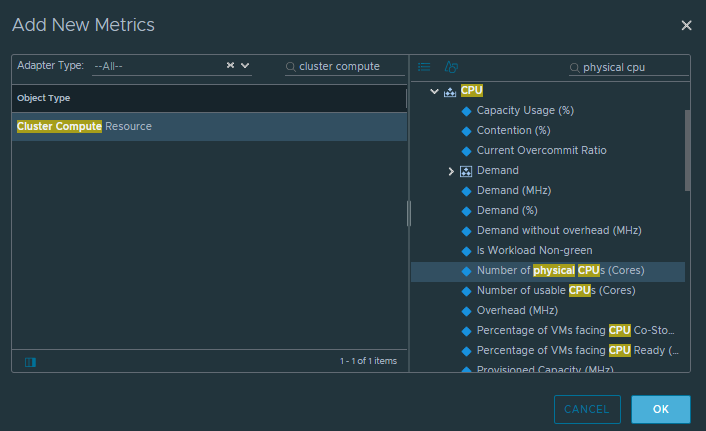
Under Object Type click the plus
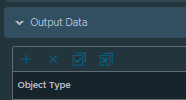
Then filter for Cluster Compute Resource, select it, and click
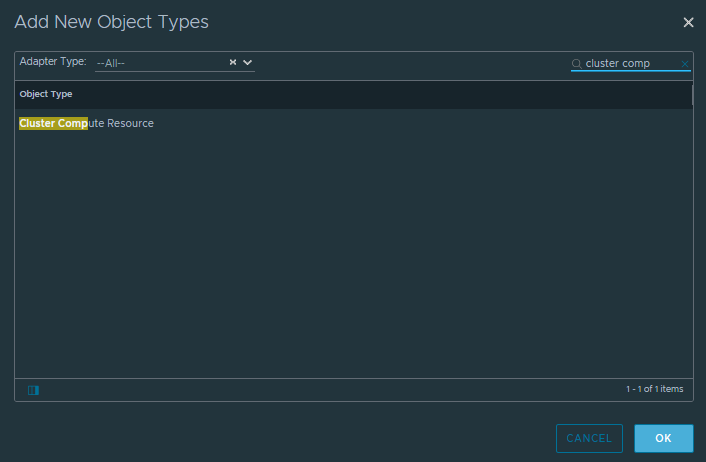
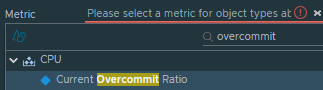
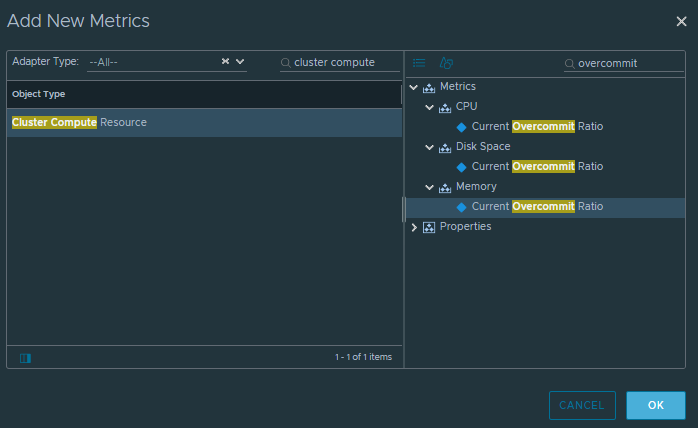
At the bottom, then click to select a metric and search for ‘Overcommit’ and double click CPU/Current Overcommit Ratio
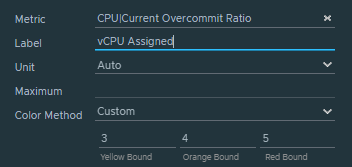
Add a label, and set colour method to custom and add figures, this depends on your environment, so its what you decide is acceptable, however general recommendation is not to go over 4vCPU:pCPU, so I would have 4 set at the orange or red and I wouldnt go higher
Lastly, under Additional Columns, click the plus to add some extra stats
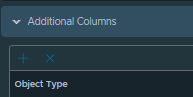
Filter for ‘Cluster Compute Resource’ and then filter for ‘Physical CPU’ and Add CPU/Number Of Physical CPU Cores
Also search for ‘Overcommit’ and select to add Memory/Current Overcommit Ratio
You can then double click the object to add a label, and click update to save, for each object

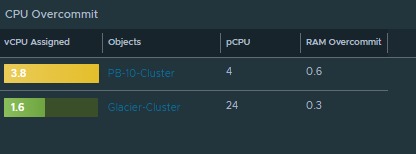
Eg

Now we have a nice widget to monitor the CPU overcommit status on a per cluster basis, per host wouldnt be much help as DRS will move VMs around as it needs if there is resource contention, and we also have the number of cores for reference and the RAM overcommit
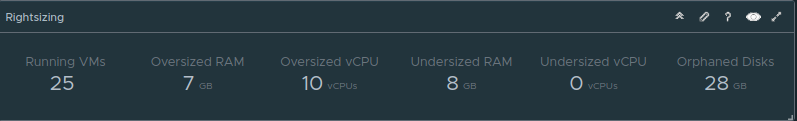
3.2.7.5 – Rightsizing Widget
Edit your dashboard by clicking into Operations/Dashboards then selecting your dashboard, then Actions and Edit

Click and drag a scoreboard to the canvas

We then want to changea few things on the Configuration tab
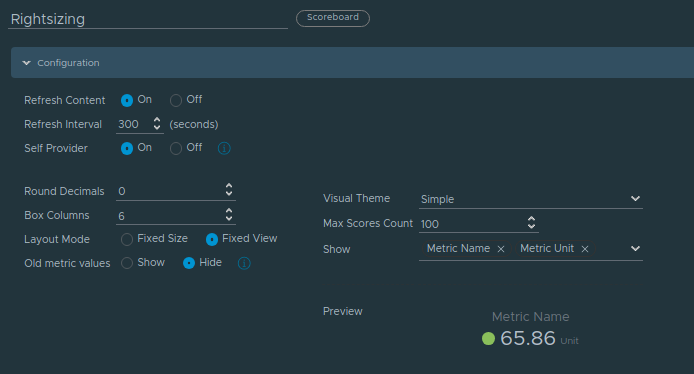
- First, name the widget, I opted for Rightsizing
- Refresh content should be on
- Self provider should be on
- Round decimals want to be what ever you want, the default is 0
- Box columns wants to be 6
- Visual theme, this you can pick whatever you prefer, I like simple
For Input Data make sure all is selected
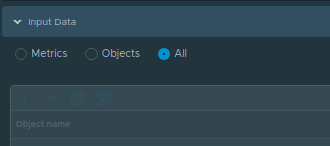
On Output Data click the Plus to add data objects

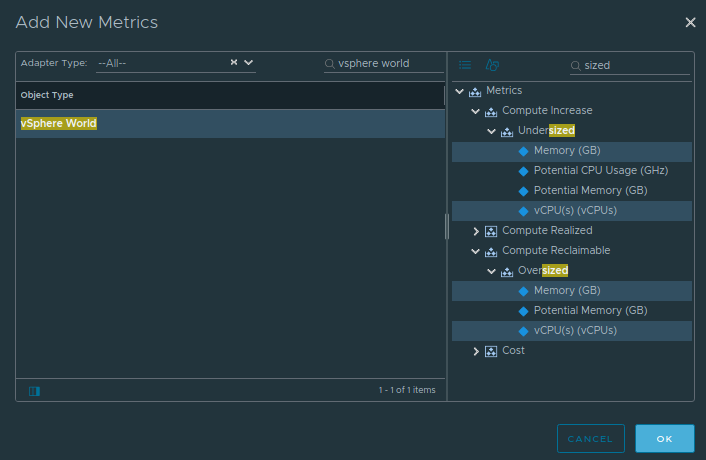
Search for ‘vSphere World’, select that, and then on the left menu search for ‘sized’
Then under Metrics//Compute Increase/Undersized, select ‘Memory (GB) and ’vCPU(s) (vCPUs)’
And under Metrics/Compute Reclaimable/Oversized, and select ‘Memory (GB)’ and ‘vCPU(s) (vCPUs)’
You can drag them to reorder them however you want
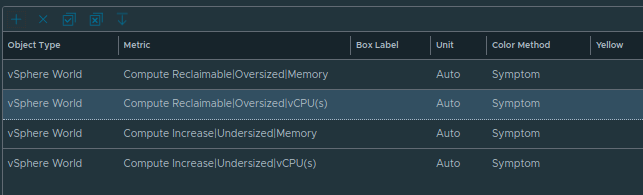
Then add, from vSphere World, Metrics/Summary/Number Of Running VMs

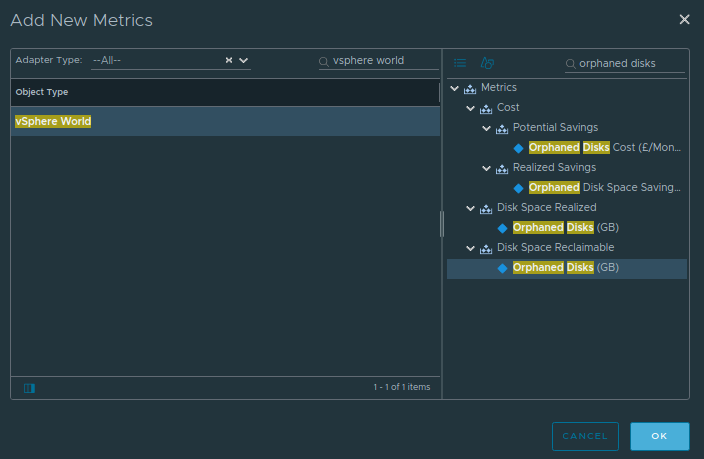
Lastly add Metrics/Disk Space Reclaimable/Orphaned Disks (GB)
You can then double click the objects to edit the Box Label, and for the disk capacity, I have changed it from Auto, to GB, to ensure its using GB
Then click update, and repeat for the box label for the rest of the VMs, I have also changed the memory objects to GB

With the end result looking like this

Then sit save, the widget should look like this
The only drawback is VMs you hide in the rightsizing section under Capacity/Rightsizing still show here with no way to exclude them
3.2.7.6 – Cluster Time Remaining Widget
Edit your dashboard by clicking into Operations/Dashboards then selecting your dashboard, then Actions and Edit

Click and drag a List View to the canvas
Edit it with the pencil

Under configuration, give it a name, and set self provider to on
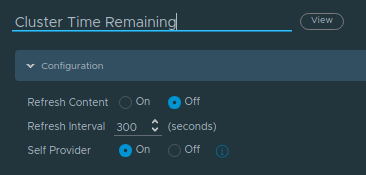
Then click configuration to collapse it, which should auto expand input data
Lets click the plus to add a data object

Expand vCenter

And select vSphere World
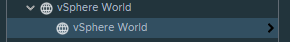
Then ok and it should be added

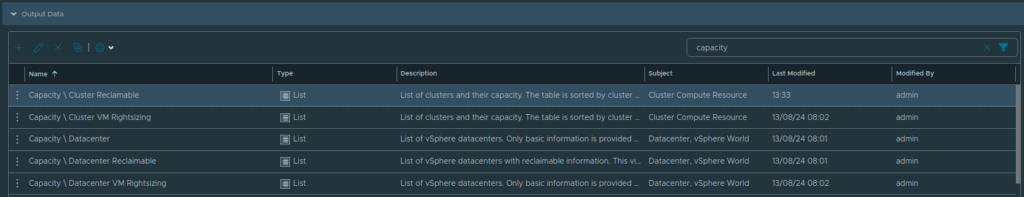
Under Output Data search for ‘Capacity’ and click to select the ‘Capacity \ Cluster Reclaimable’ object
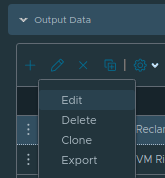
Then click the three dots on the left of the object and click edit
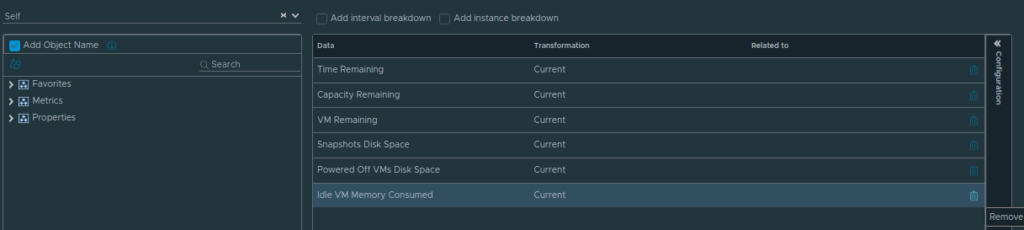
Click the data tab

Click the trashcan icon to remove Idle VM Memory Consulted, in the middle, on the right of the Data Point
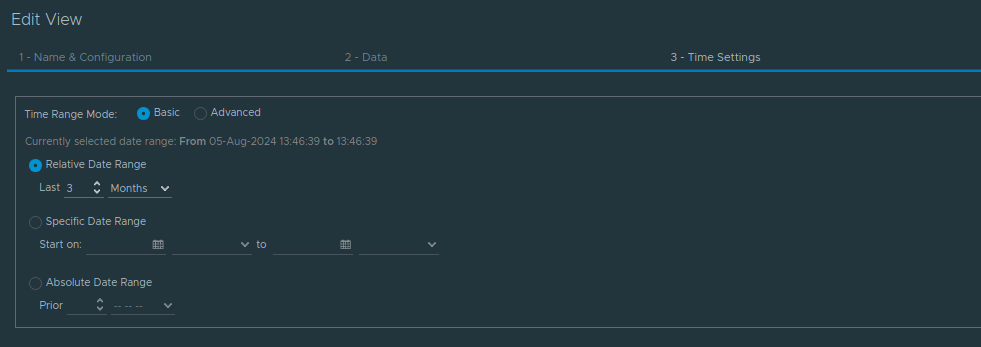
Under time settings, change the relative data range to the last 3 months, for a better estimate
Then click update on the bottom left

Then save in the bottom right
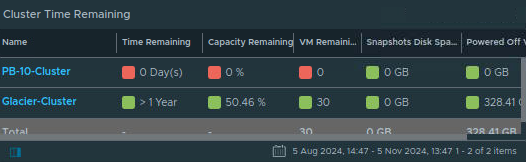
The widget should look something like this, allowing you to see the capacity left on a cluster and a rough time remaining allowing you to better plan for needing future resources
3.2.7.7 – Snapshot Age Widget
Edit your dashboard by clicking into Operations/Dashboards then selecting your dashboard, then Actions and Edit

Drag a List View graph to the dashboard
Click the pencil to edit it
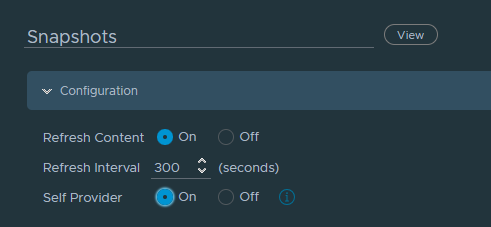
Under Configuration, give it a name, set Refresh Content to On, and Self provider to On
On Input Data click the plus to add an object on
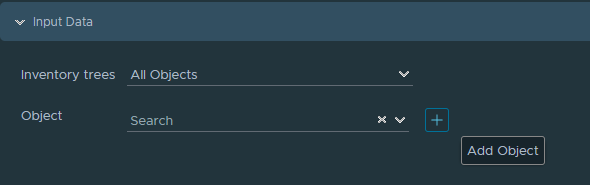
Expand the vCenter
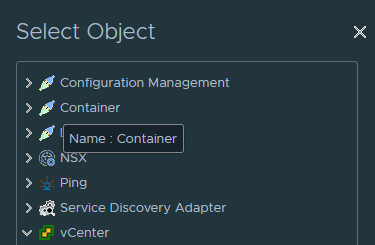
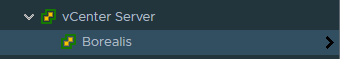
Expand the vCenter Server and select your vCenter
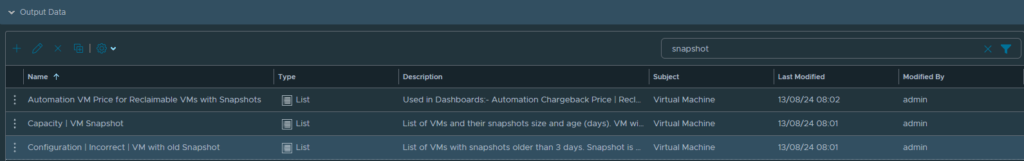
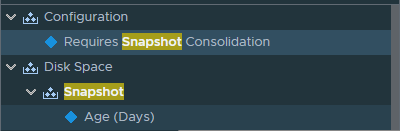
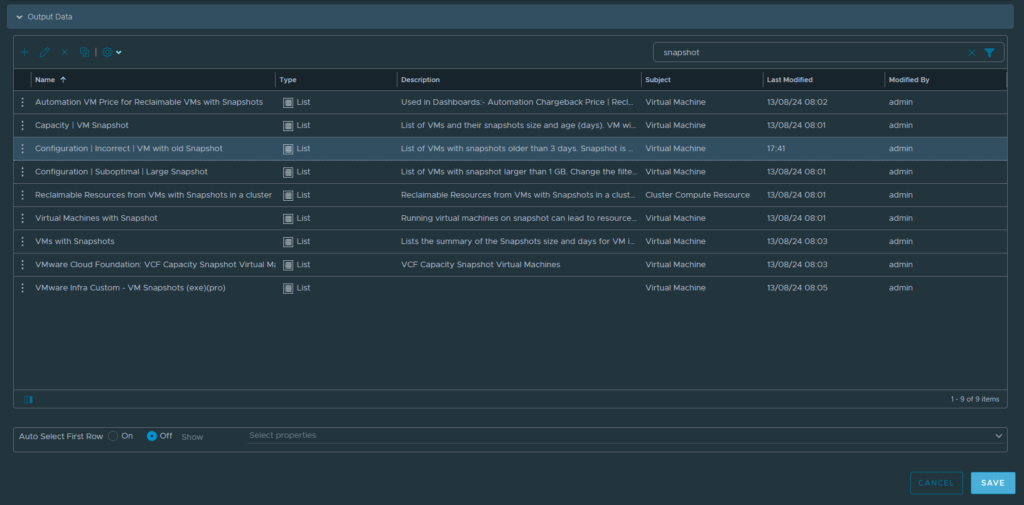
Under Output Data, search for Snapshot, and click to select the ‘Configuration | Incorrect | VM with old Snapshot’
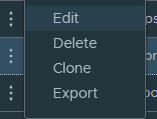
Then click Edit
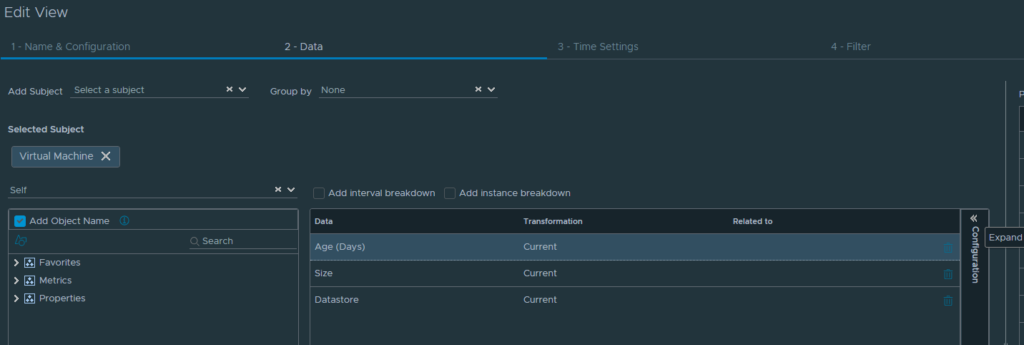
Click Section 2 – Data, then click the Age (Days) data point and click the little arrow on Configuration to expand the config
Click Show Advanced Settings
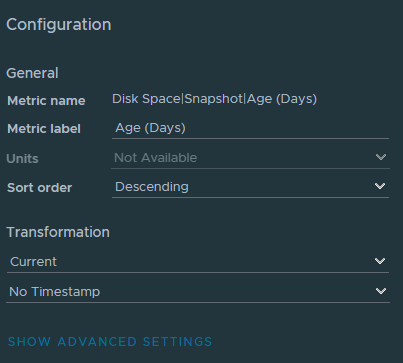
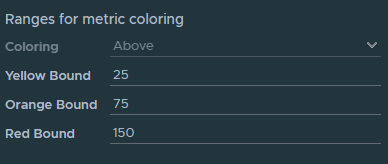
Here you can define the Yellow/Orange/Red boundaries, for this though, the default should be kept as the time frame shouldnt be exceeding 15 days
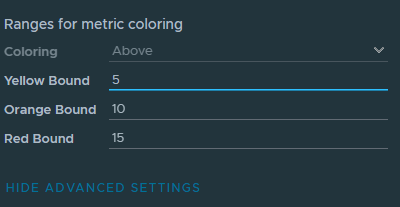
Repeat under size, this has yellow kick in for snapshots over 1GB, which is pretty low, and most snapshots will be over this, so you can change the figures to what works well in your environment, this is supplemental data, this is what I settled on
Its not a hard fast rule, in GB at least, that if over a certain size it should be removed, but the bigger the snapshot is, and depending a little on what the VM is, like SQL, this can be an issue, if you are in the TB range, you likely want to remove it ASAP, and the larger it is the more you’ll want to weigh up how much you need it
Its not a hard fast rule, in GB at least, that if over a certain size it should be removed, but the bigger the snapshot is, and depending a little on what the VM is, like SQL, this can be an issue, if you are in the TB range, you likely want to remove it ASAP, and the larger it is the more you’ll want to weigh up how much you need it
The size of snapshots, when including VM memory is largely dependent on the VM disk, this is the better way of doing it, but it leads to larger snapshots
Alternatively, you can remove all numbers from the Yellow/Orange/Red bounds to remove the colouring entirely
Now, at this point, you’ll likely have one large issue, it seems to miss report VMs with -1 snapshots, this isnt ideal
So move to section 4 – Filter, we can remove this from there, just click it at the top

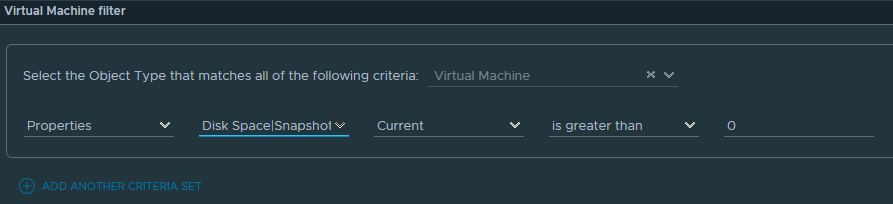
We can populate the blank filter here to remove entries that arent greater than 0, fixing this issue
Set the first bit to Properties
The second bit, type snapshot in and select Disk Space/Snapshot/Ages (Days) by clicking it
Keep the third box on Current
For the fourth, set it to ‘is greater than’
And for the fifth enter 0
It should look like this
On the left, if you click refresh
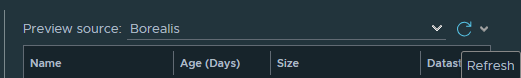
This has filtered those VMs out, if you had them, even if you dont, you’ll want to set this up
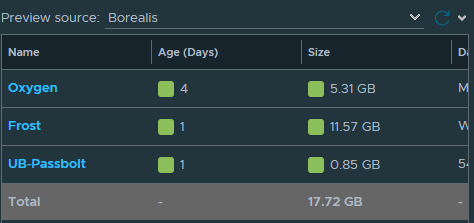
At the bottom we can then hit update

Then save in the bottom right
And we should get something like this

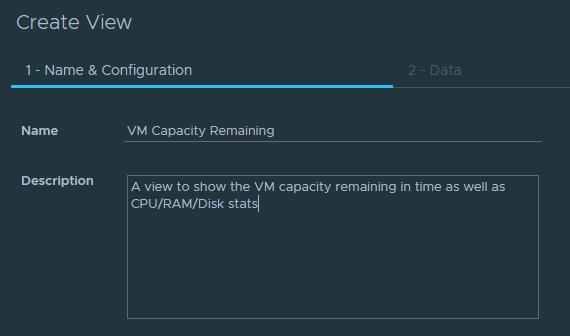
3.2.7.8 – VM Capacity Remaining
Edit your dashboard by clicking into Operations/Dashboards then selecting your dashboard, then Actions and Edit

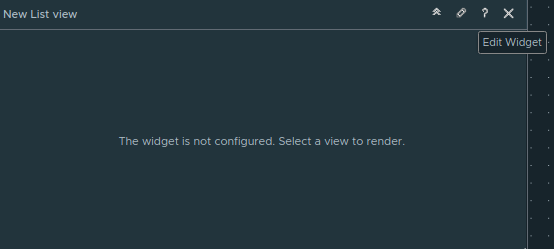
Click and drag a List View to the canvas

Edit it with the pencil
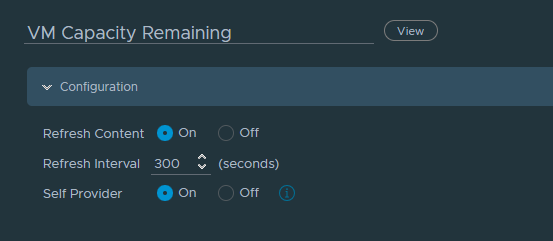
Give the view a name, and set Refresh Content to On and Self Provider to On
On Input Data, click the plus to add an object
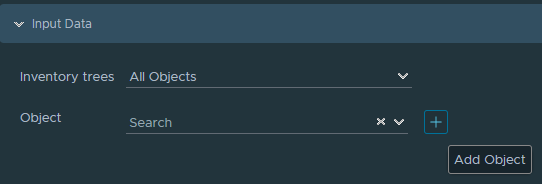
Expand your vCenter

Scroll to the bottom, expand vSphere World and select vSphere World, then hit ok
It should look like this
Under output data, we need to click the plus to add a new object
Give it a name and description, then hit nix at the bottom
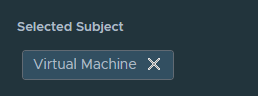
On section 2 click to add a subject and search for ‘Virtual Machine’ and add that

As we selected vSphere world before, it may be listed here, if so click the ‘x’ to remove it
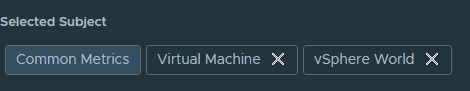
It should look like this
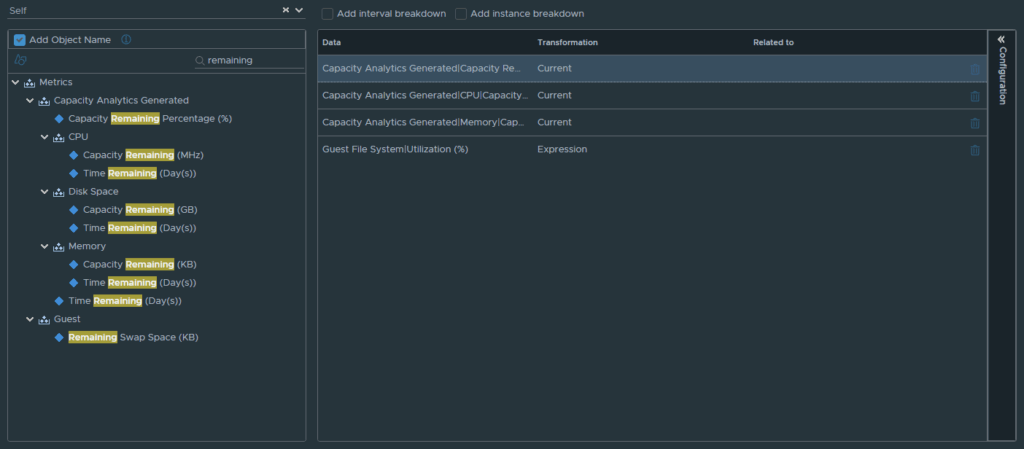
Now below, we need to add objects, search for ‘Remaining’ you should see something like this
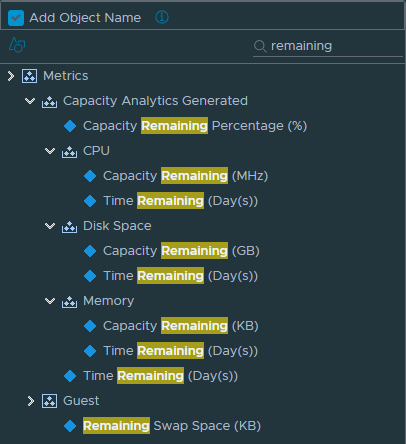
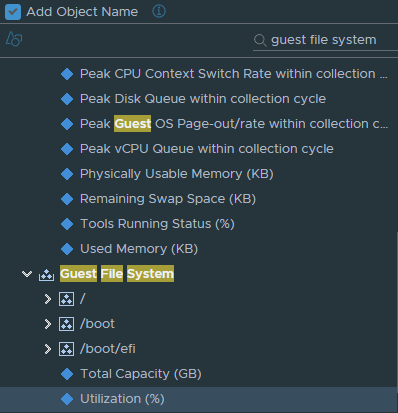
Then drag from the left, to the right in this order
- Guest File System/Utilisation %
- Memory/Capacity Remaining
- CPU/Capacity Remaining
- Capacity Analysis Generated/Capacity Remaining Percentage
The reason for this order is it will line them up with the last first and so on down the list, so the end chart has the capacity remaining percentage first, then CPU, memory and lastly disk, you can change this order if you want and drag to re order in the middle table
It will then look like this, you cna open/close the configuration tab with the double arrow at the top, shown in the right of the below screenshot
Now, you’ll need to open the config tab if its closed and select the top entry
Here we can add a Metric Label and set the Sort Order to Ascending, the click Show Advanced Settings
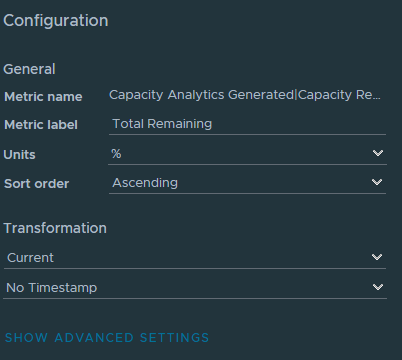
Then set the Yellow/Orange/Red thresholds, I opted for 10/6/3 for the capacity remaining percentage

For CPU capacity, add a label, you can add Yellow/Orange/Red bounds if you like, but I am added these columns for info, so I am not

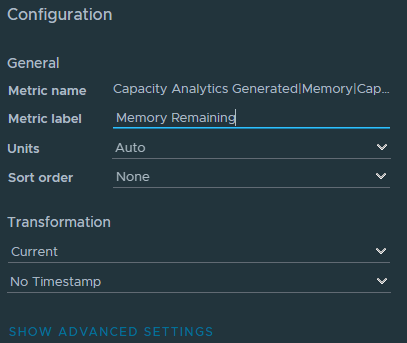
Repeat for memory remaining
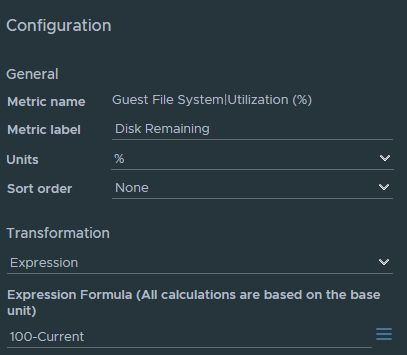
For disk remaining, we are going to do something a little different
Set the label to Disk Remaining, and change the unit to %
Under Transformation set this to Expression and for the formula set this to 100-Current
This will invert the default metric from % used to % free
This will apply to the main drive in a multi drive setup
Then click Create at the bottom

And save

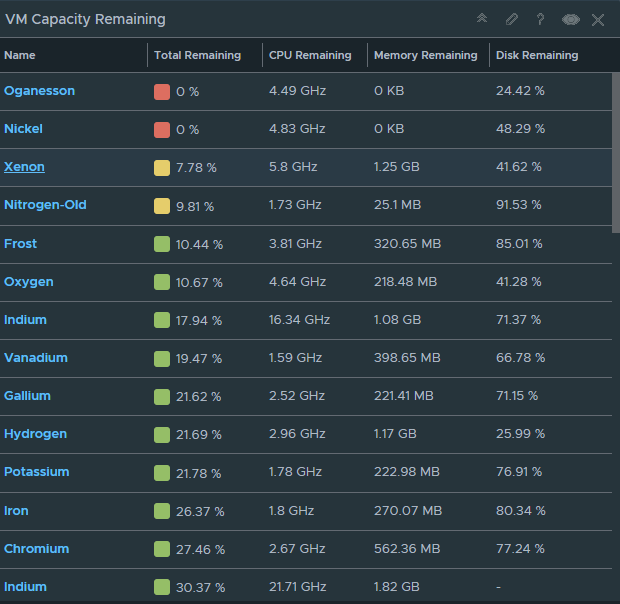
This should then look like this, letting you know if the VMs in most need of extra capacity
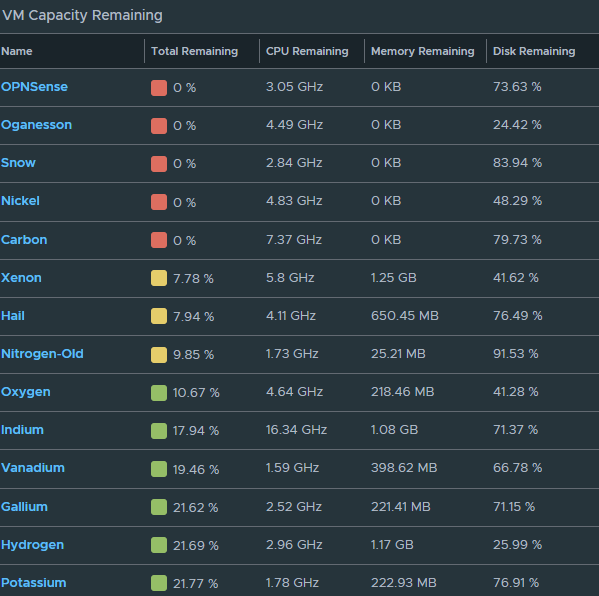
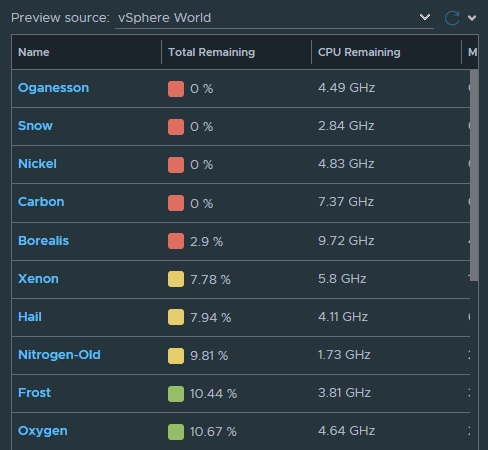
This only thing to bare in mind is this is not an exact science, for example, my TrueNas server, Carbon, has PCIe passthrough enabled, so VM memory is reserved, this causes it to have 0KB free, and for OPNsense, it has 2GB and is using ~500MB, it has plenty of capacity, but oddly Aria doesnt seem to think so, so your milage may vary
But most are pretty accurate, for example, my Veeam server could really do with more memory
So, we can address this issue, but do make sure you are 100% sure the VM flagged with zero capacity is fine and its a false flag, click the pencil on the widget to edit it and head to Output Data, scroll down and find the object we created earlier

Click the three dots and click edit
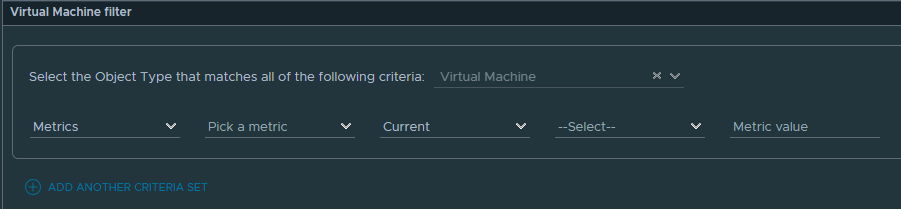
Click into section four, for filter, we can also see a preview on the right, so we can see if the filters to remove unwanted VMs are working
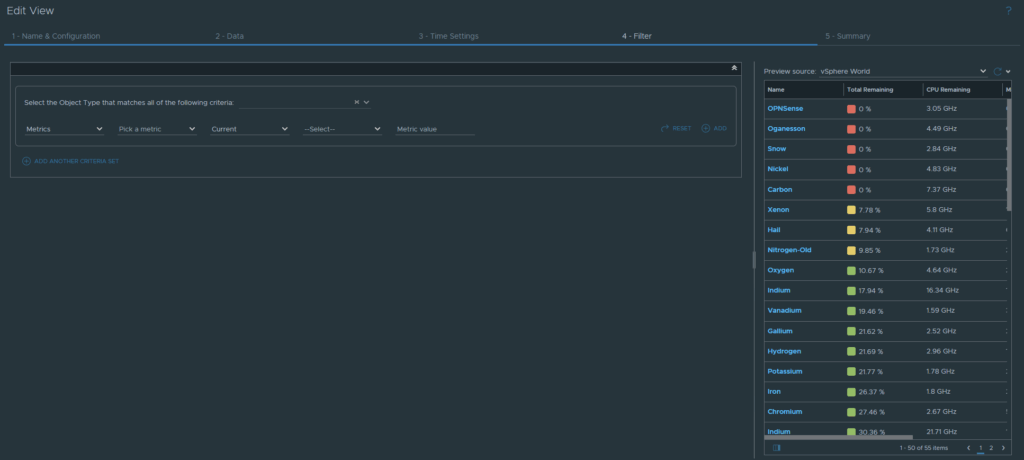
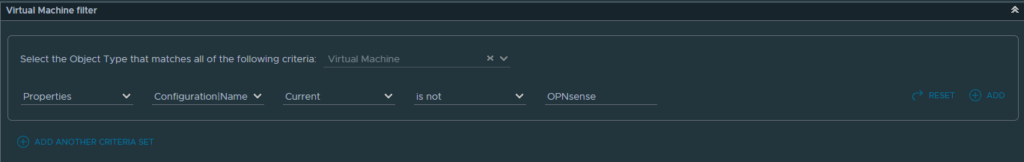
Set the first box to Properties, the second to Configuration/Name
The third box to Current, the fourth to Is Not, and the last box, search for your VM, in my case OPNsense

And if we refresh the chart on the right, with the refresh icon on the right of the preview, we can see OPNsense has been removed
You can click Add on the right of the criteria to remove more VMs in the same way, just dont click Add Another Criteria Set, as it wont work
I added my TrueNas server, Carbon, OPNsense, Firestorm, my NSX manager, Ember, my NSX Edge, Hail, Aria Logs, Snow, Aria Ops, and Borealis, my vCenter, the last few are appliances, so they are fine and I want to remove them
And we can see those are all completely gone from the widget preview on the right, so I can click Update at the bottom

The save on the bottom right
And the widget reflects this now
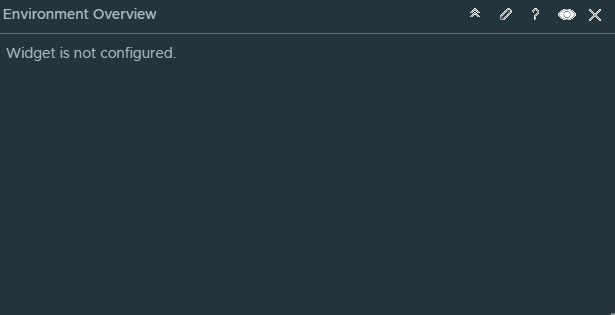
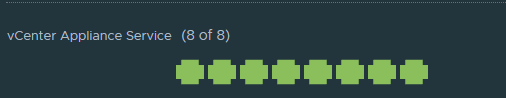
3.2.7.9 – Environment Overview/Certs
For this widget we will create one that shows the health of the all certificates, virtual machines, and vCenter services and a great glace at some key health metrics
Edit your dashboard by clicking into Operations/Dashboards then selecting your dashboard, then Actions and Edit

Click Show More
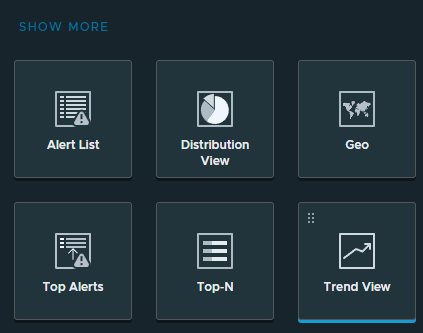
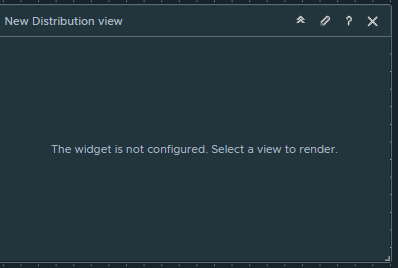
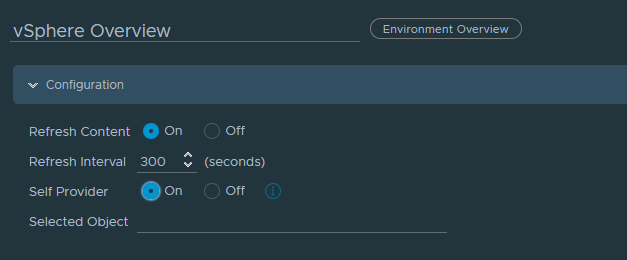
Scroll down and drag an Environment Overview into the dashboard and click the pencil to edit it
Give it a name, and set Refresh Content to On, and Self Provider to On
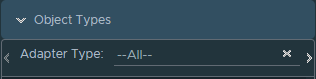
Under Input Data, Select Config, then expand the Advanced config menu, it should look like this

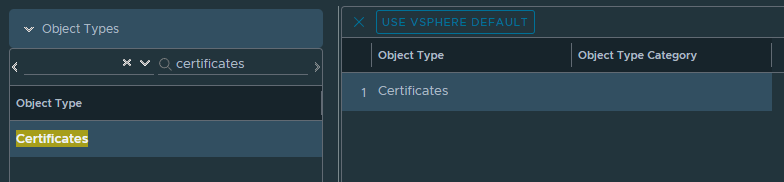
On Object Types, click the little arrow on the right
This should reveal the search bar
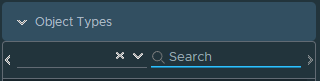
Search for ‘Certificates’ and double click it to add it to the middle box
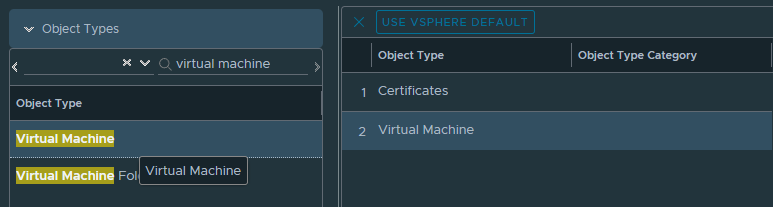
Then search for ‘Virtual Machine’ and double click to add that
Lastly, search for ‘vCenter Appliance Service’ and double click to add that
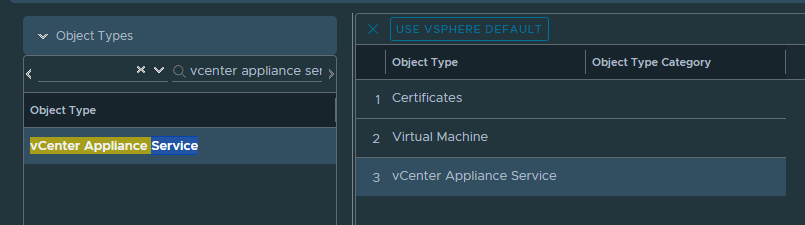
Now hit save in the bottom left

The widget should look like this
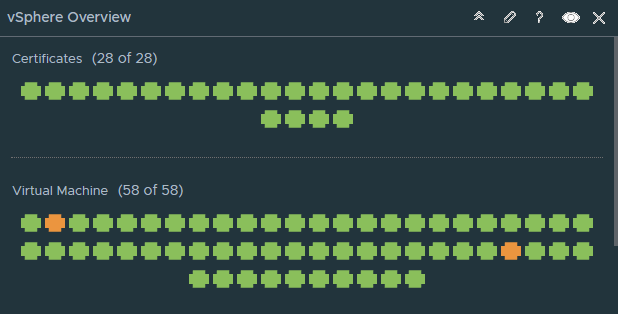
And you can scroll down for the vCenter services, or drag from the bottom right to make it taller/wider
You can also hover over an object, for example, one of the orange VMs I have to get info on whats not healthy, in this case, my VBR server
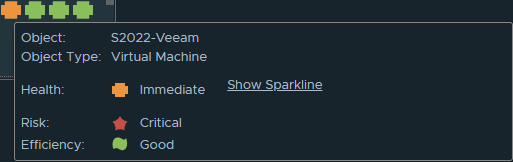
I can then look at alerts, or investigate it from the inventory to see why its unhealthy
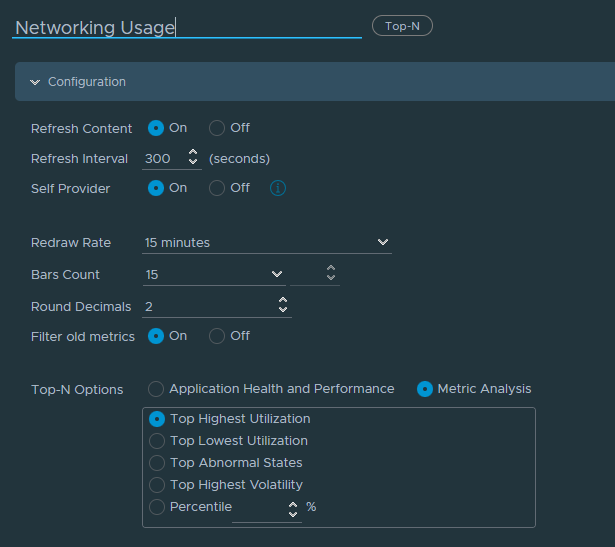
3.2.7.10 – Networking Widget
Edit your dashboard by clicking into Operations/Dashboards then selecting your dashboard, then Actions and Edit

Drag a Top-N graph to the dashboard

Click the pencil to edit it

Now we need to set the following
- Name the widget
- Refresh Content to On
- Self provider to On
- Redraw rate set to 15 Minutes
- Bars Count set to 15
- Round Decimals can be what ever you want, I chose two
- Filter Old Metrics, this must be On, else the data will consider old metrics and be inaccurate
- Top N Options wants to be Metric Analysis with Top Highest Utilisation
Make sure Input Data is set to All
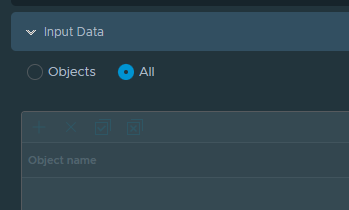
On Output Data click the Plus
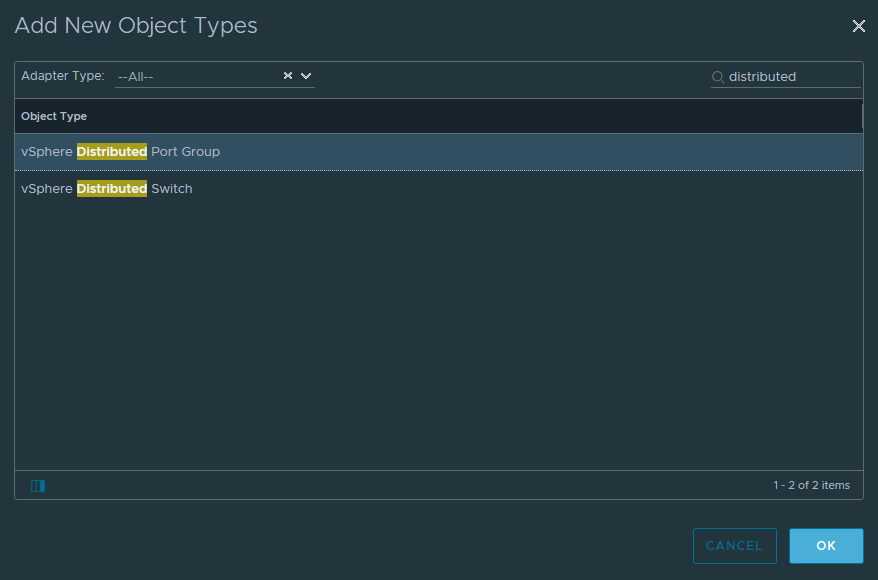
Search for ‘Distributed’ and click to select vSphere Distributed Port Group, and click ok
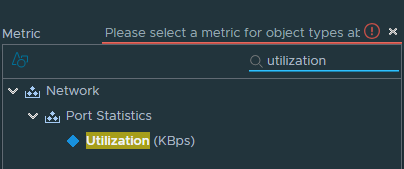
Click the drop down for Metric at the bottom and search for ‘Utilization’, and double click to add ’Utilization (KBps)
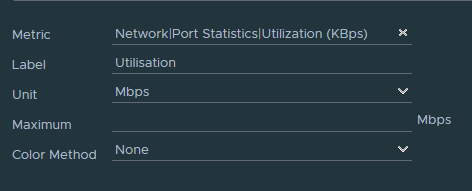
Add a Label so the metric is easier to read, and set the unit, this can be KBps, Mbps, MBps or Gbps and we are keeping colour on None, you can add thresholds for Red, Orange or Yellow if you wanted though
Then move to Additional Columns section, click the Plus to add some extra metrics
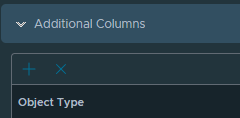
Search for ‘Switch’ and click ‘vSphere Distributed Switch’ on the left, then we can click onto Metrics/Networks/Port Statistics and select Egress traffic and Ingress Traffic, and lastly click Metrics/Summary/Used Number Of Ports, then click ok
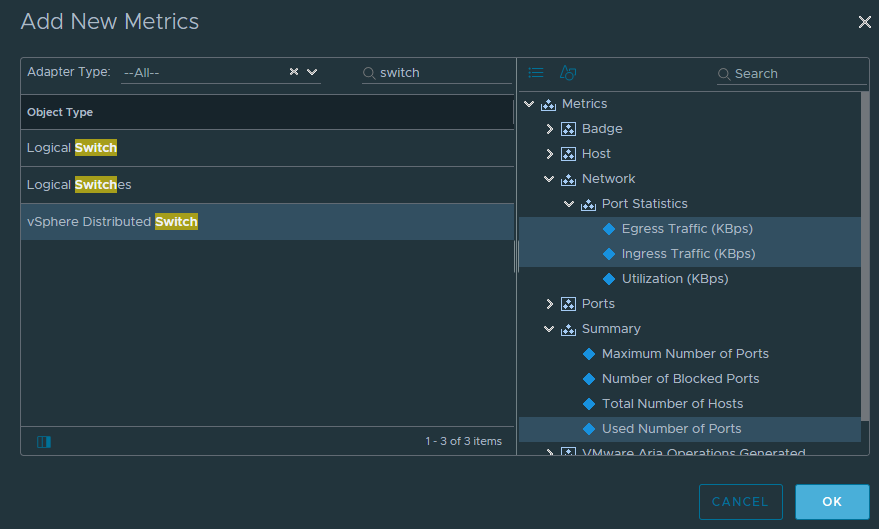
Now we can double click the added columns, to add a better label and click update

It should now look something like this, the labels make the widget much more readable
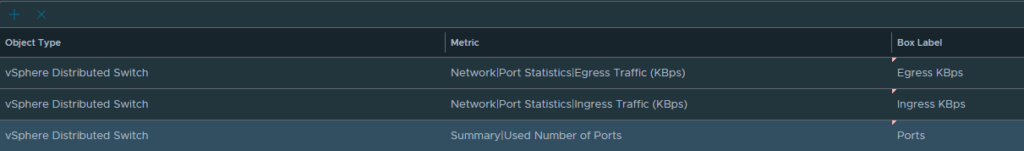
Then hit save in the bottom right
The finished widget should look something like this
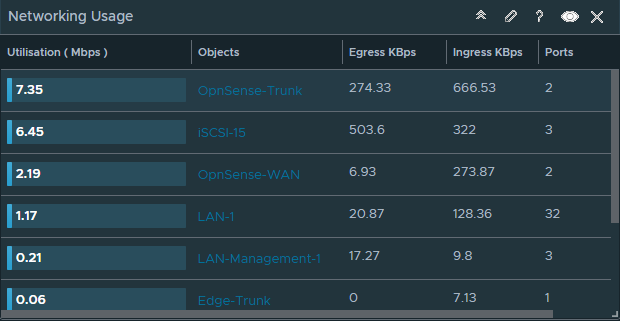
3.3 – Aria Suite Lifecycle
Lastly, for managing upgrades to the environment to make it a little simpler, is where Aria Suite Lifecycle comes in
This is a two stage process for adding the upgrade files, then upgrading the appliance
The below example will using Aria Automation and Aria Operations as upgrade candidates, as there is no new version for Aria Operations For Logs at the time of writing, with 8.18 being the latest, but the process is the same
3.3.1 – Downloading Patches
You can find these under Aria Universal on the Broadcom Portal
Expanding your subscription, for VVF this is standard, for VCF this is enterprise
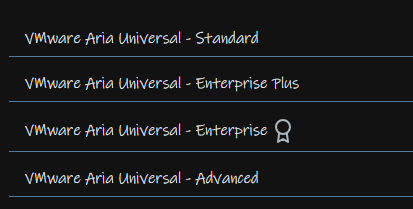
Selecting Subscription
Clicking view group for what you need, Aria Standard will have less shown here
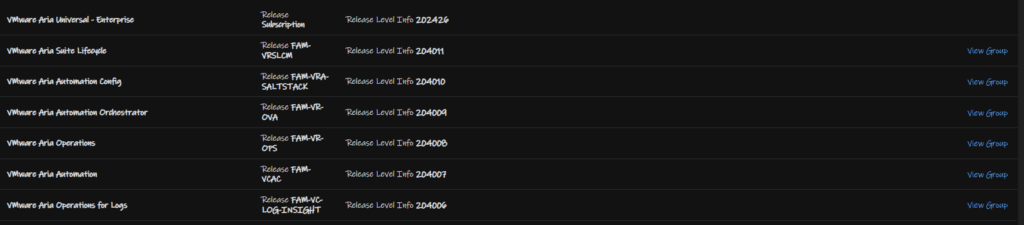
In this case for VVF, we will be using Aria Ops and Aria Logs
Aria Logs upgrade package is this
Aria Ops is this
Dont rename any of these as it causes issues with upgrades
3.3.2 – Adding The Service Pack
To upgrade the connected appliances you’ll first want to ensure Aria Suite Lifecycle is on the latest version, then you’ll need to get the latest service pack containing the latest versions of the latest software, the pack doesnt contain the upgrade files though, just an inventory for the lifecycle manager
You can get this here
If you arent sure what the latest pack is, the Aria Lifecycle release notes will help you
As an example, here is the notes for packs for 8.18 here
This shows us SP3 is the latest
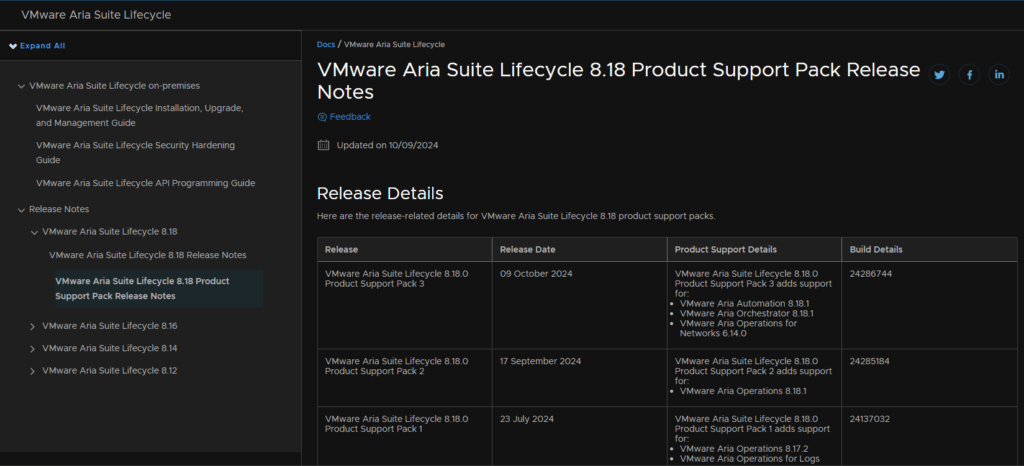
So on the Broadcom link, I will grab this

There will then be the download article, you will need to be signed in
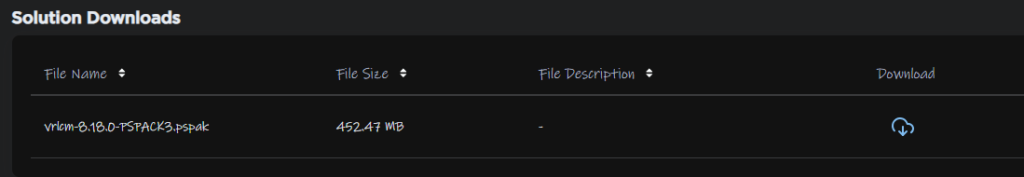
You’ll want to log into your Aria Suite Lifecyle instance on
https://fqdn
Or
https://ip-address
The default admin username is admin@local
And then head to Lifecycle Operations
Then head to Settings/Product Support Pack
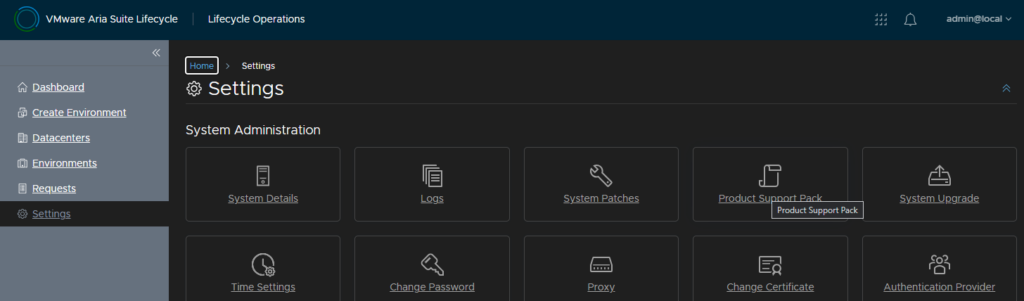
Here is where re can see all the versions, in this example, I have 8.18.0 for everything, Aria Suite LifeCycle hasnt got an update, but Aria Ops and Aria Logs both have 8.18.1 updates I want to apply
So this is what we grabbed that service pack for, so Aria Suite Lifecycle will pick these up, as it doesnt at the moment
Click Upload
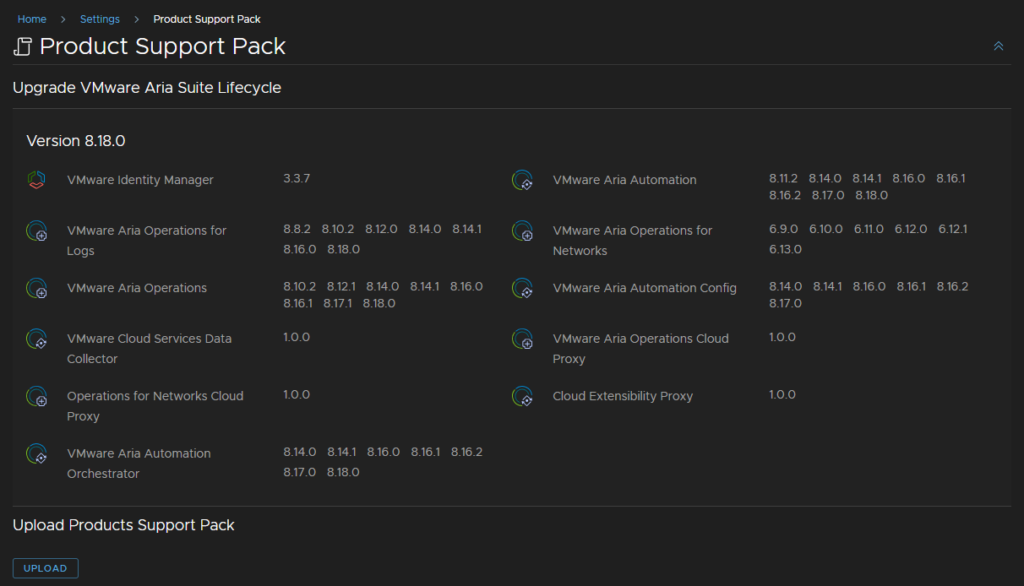
Click select file
Click the Service Pack you downloaded earlier, then click import
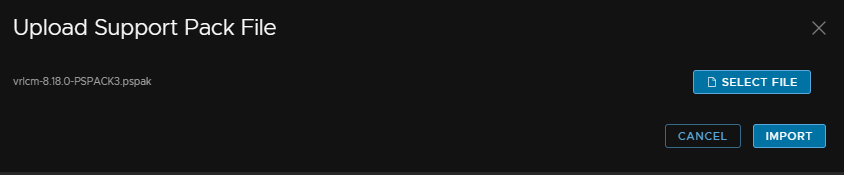
Then Click Here to see the request status
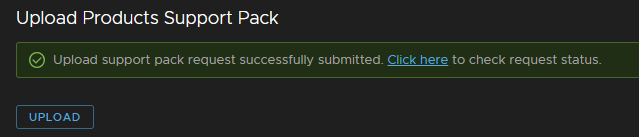
Once the request has gone ok, return to the Settings/Product Support Pack section
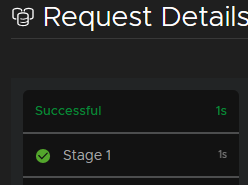
Now we can see the new version at the bottom which we can apply, but first, click on the Create Snapshot button, this snapshots the Aria Lifecycle appliance
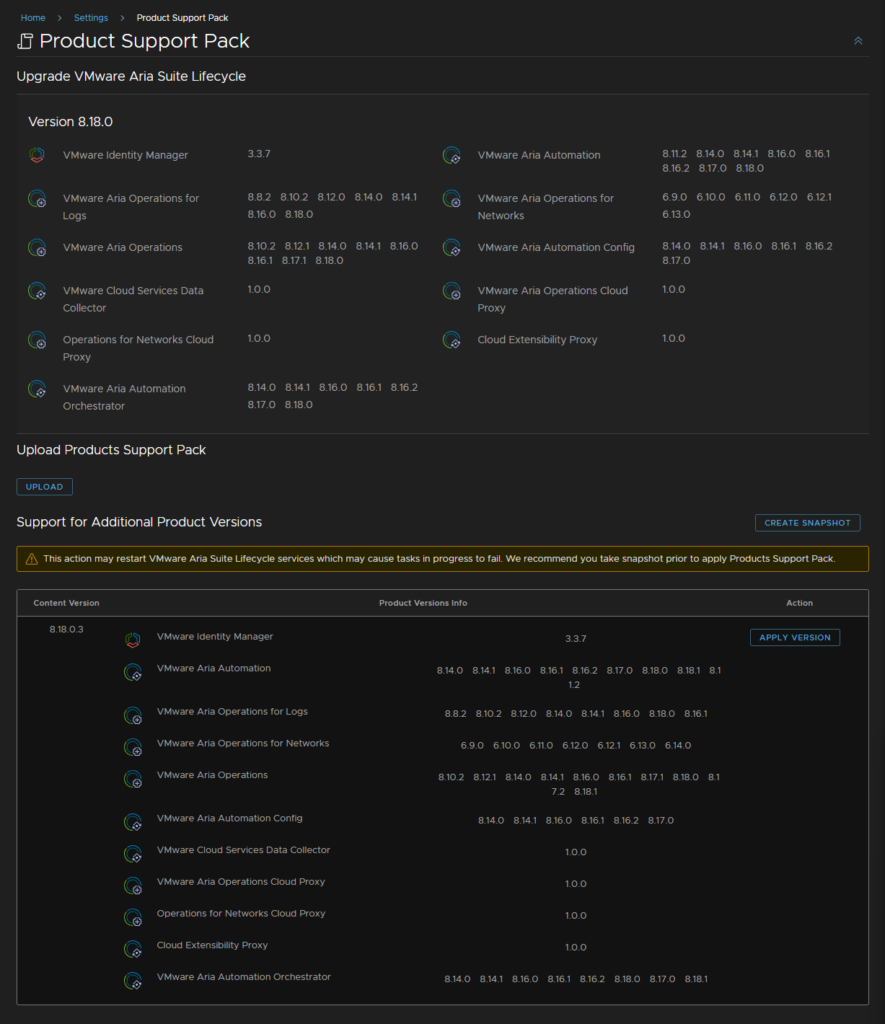
You’ll need to provide vCenter details, and it will ask for a password, which you likely havent uploaded
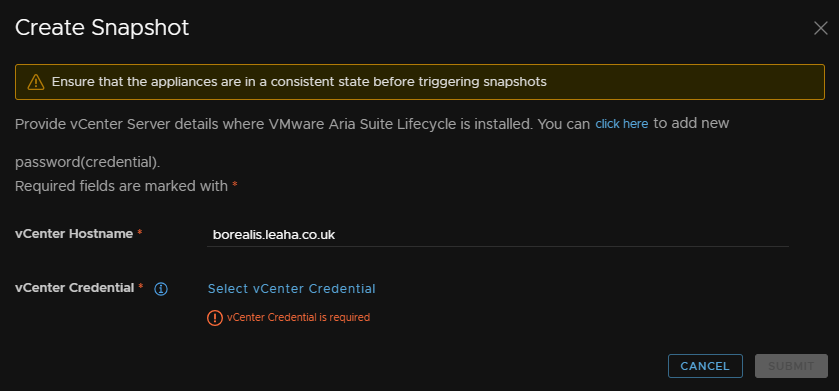
If its not in the list, click Cancel and click the Aria Logo in the top left

Head to locker
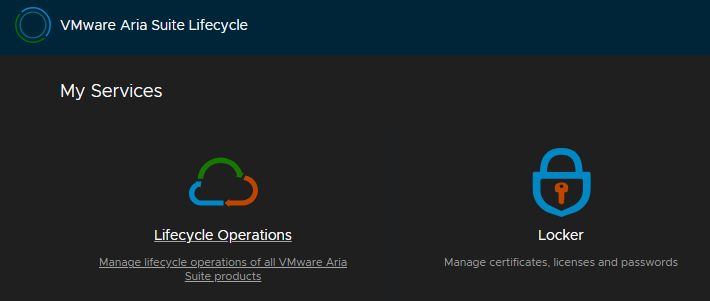
Click into passwords and add

Add the credential for your vCenter
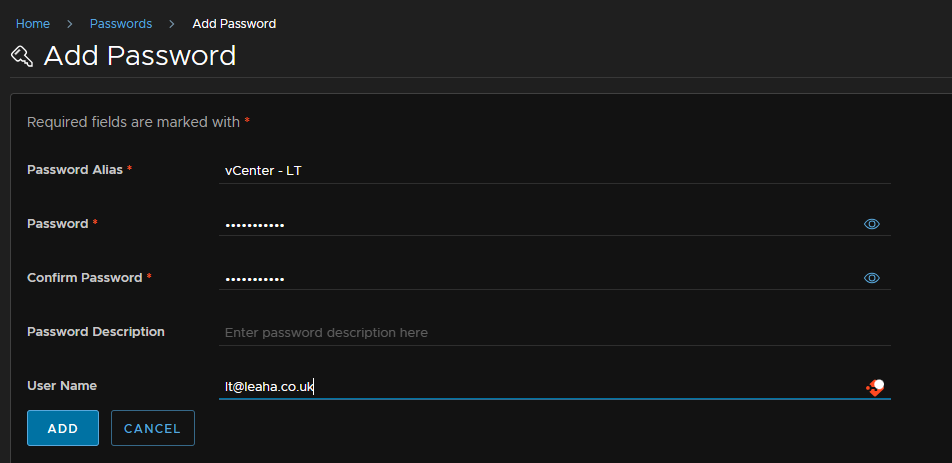
Then retry creating the snapshot, add your details and click submit
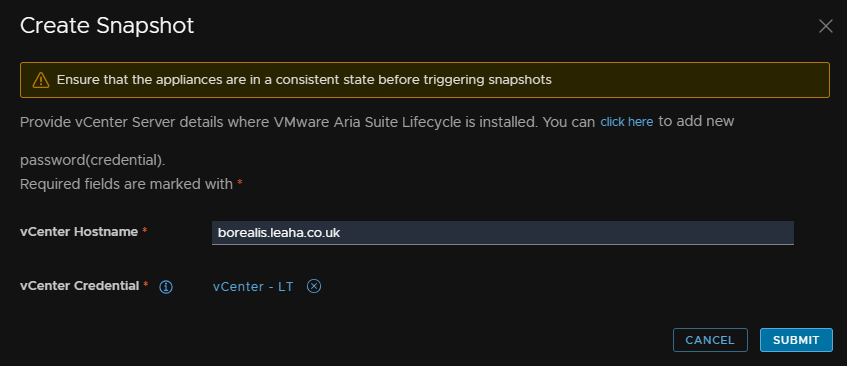
Looking at the VM, in vSphere, you can see its created the snapshot
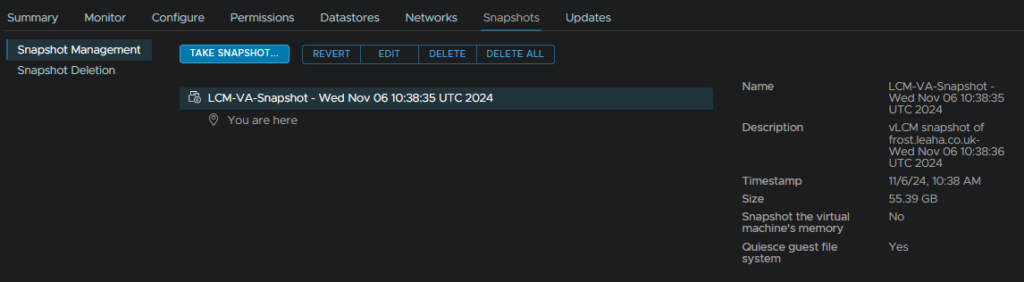
Now click Apply Version from Aria Suite Lifecycle
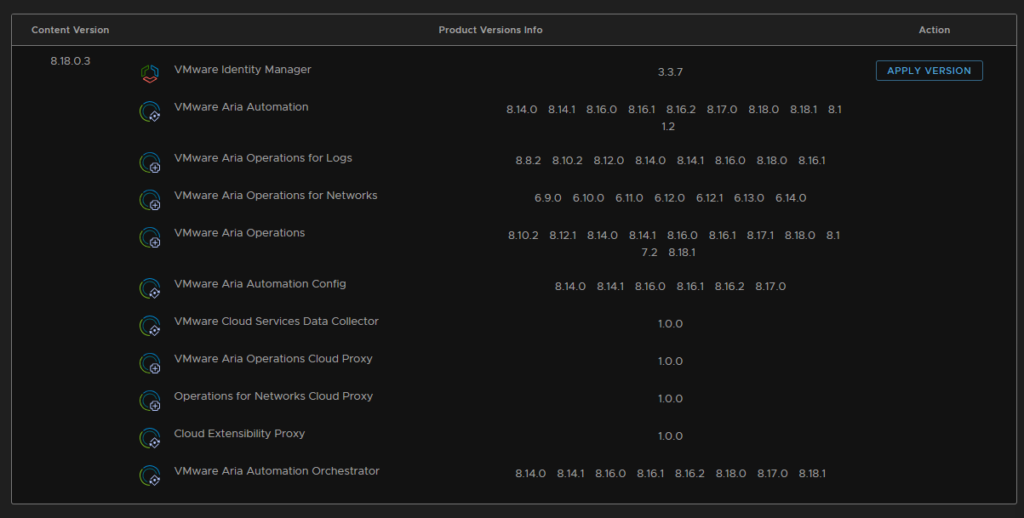
Tick the box to say we have created a snapshot of the lifecycle appliance and click submit
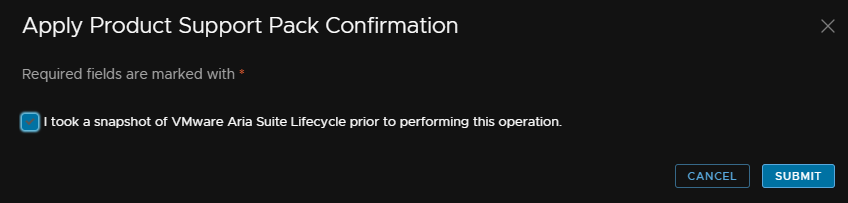
This will take a little bit and reboot the appliance
Once its back up and you log back in, you can check its all been applied from the Lifecycle Operations/Settings/Product Support Pack section
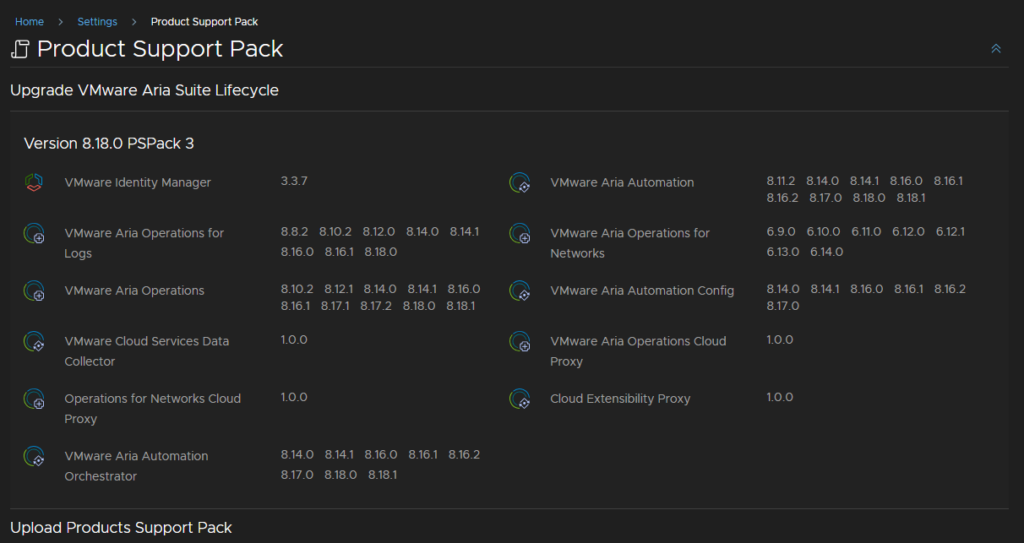
3.3.3 – Mapping Binaries
Head to LifeCycle Operations

Then Settings/Servers And Accounts/Binary Mappings
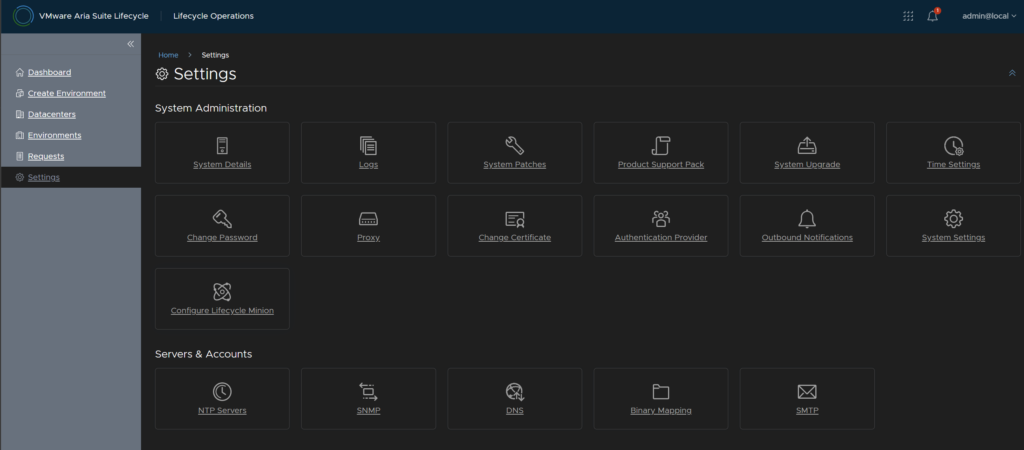
From here add a binary, for appliances and upgrades
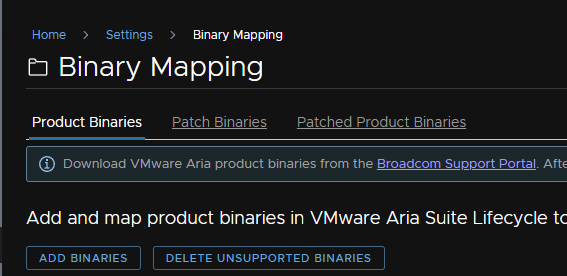
You can do it locally, using WinSCP and putting them into the /data directory, but NFS is much easier, so pop in the location of an NFS share and hit discover, this does still store it locally, so bare that in mind if you get errors for failing to map binaries due to a lack of disk space, so you could delete, for example, the Aria Operations Installer, if you are trying to map the patch
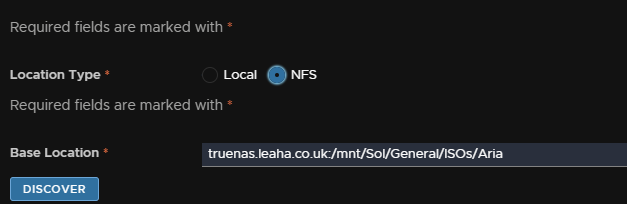
Select the binary you need, eg, Identity Manager, then add
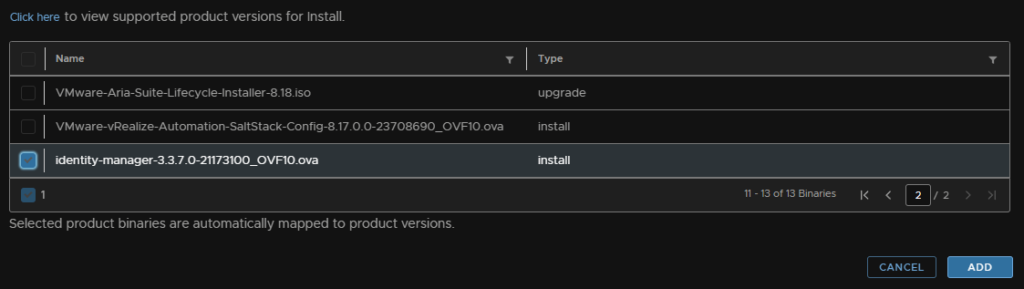
3.3.4 – Upgrading Appliances
Head to Environments under Lifecycle Operations and click view details on youre environment, for VVF there should only be one with Aria Ops and Aria Logs, as I installed Automation, there is a global environment and Aria Automation is mentioned in my environment
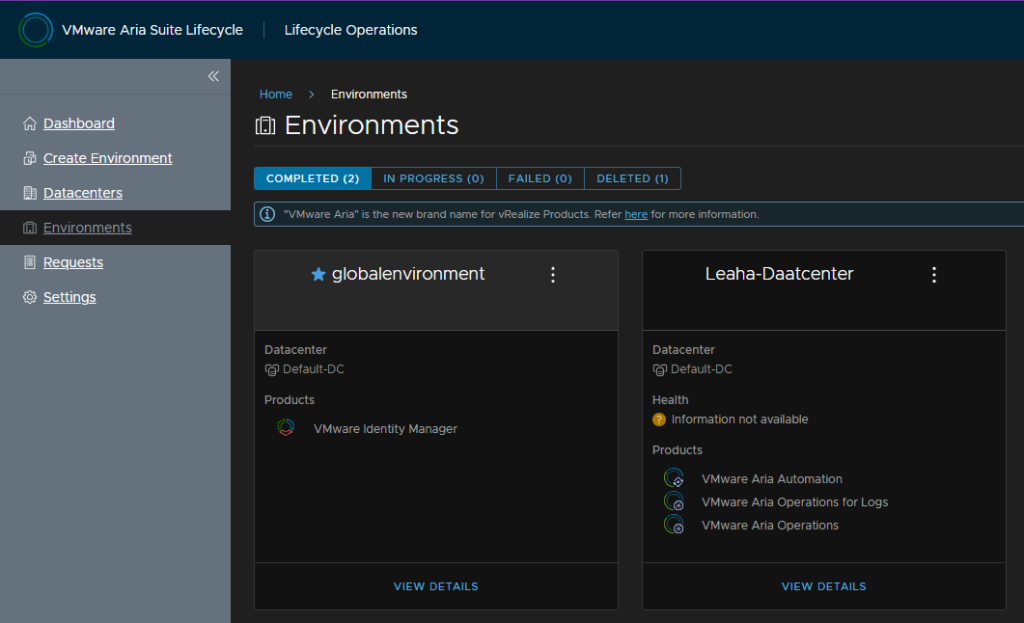
Click Upgrade Planner, it doesnt matter what appliance tab your on

Select everything you want to upgrade, and ensure the target version is selected, for me there is an update for Aria Automation and Aria Operations, so only select those, if there isnt an update, leave it as is
Then click Generate Upgrade Plan
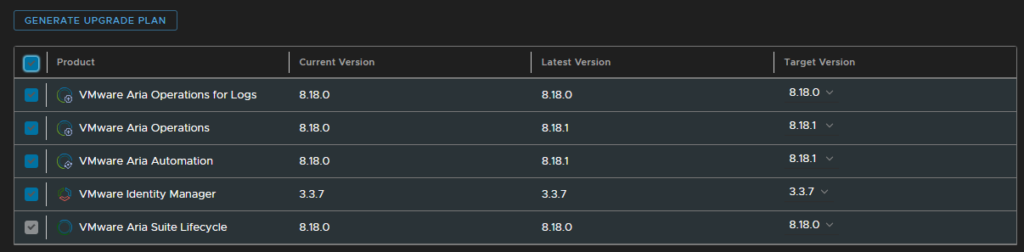
You may see this, however with the binary mapped and detected, it still does this

I have also seen it fails to reach the interoperability matrix, this was tested on two separate environments with access to the internet, so I can only conclude its broke with Broadcom changing URLs, despite them putting an article saying this was fixed in 8.18

In the vSphere upgrade order appliances should be patched in the following order
- Aria Suite Lifecycle Manager
- Identity Manager
- Aria Log Insight – Update Aria Log Insight content packs, if required
- Aria Operations Manager – Update Aria Operations management packs, if required
- Aria Network Insight
- Aria Automation
Aria Lifecycle can still make this process a little easier with the patch binaries mapped, however you’ll need to check the interoperability matrix here manually, generally, within a couple of versions, eg Aria Operations 8.16.x to 8.18.y can be updated without issues, all you need to check is the supported upgrade path, and if your versions are wildly out, over 2-4 versions, that you can do it all in one go
So, back in the datacenter view, we have our binaries mapped, and we have worked out that we are happy with the upgrade path/order
For me, I have Aria Automation, Aria Logs and Aria Operations, Aria logs doesnt have an update, Aria lifecycle was already checked to be on the latest, so I will upgrade Automation first, under the Automation tab, click upgrade
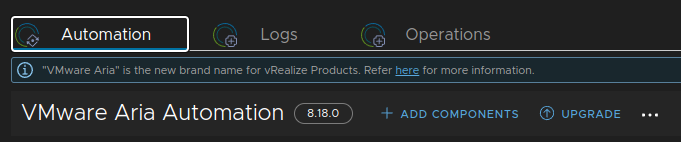
Trigger an Inventory Sync
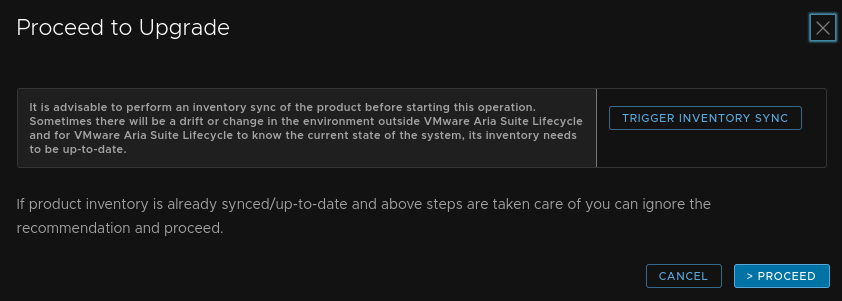
And hit submit
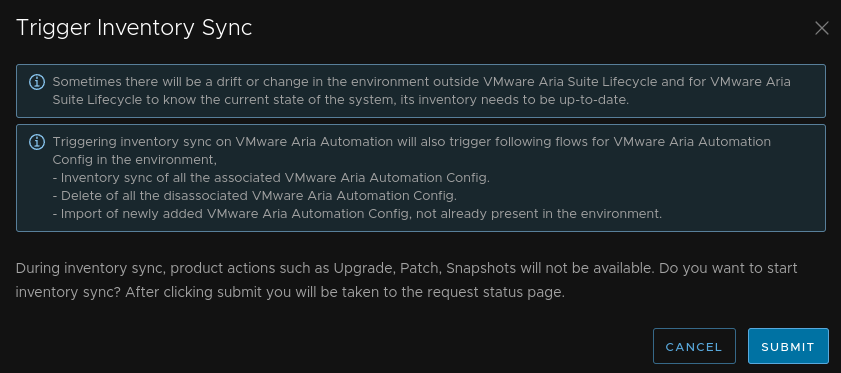
Once thats done, re click Upgrade, then proceed
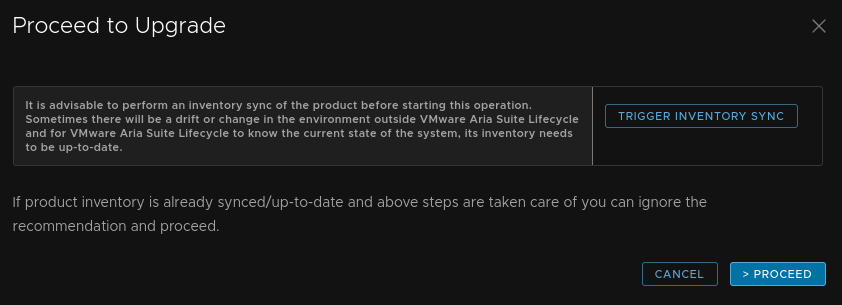
As we mapped the patch binary, it should get populated and we can click Next in the bottom right
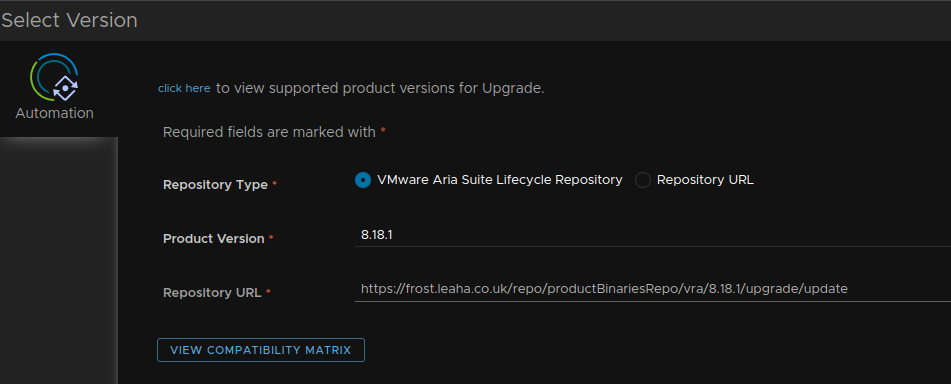
Leave this on the default and click next again
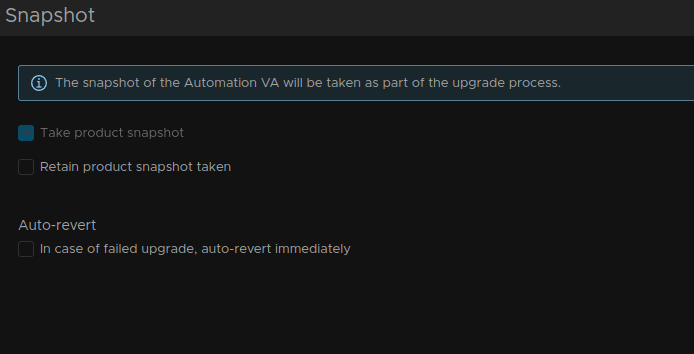
Run the Precheck
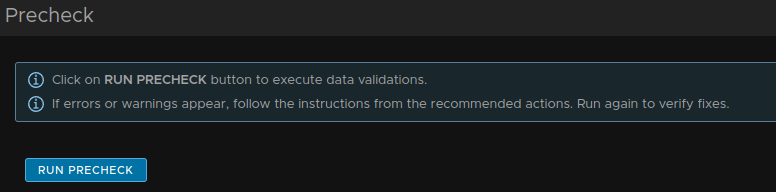
Double check the requirements and once youre happy, click the check box and click Run Precheck
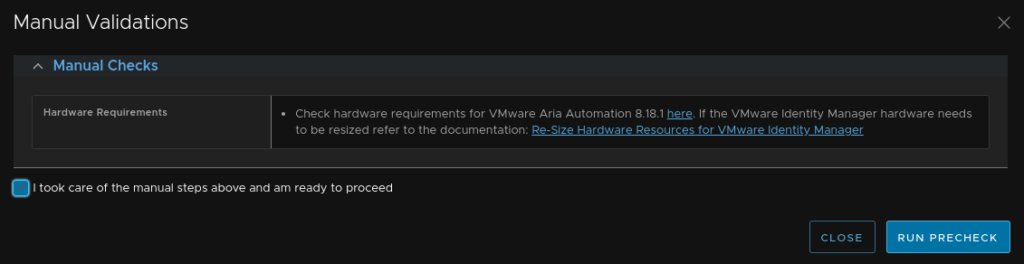
Once thats all green, click Next and then Submit
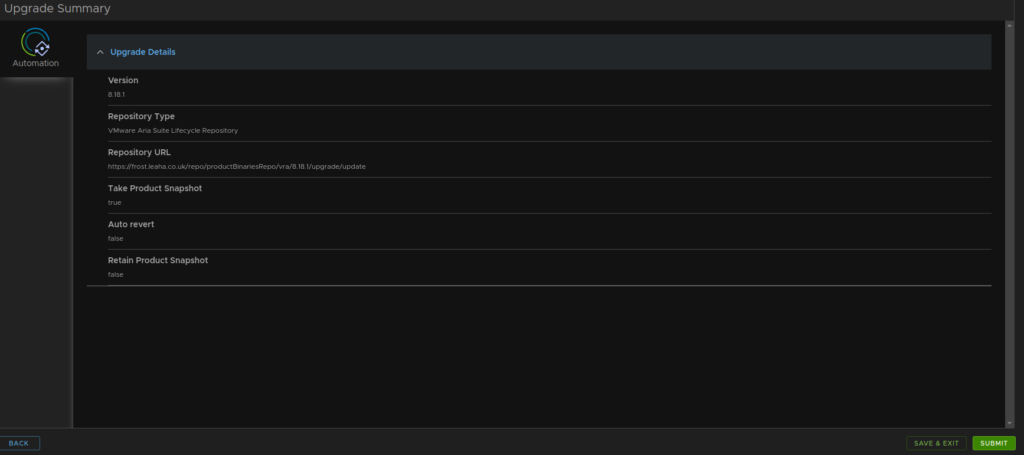
After about 90 mins, Aria Automation has been upgraded
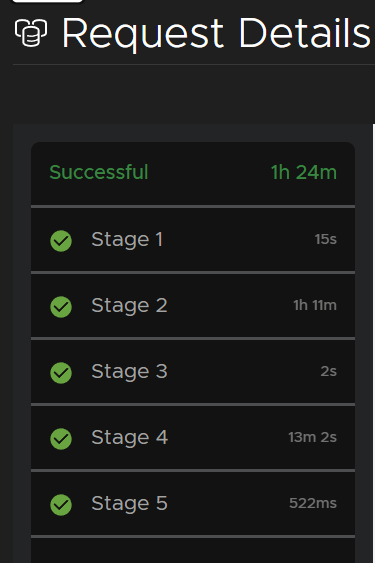
Then I can repeat with the one click upgrade of Aria Operations
You may see Aria Operations error out on SSH like this
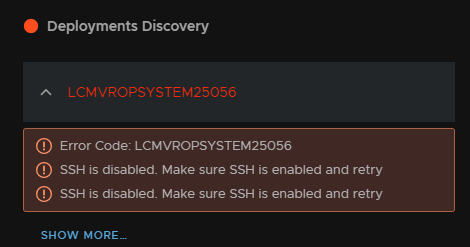
If you cant see the status, it will be In progress under Requests
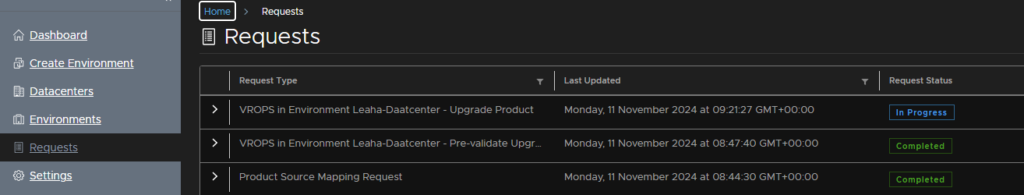
If so, head to the admin port on
https://fqdn/admin
Or
https://ip/admin
And enable SSH from the system status page
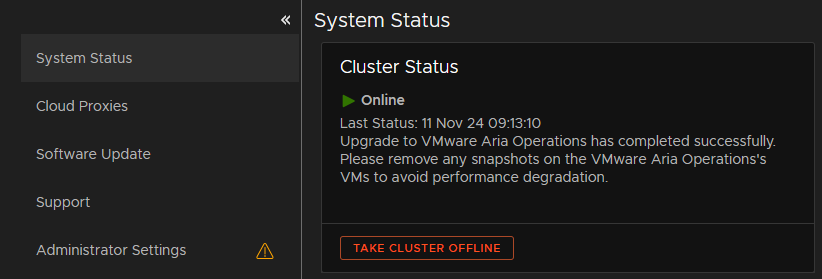
SSH is on the right on the node

Back in Aria Lifecycle, click retry
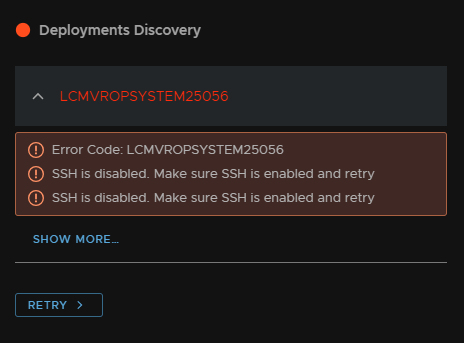
And submit
Once thats done, I can see its been upgraded